The Local Lowdown
Quick Take:
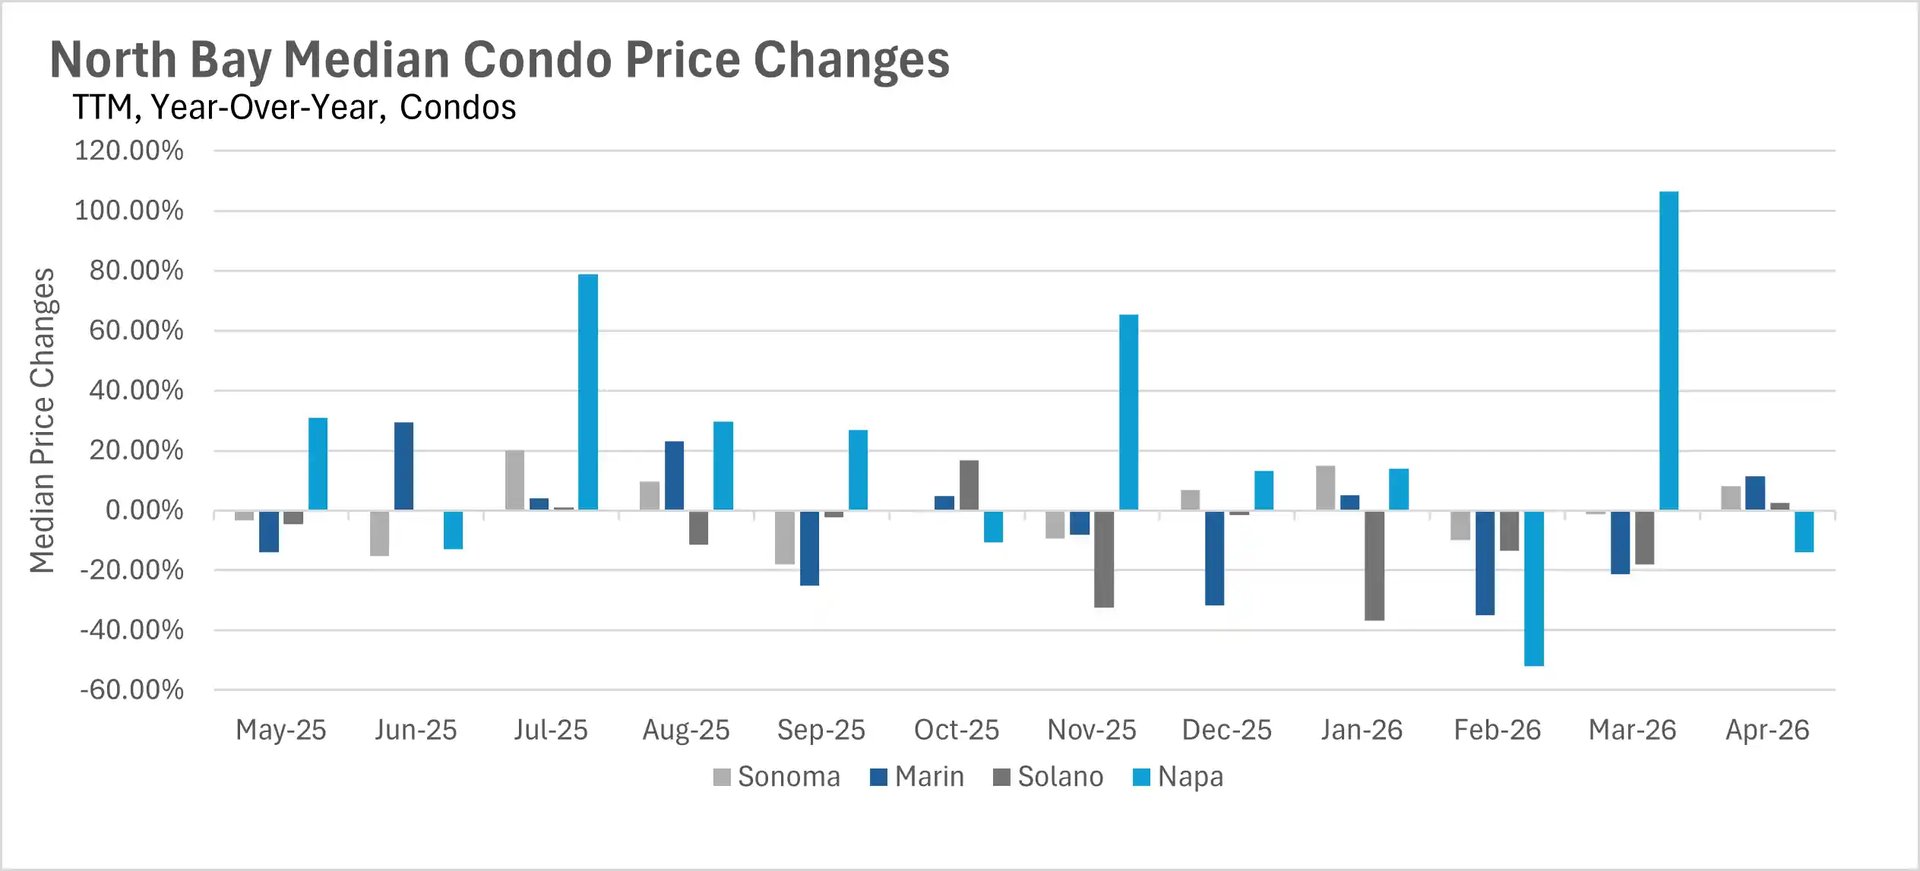
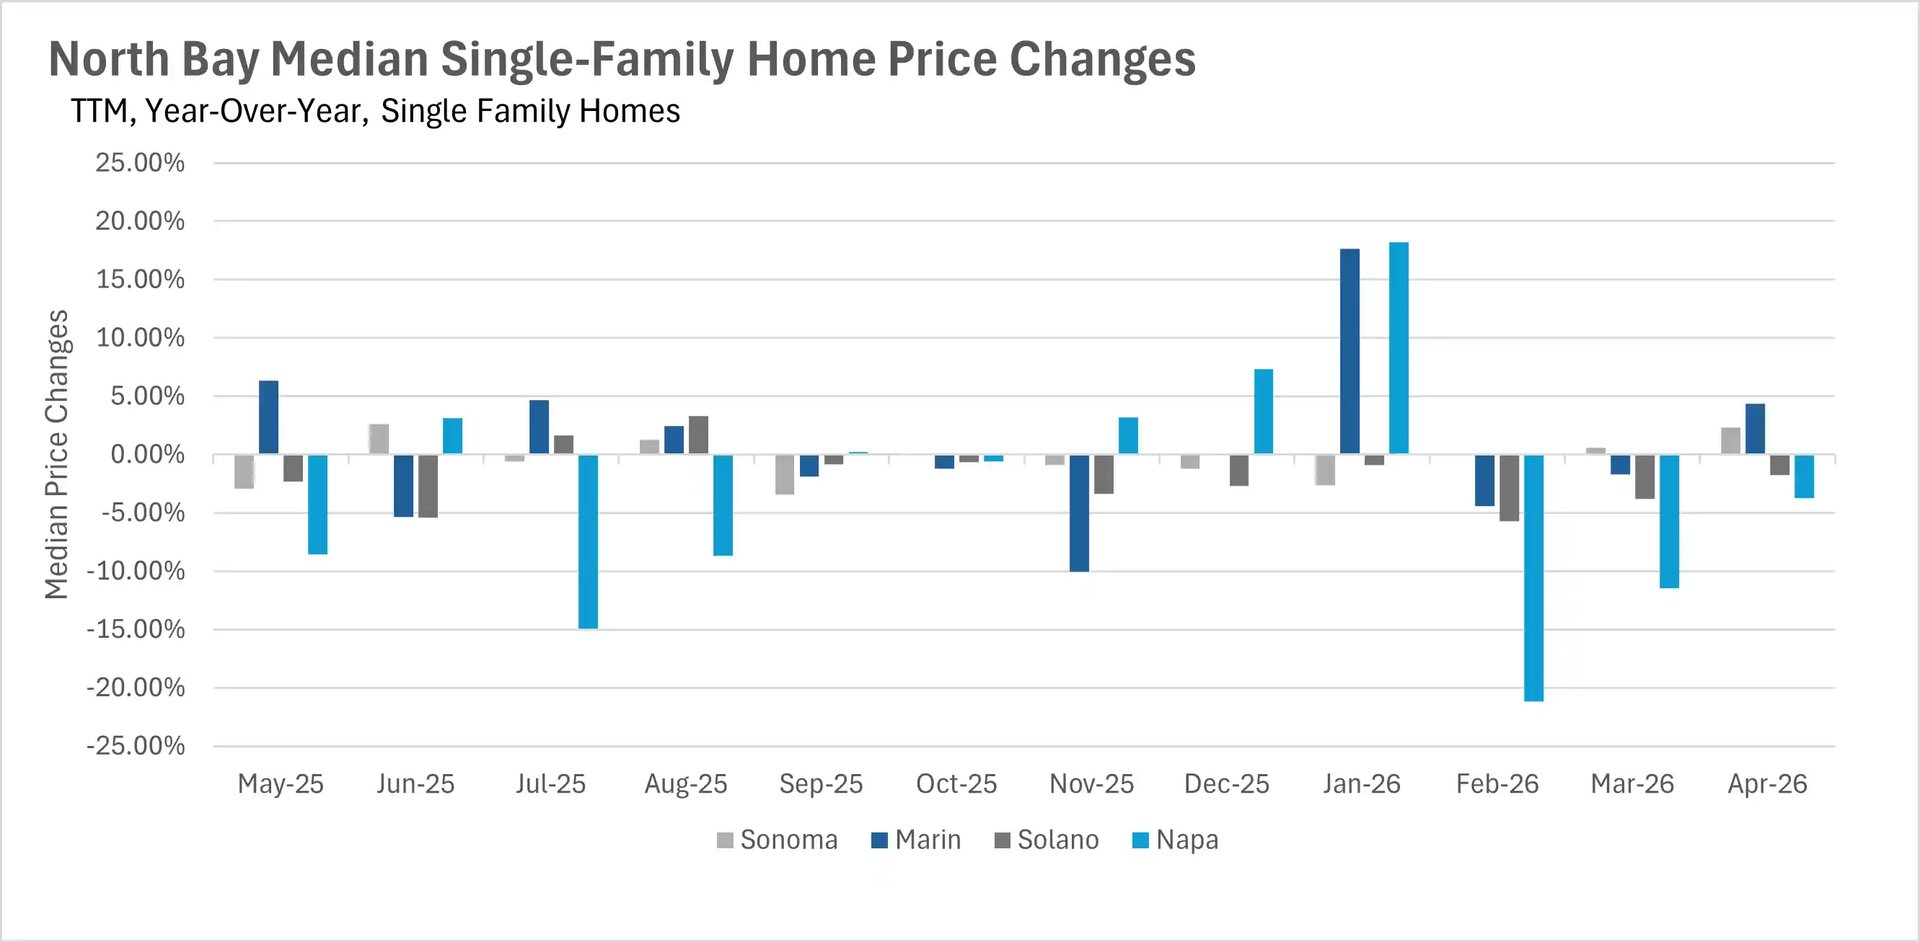
- Median sale prices gained ground in Sonoma and Marin Counties, with year-over-year increases of 2.35% and 4.38%, respectively, while Solano and Napa Counties continued to soften.
- Inventory remains well below last year's levels, with single-family home inventory down 36.98% and condo inventory down 24.57% on a year-over-year basis.
- Listings are moving at a brisk pace, with single-family homes in Sonoma, Marin, and Solano Counties all selling in less than a month.
Note: You can find the charts/graphs for the Local Lowdown at the end of this section.
Marin and Sonoma lead the spring rally
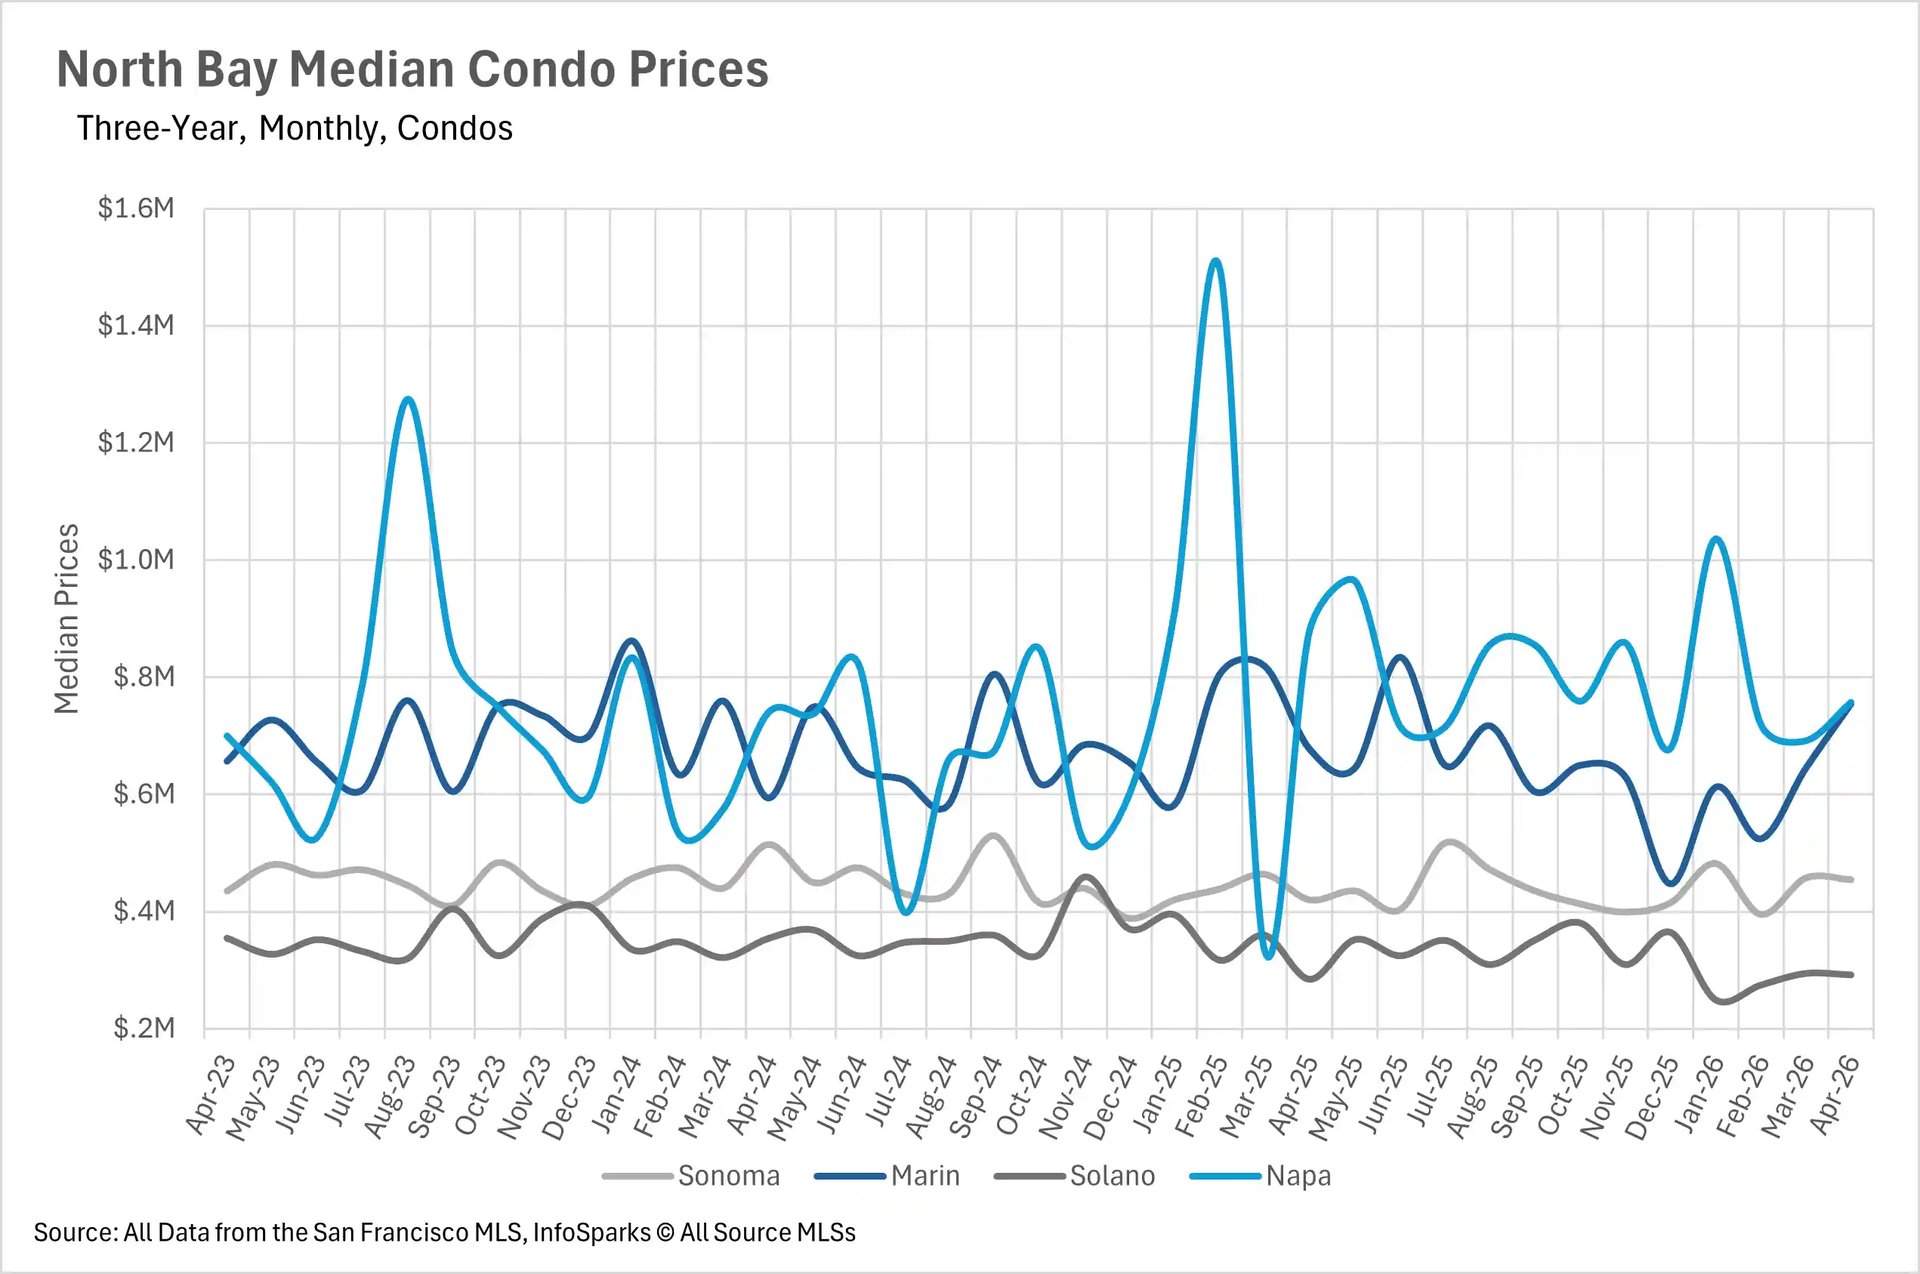
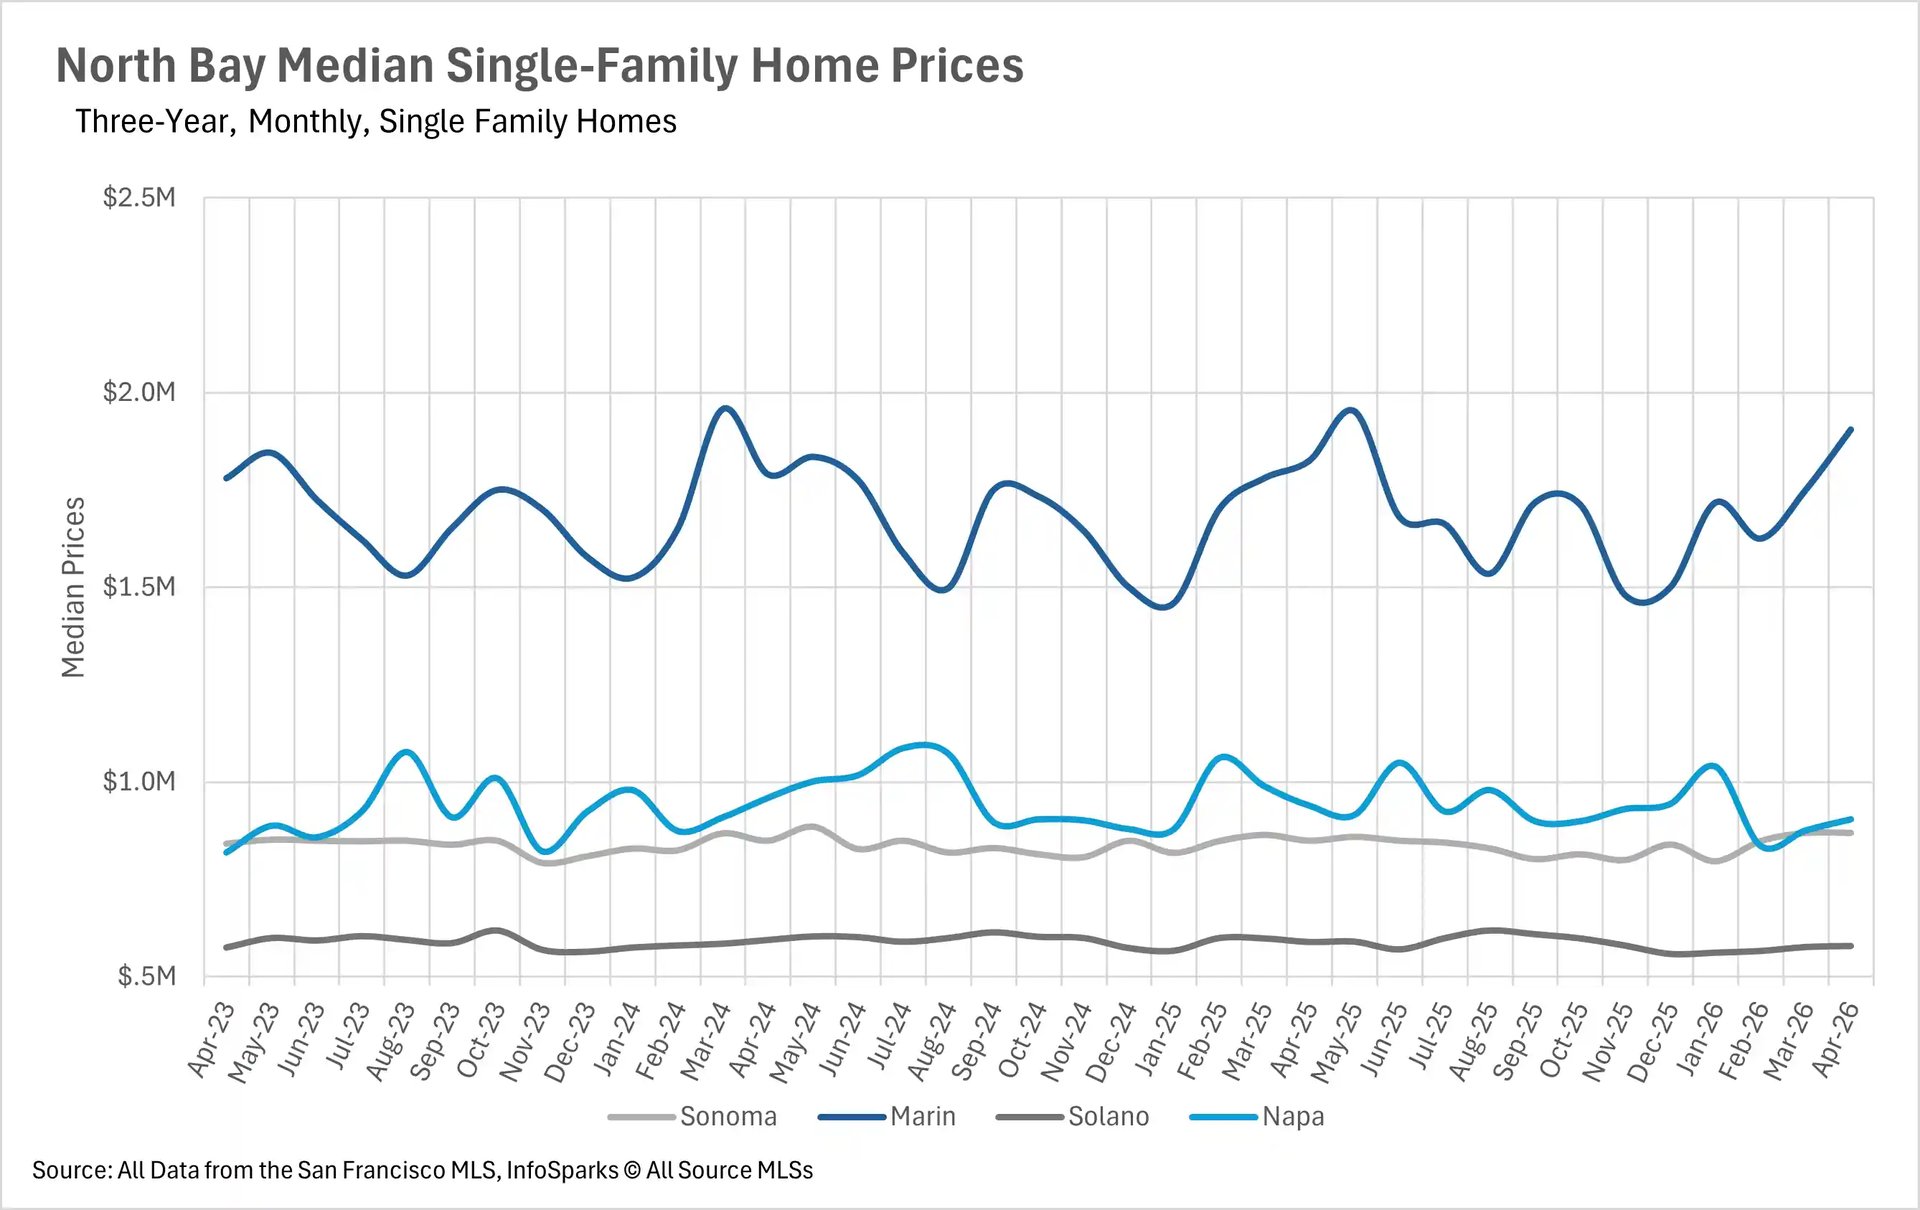
April brought encouraging news for homeowners in the western reaches of the North Bay. Marin County saw the strongest gains, with the median single-family home selling for $1,905,000, a 4.38% increase compared to April 2025. Sonoma County also posted solid gains, with the median sale price rising 2.35% year-over-year to $870,000. However, the eastern and northern parts of the region continued to struggle. Solano County saw a 1.78% decline to $579,000, while Napa County dropped 3.72% to $905,000. The condo market painted a more positive picture this month. Marin County condos surged 11.44% year-over-year, Sonoma County gained 8.21%, and Solano County ticked up 2.61%. Napa County condos were the lone decliner, falling 13.92% compared to last April.
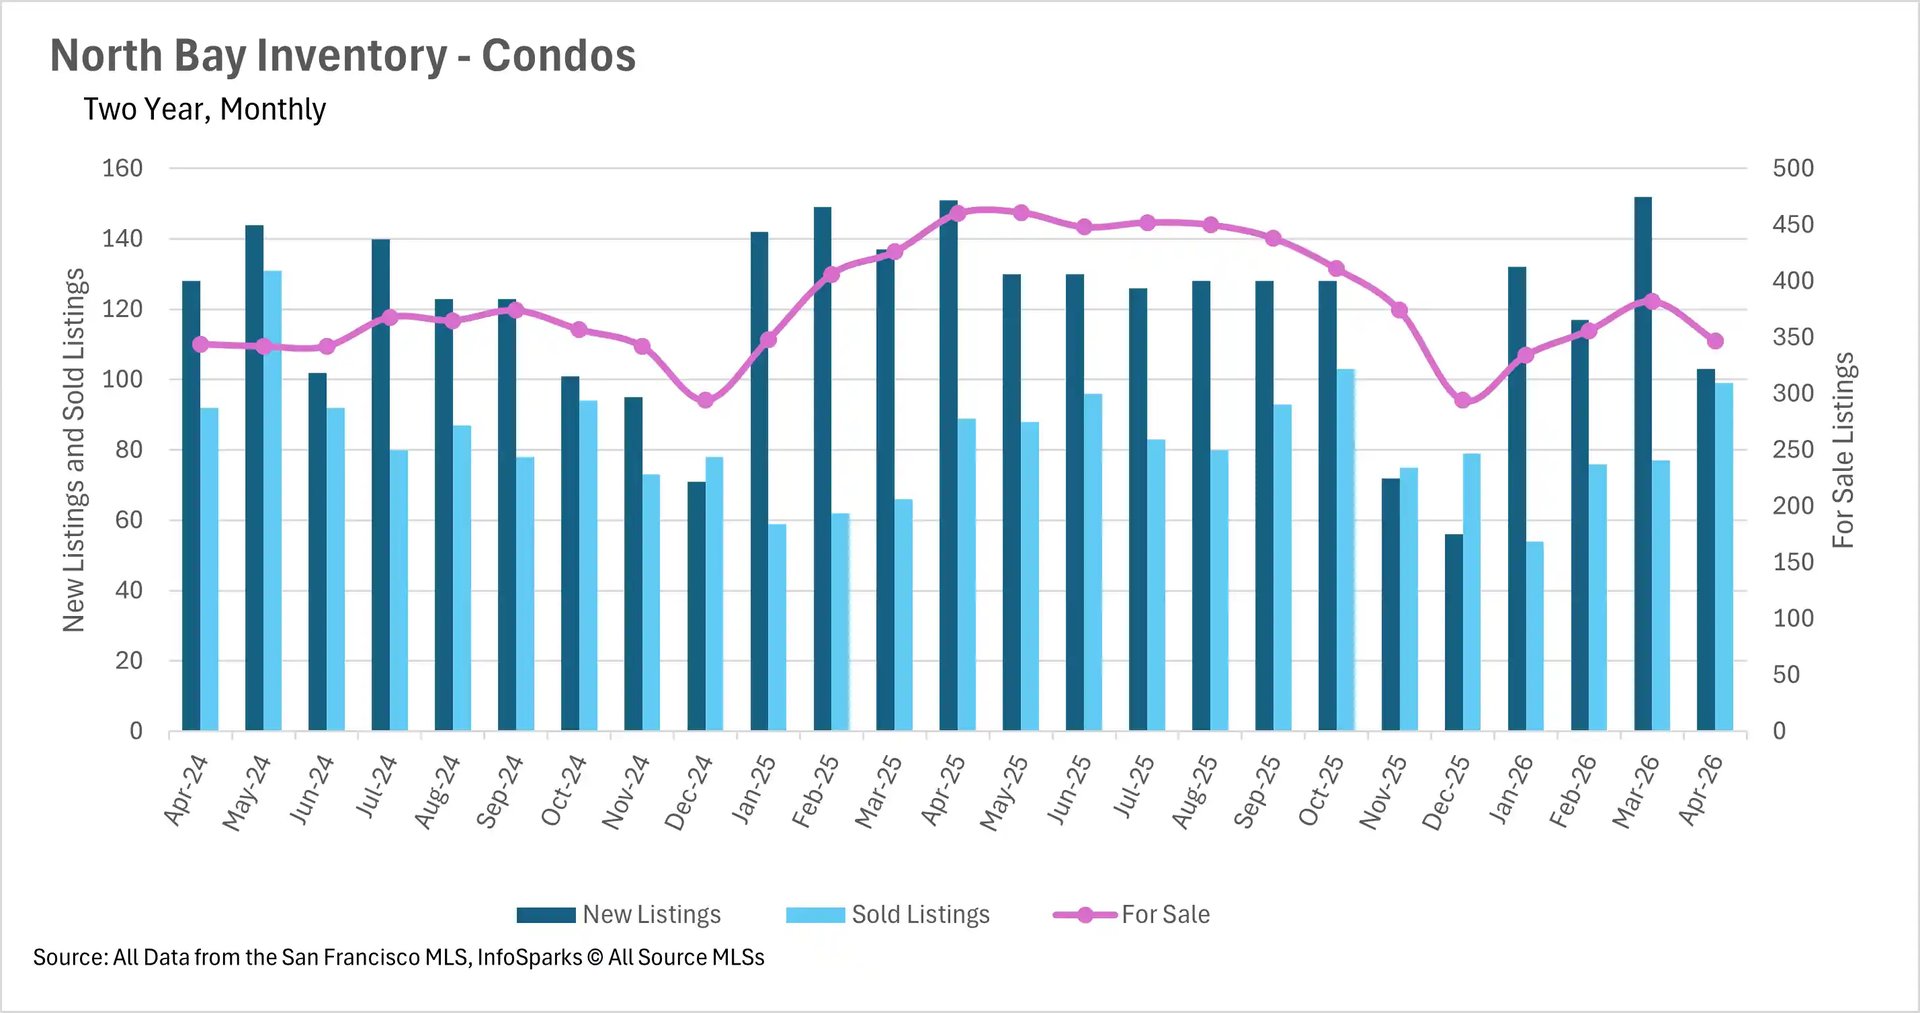
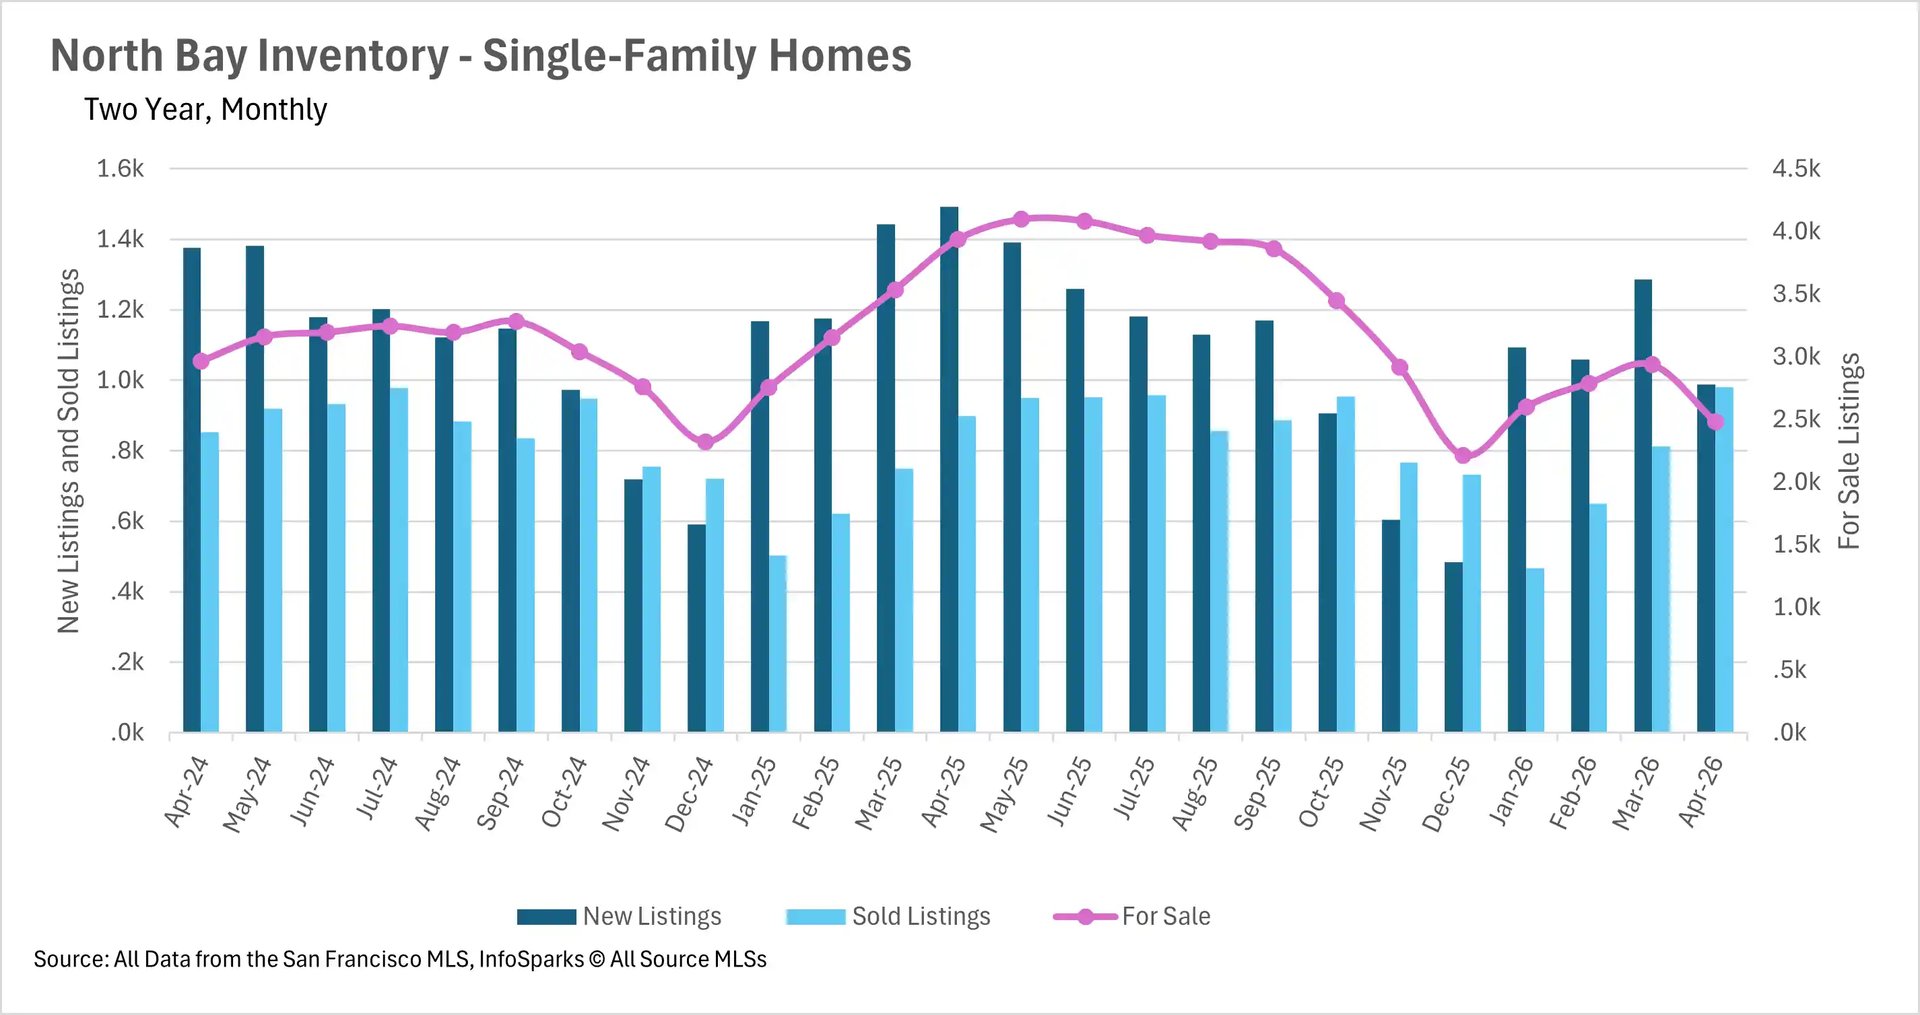
Inventory crunch continues despite spring selling season
Despite the peak of spring selling season, inventory levels remain stubbornly low across the North Bay. Single-family home inventory now sits at 2,481 units, down 36.98% compared to April 2025. The condo market tells a similar story, with just 347 units available, a 24.57% year-over-year decline. The silver lining is that the market is showing signs of life. Sales activity is up 9.01% year-over-year for single-family homes and 11.24% for condos. In fact, April saw 980 single-family home sales, nearly matching the 988 new listings that hit the market. This tight balance between supply and demand continues to put upward pressure on prices in the most desirable markets.
Homes are selling faster than they have in years
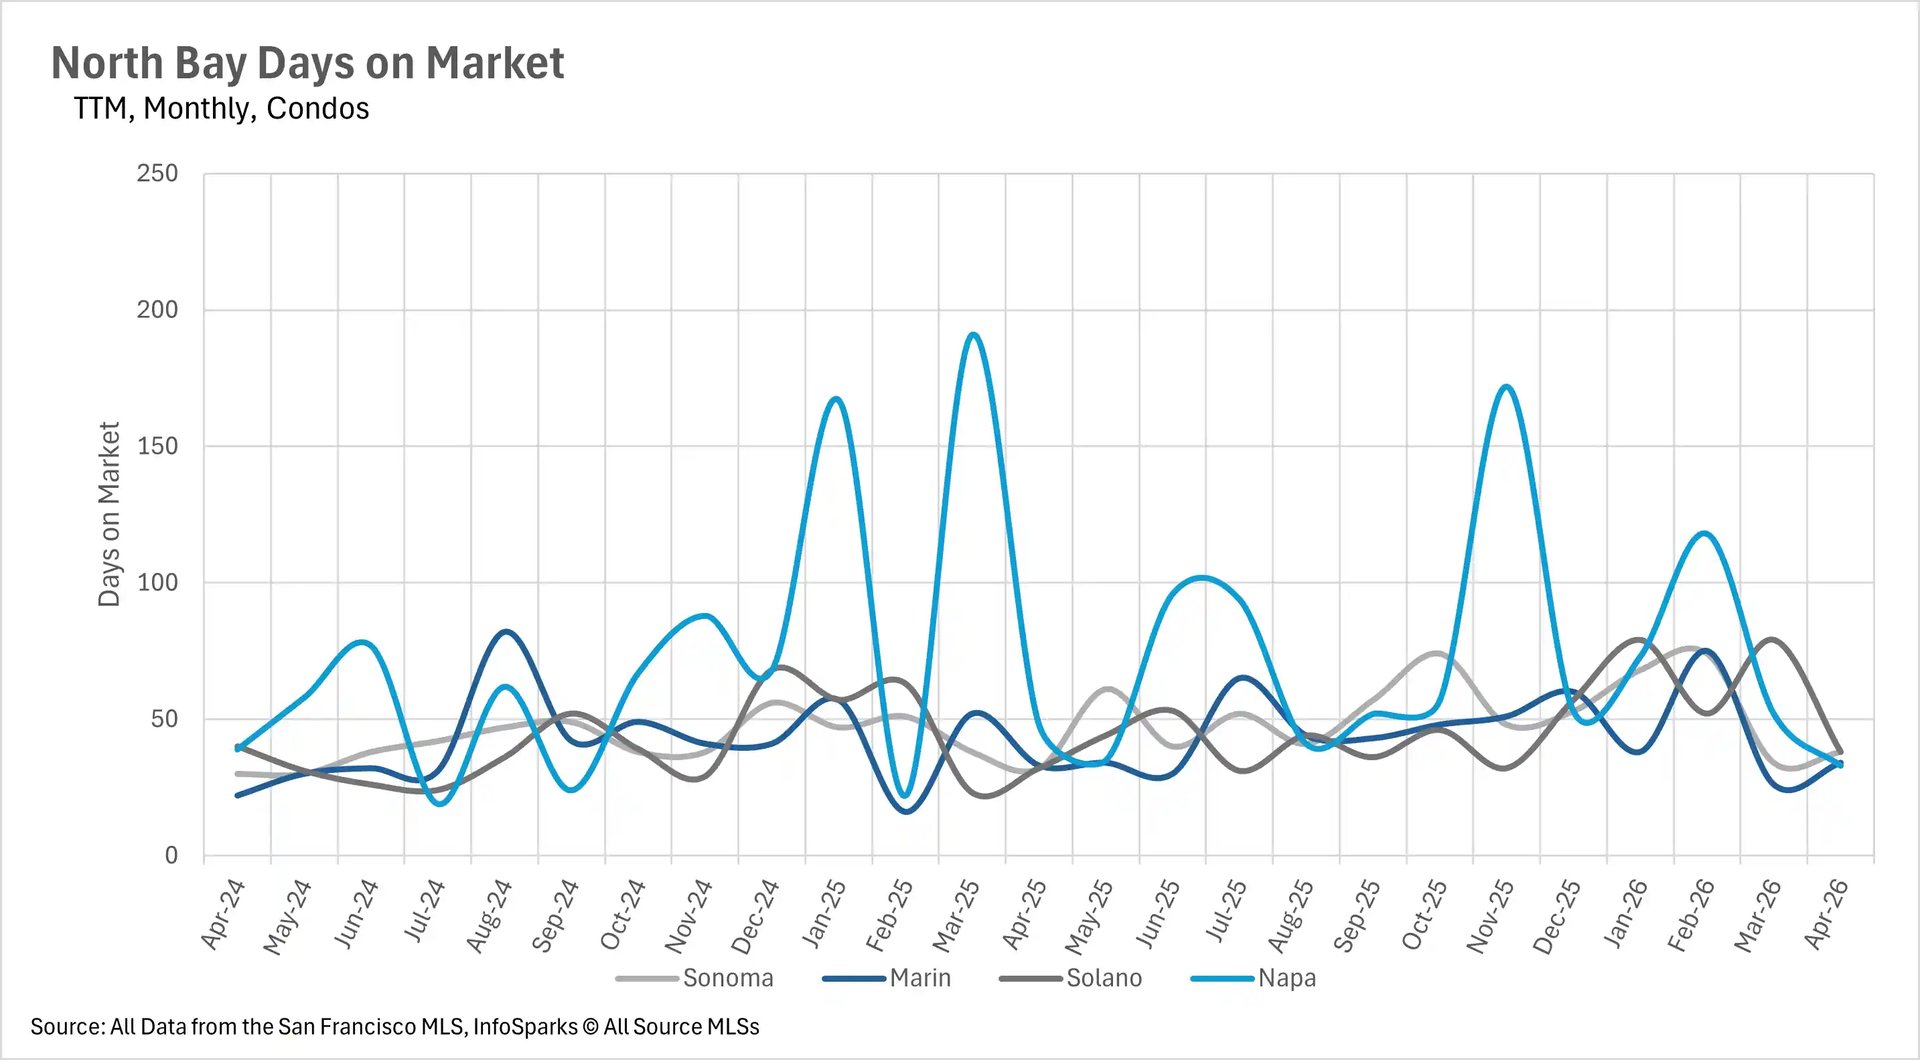
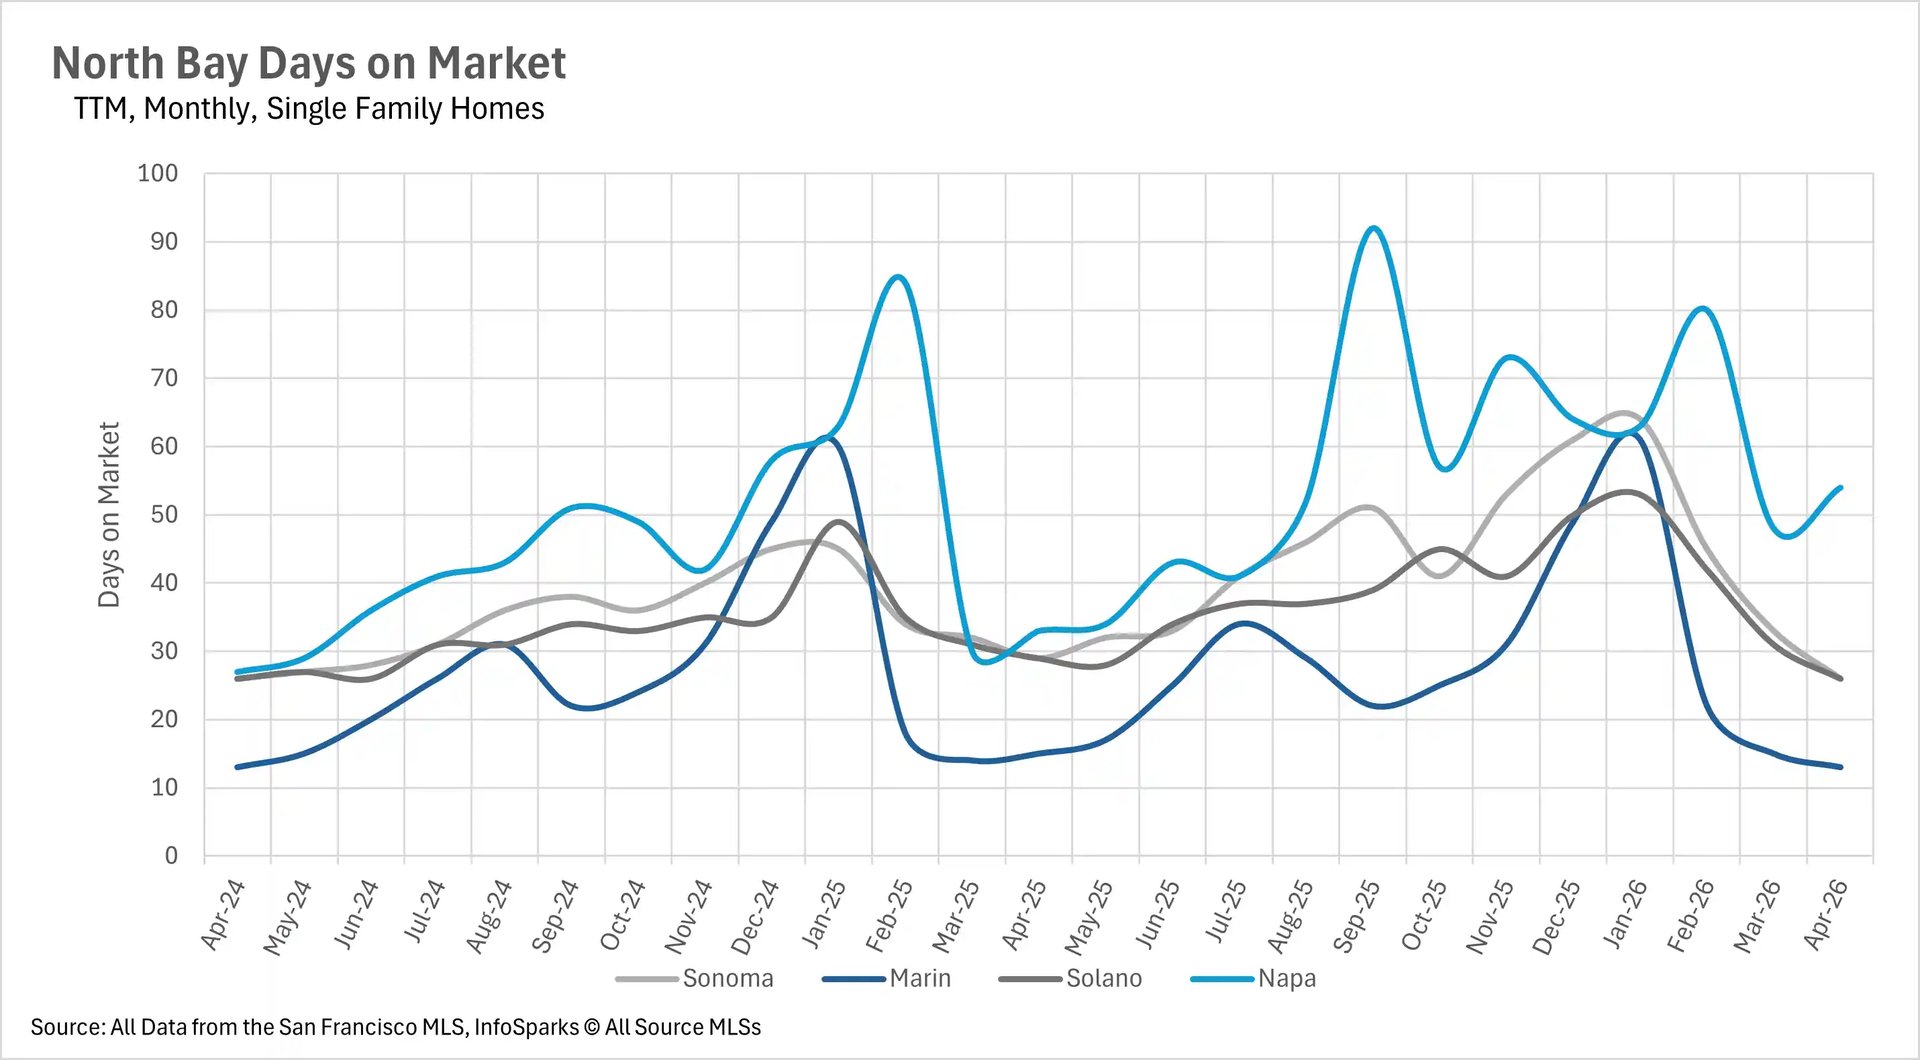
April brought a significant acceleration in the pace of sales across most of the North Bay. Single-family homes in Sonoma, Marin, and Solano Counties are all selling in less than a month. Marin County led the way with a median of just 13 days on market, matching last April's figure. Sonoma and Solano Counties both came in at 26 days, representing 10.34% improvements compared to last year. Napa County remains the outlier, with the median single-family home spending 54 days on the market, a 63.64% increase year-over-year. The condo market was more even split. Napa County condos are actually moving 31.25% faster than last year, while Sonoma and Solano County condos are both taking about 19% longer to sell.
Seller's market conditions intensify as spring peaks
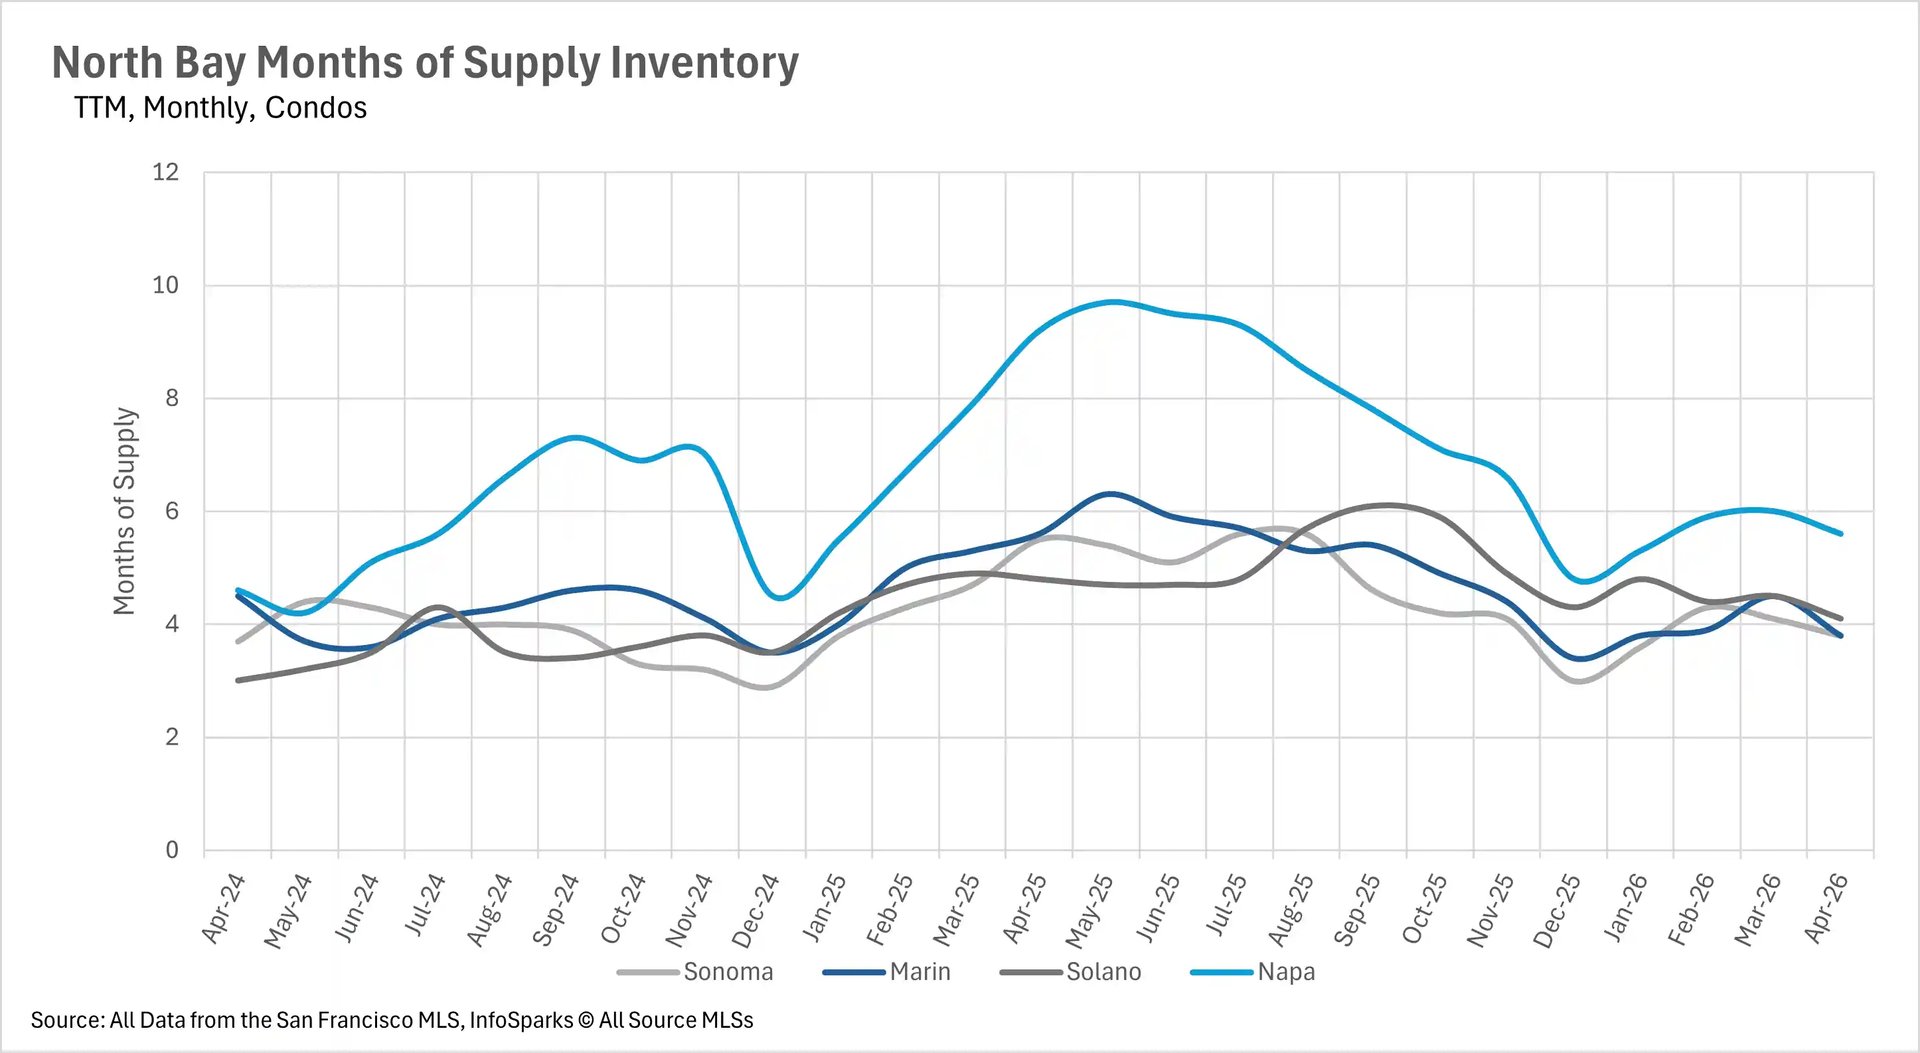
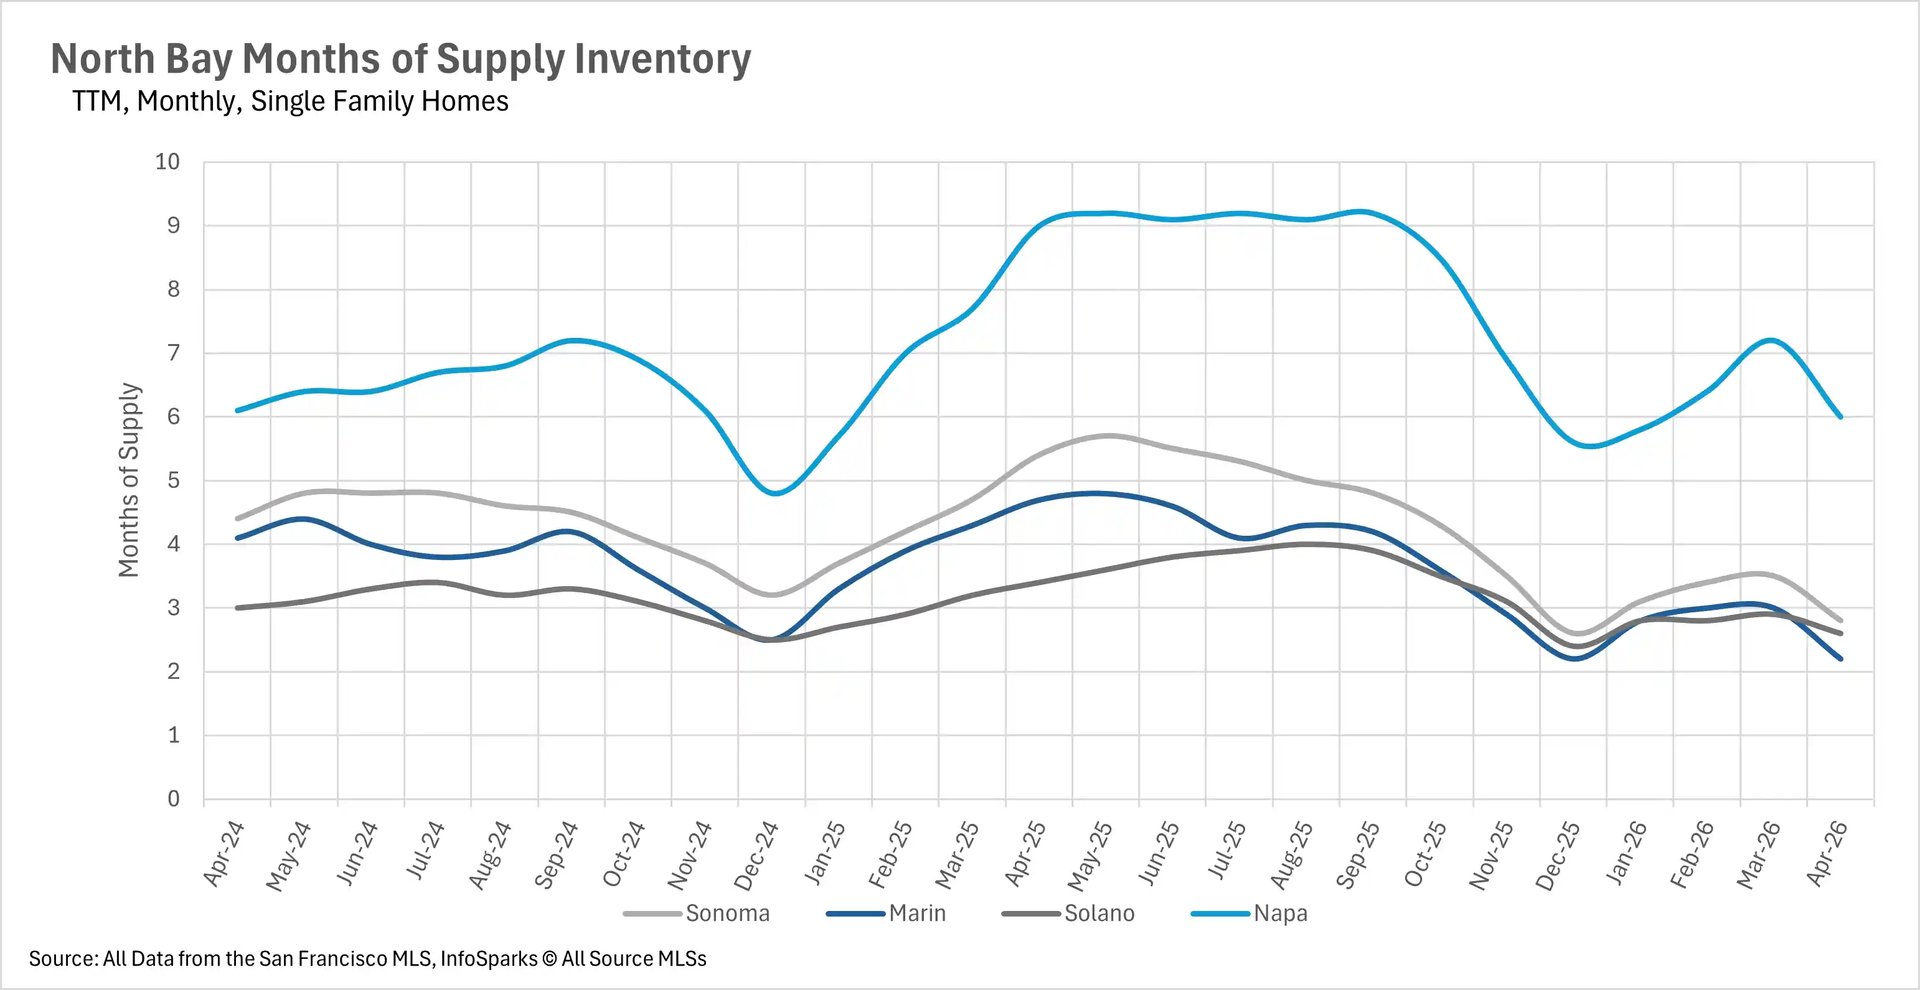
When determining whether a market is a buyers' market or a sellers' market, we look at the Months of Supply Inventory (MSI) metric. The state of California has historically averaged around three months of MSI, so any area with at or around three months of MSI is considered a balanced market. Any market that has less than three months of MSI is considered a seller's market, whereas markets with more than three months of MSI are considered buyers' markets.
April brought a significant tightening of inventory across the North Bay, pushing most single-family home markets firmly into seller's territory. Marin County has just 2.2 months of supply, down 53.19% year-over-year. Solano County sits at 2.6 months (down 23.53%), and Sonoma County has 2.8 months of supply (down 48.15%). Even Napa County, which has historically been more balanced, has tightened to 6 months, to 33.33% year-over-year decline. The condo market remains more favorable for buyers, although conditions are tightening there as well. Marin and Sonoma Counties both have 3.8 months of supply (down about 31-32% year-over-year), Solano County has 4.1 months (down 14.58%), and Napa County has 5.6 months (down 39.13%). As we head into the summer months, sellers continue to hold a significant advantage in the single-family home market.