The Local Lowdown
Quick Take:
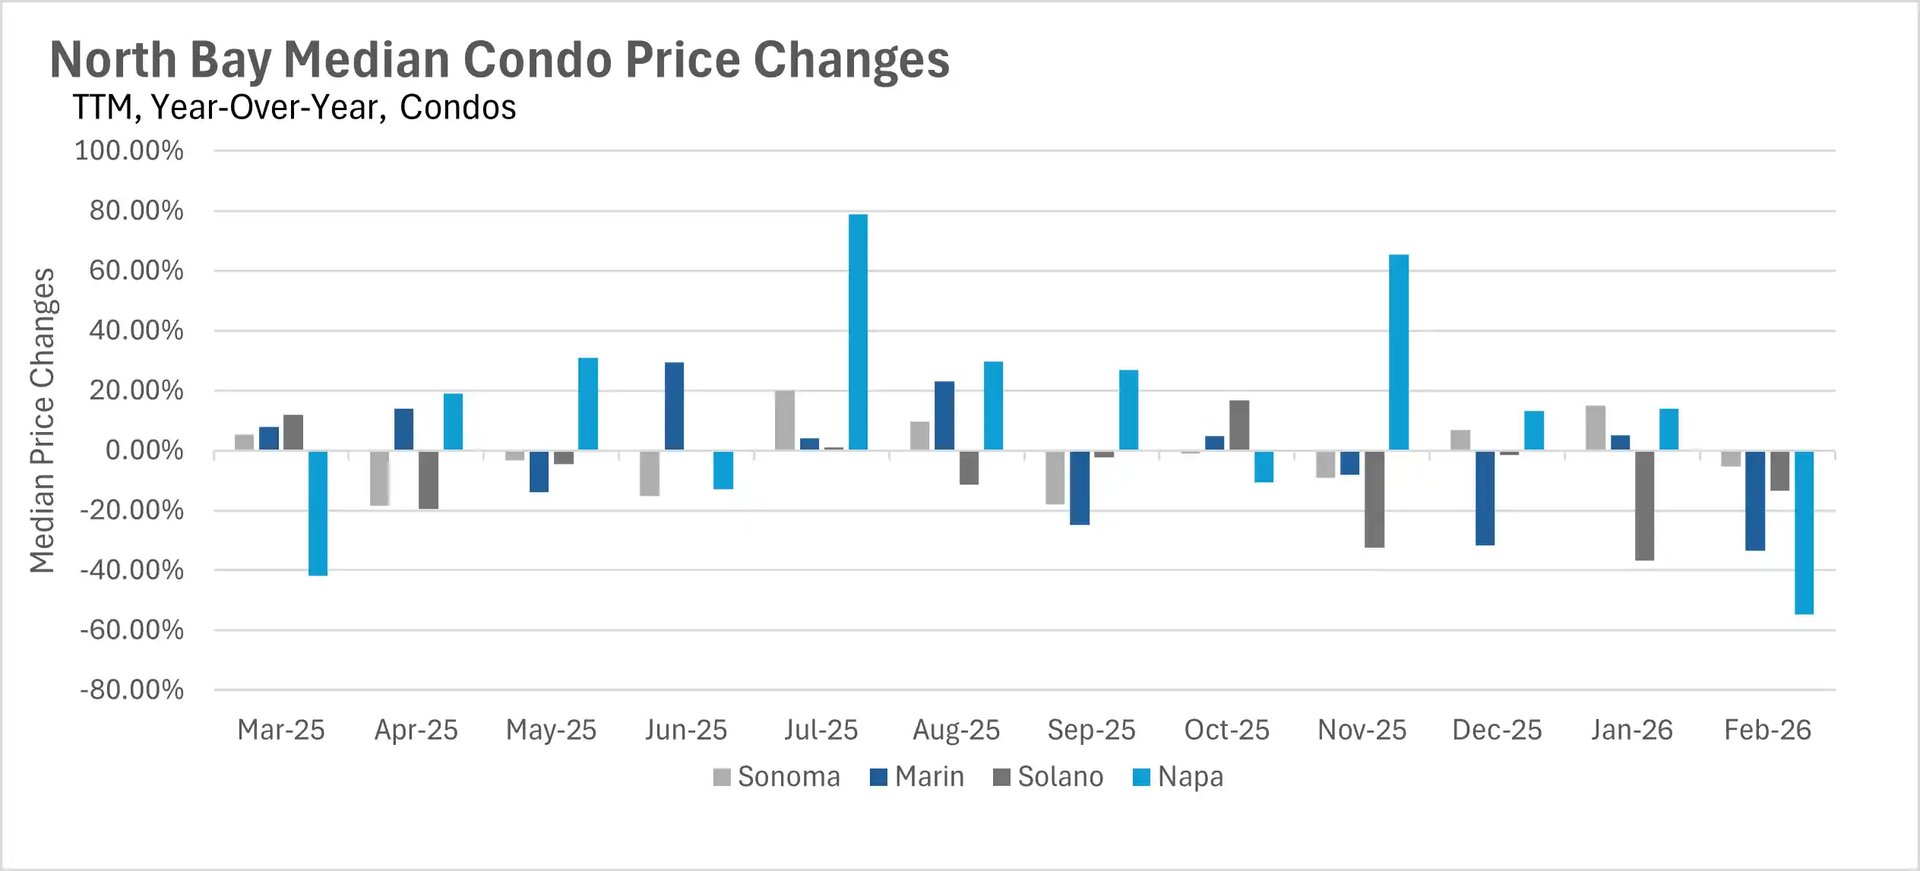
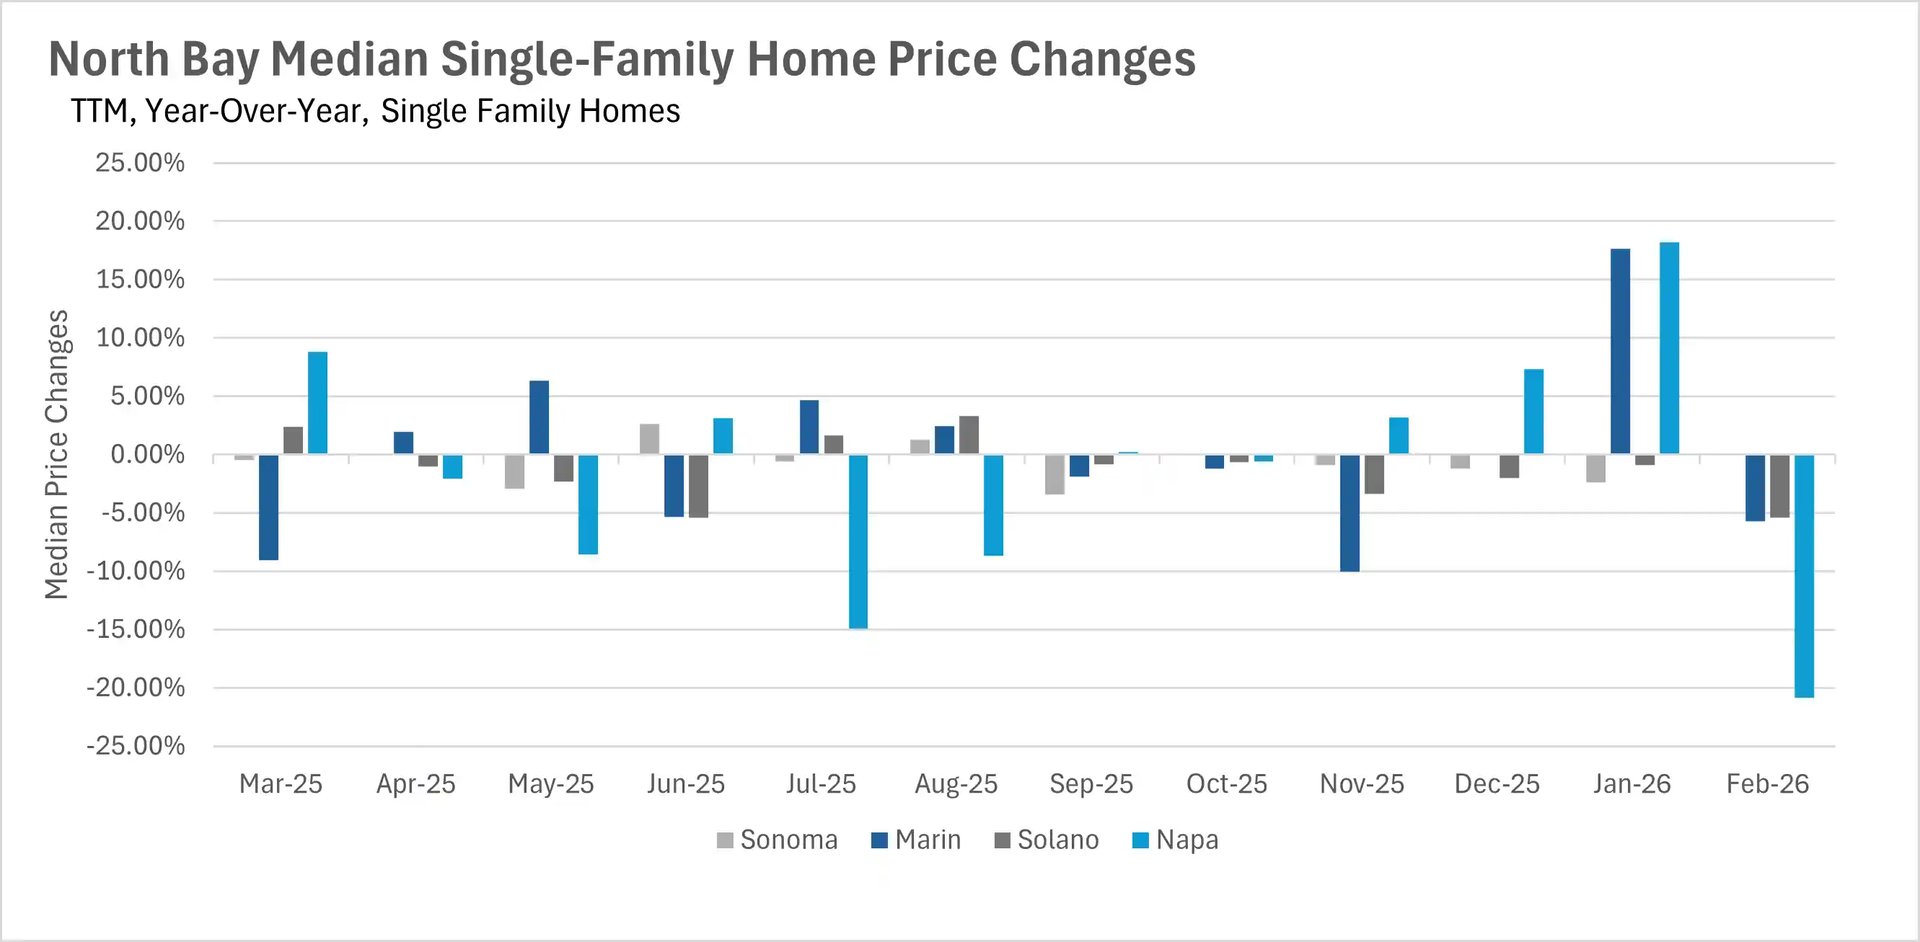
- Median sale prices declined across most of the North Bay in February, with Napa County single-family homes down 20.86% and Marin County down 5.74% on a year-over-year basis.
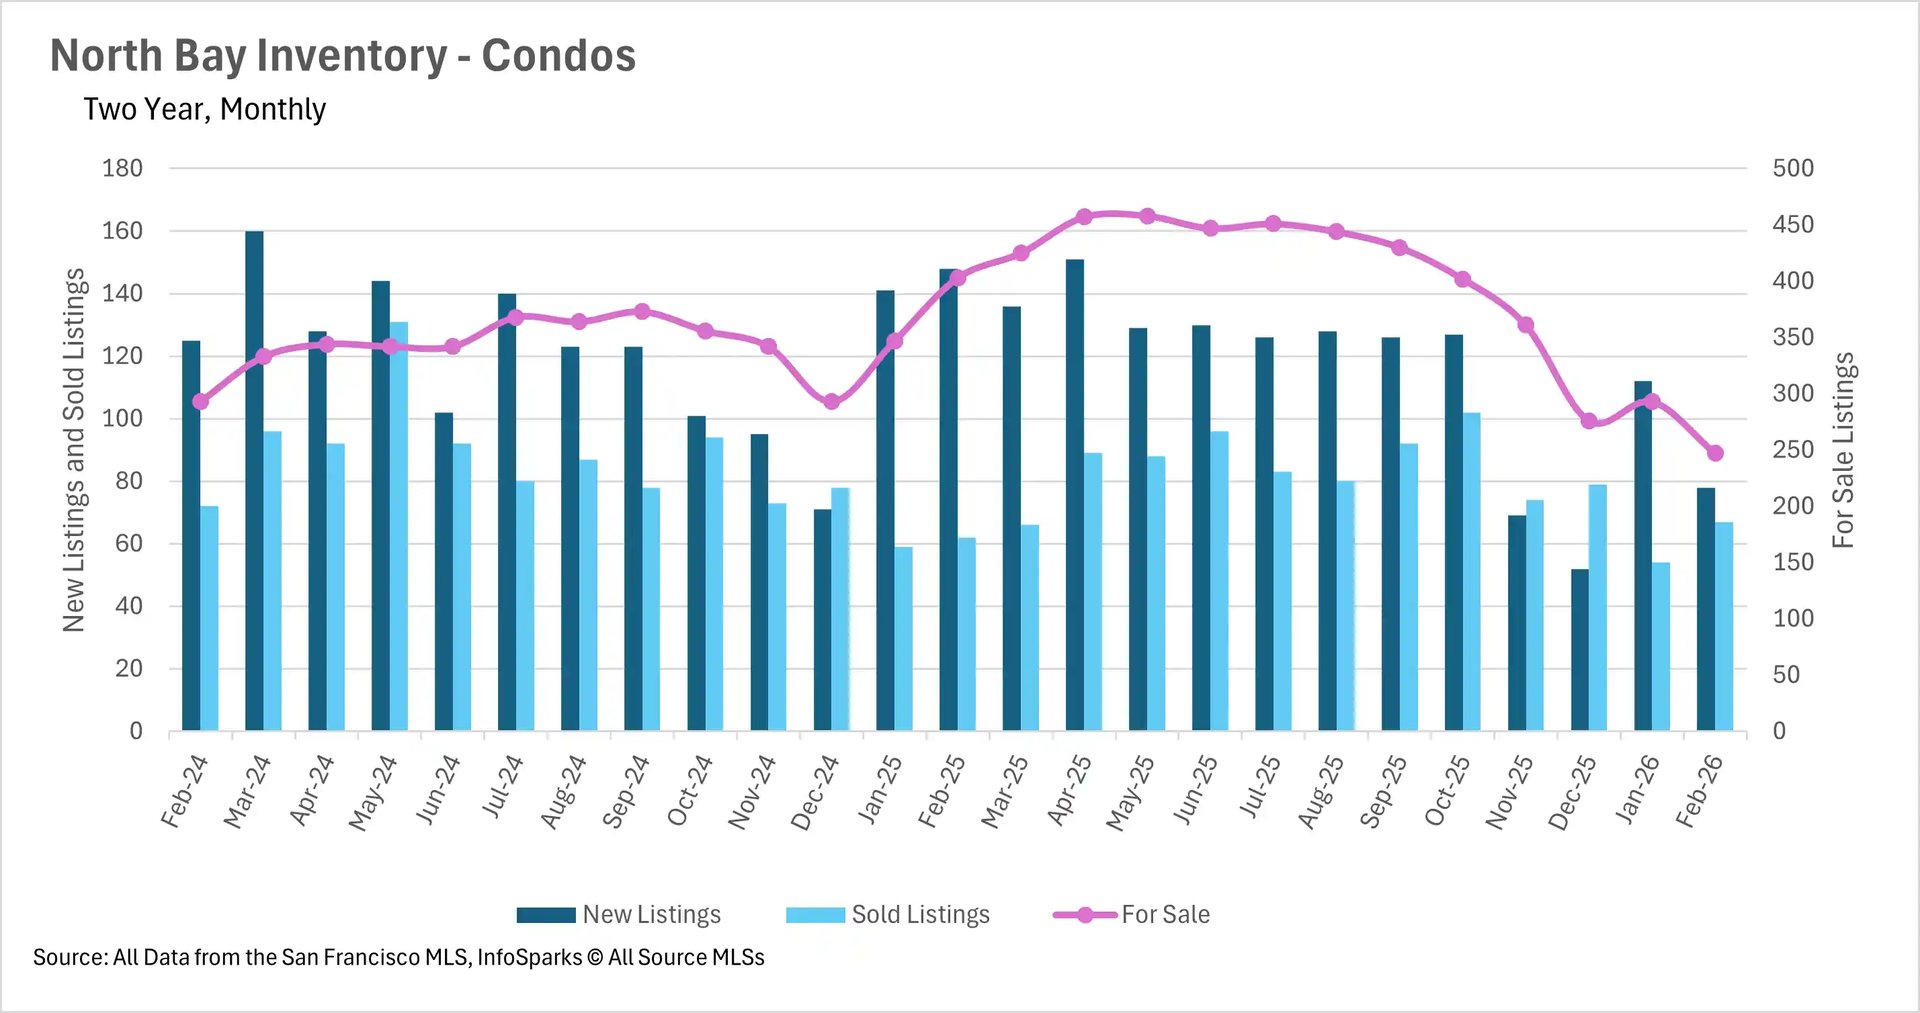
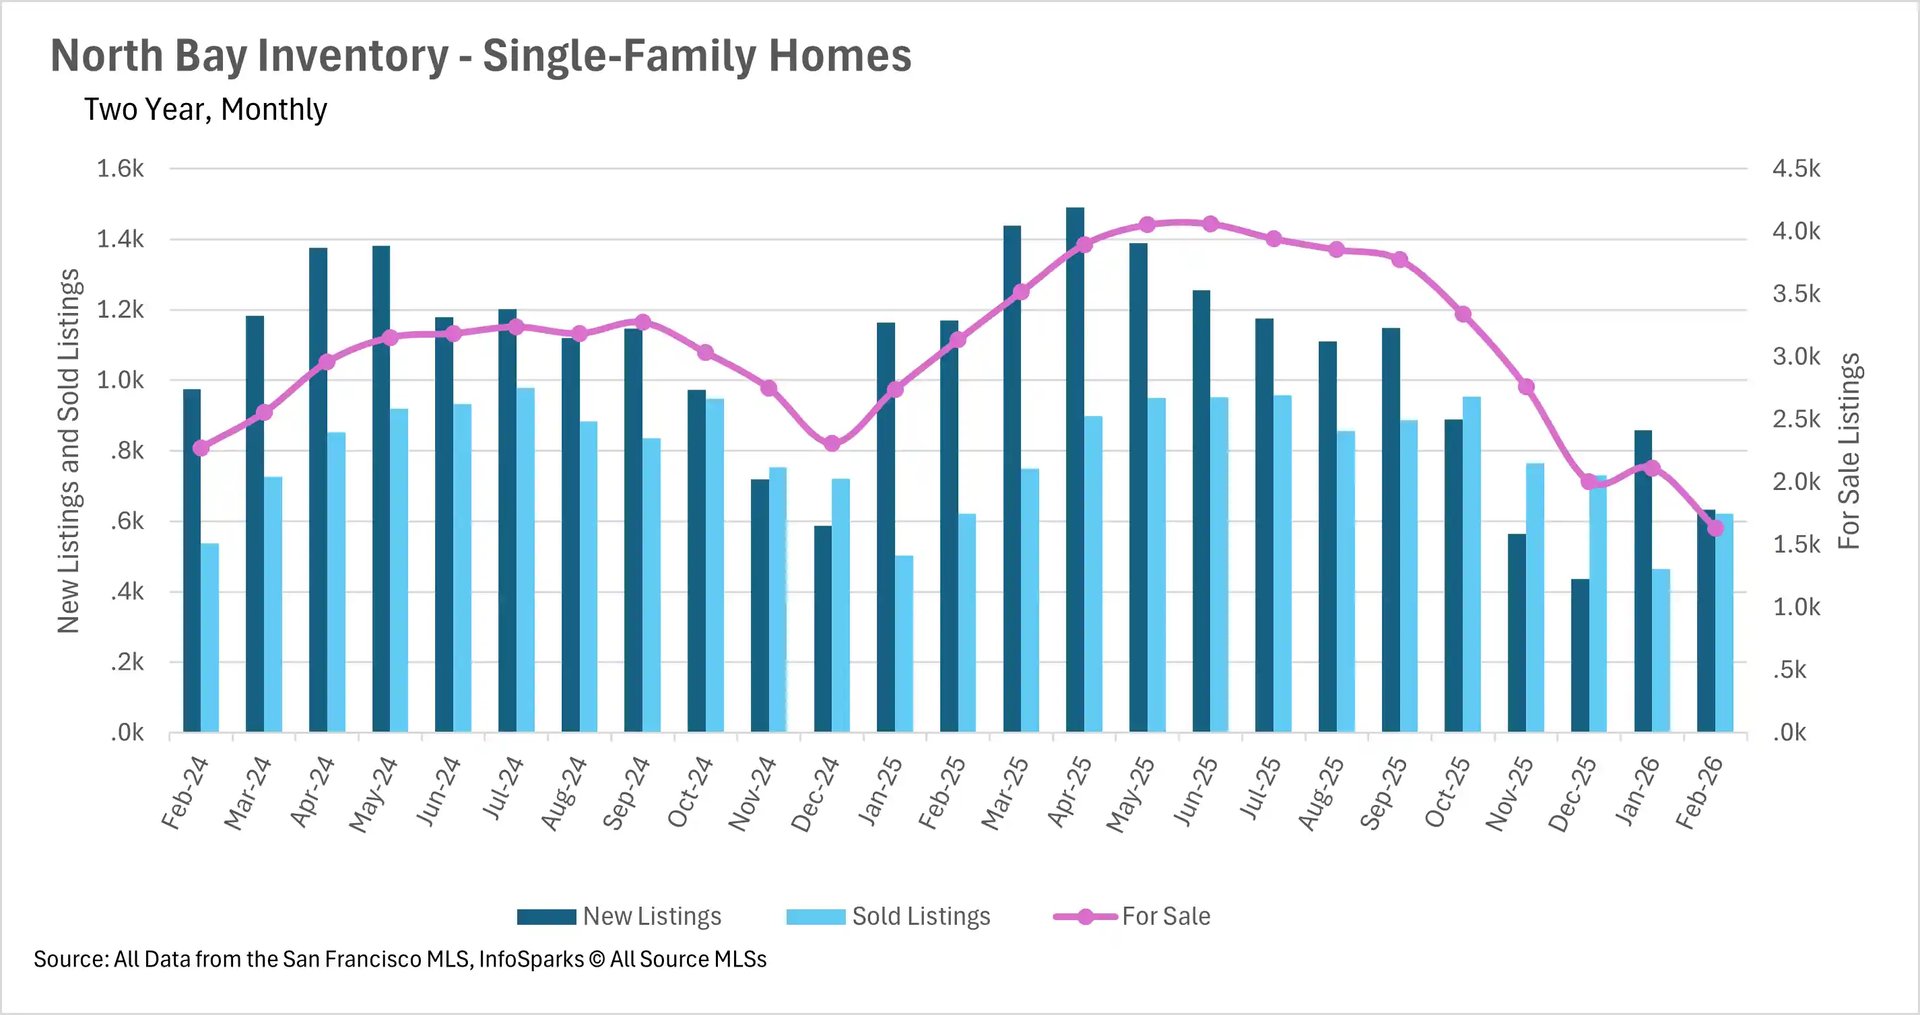
- Inventory levels remain critically low, with single-family home inventory down 47.88% and condo inventory down 38.71% compared to last year.
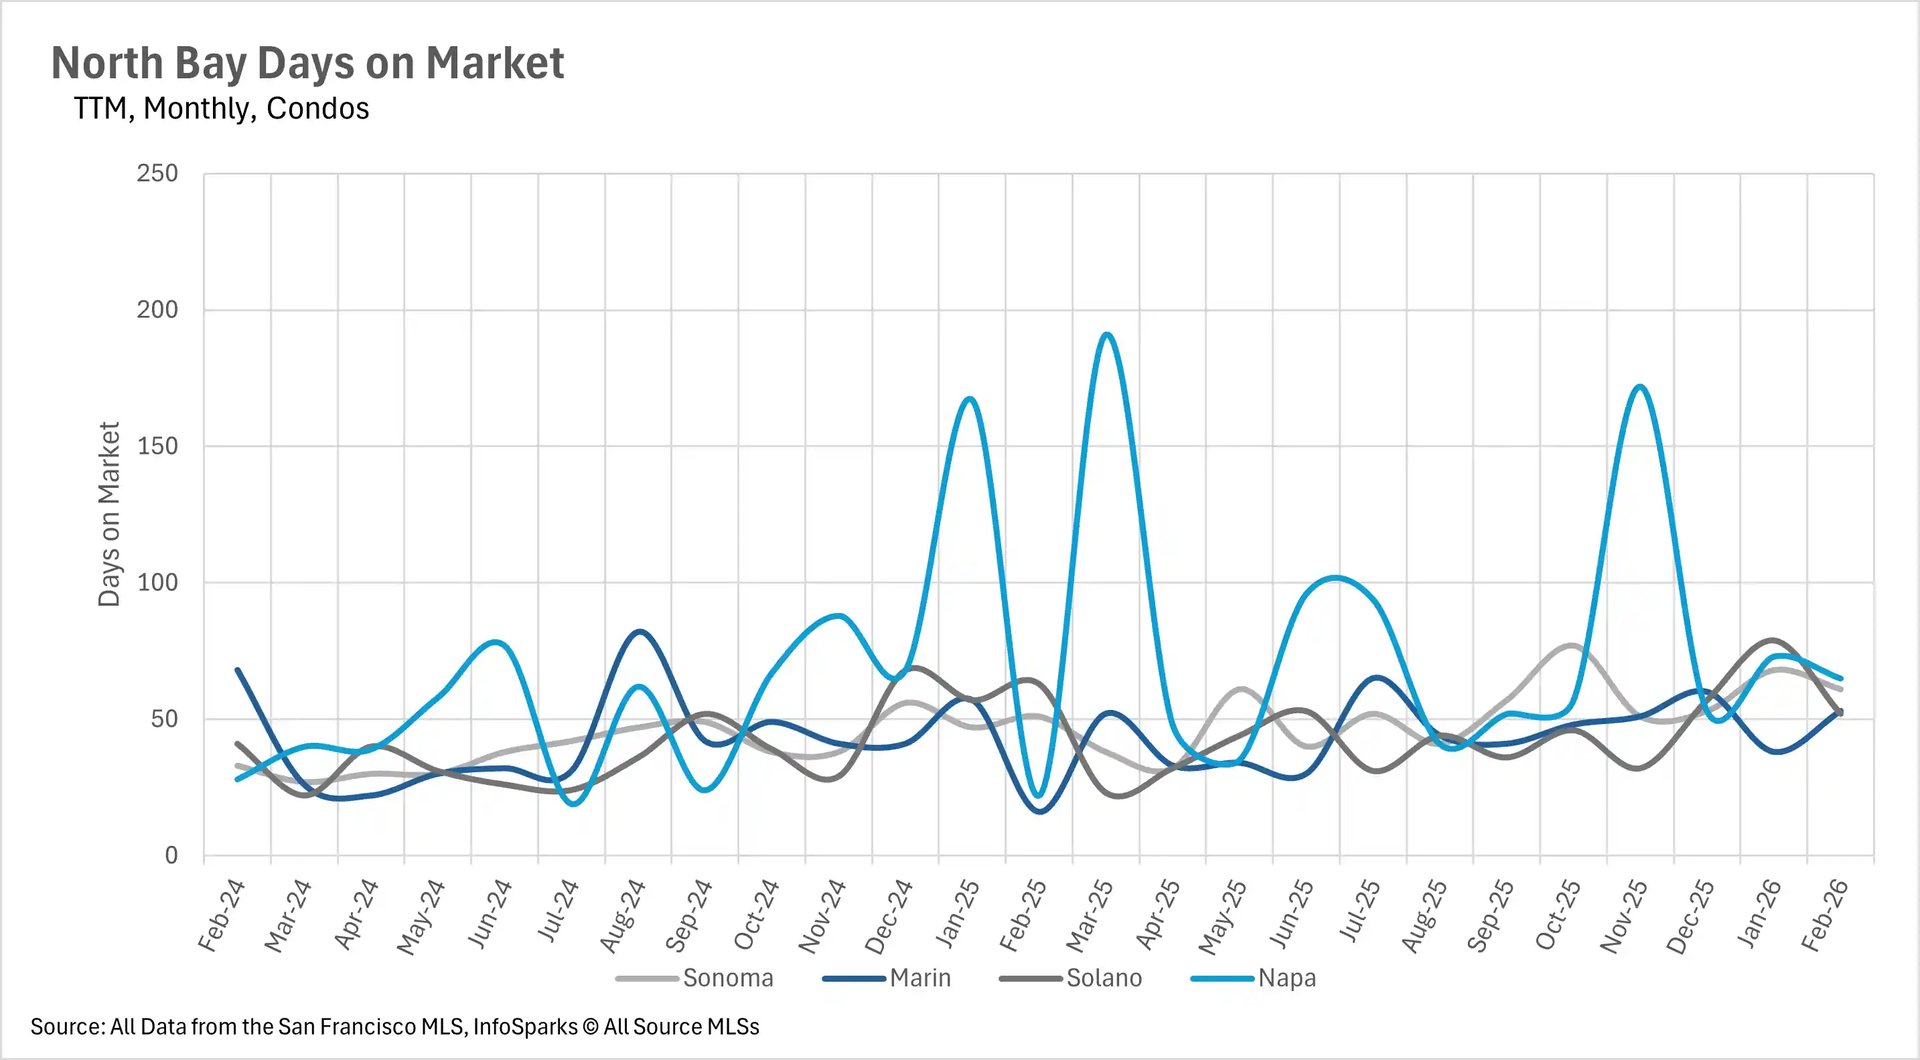
- Listings are moving more quickly in most counties, with days on market declining sharply in Marin, Sonoma, and Solano Counties on a month-over-month basis.
Note: You can find the charts/graphs for the Local Lowdown at the end of this section.
A slow start to the spring selling season
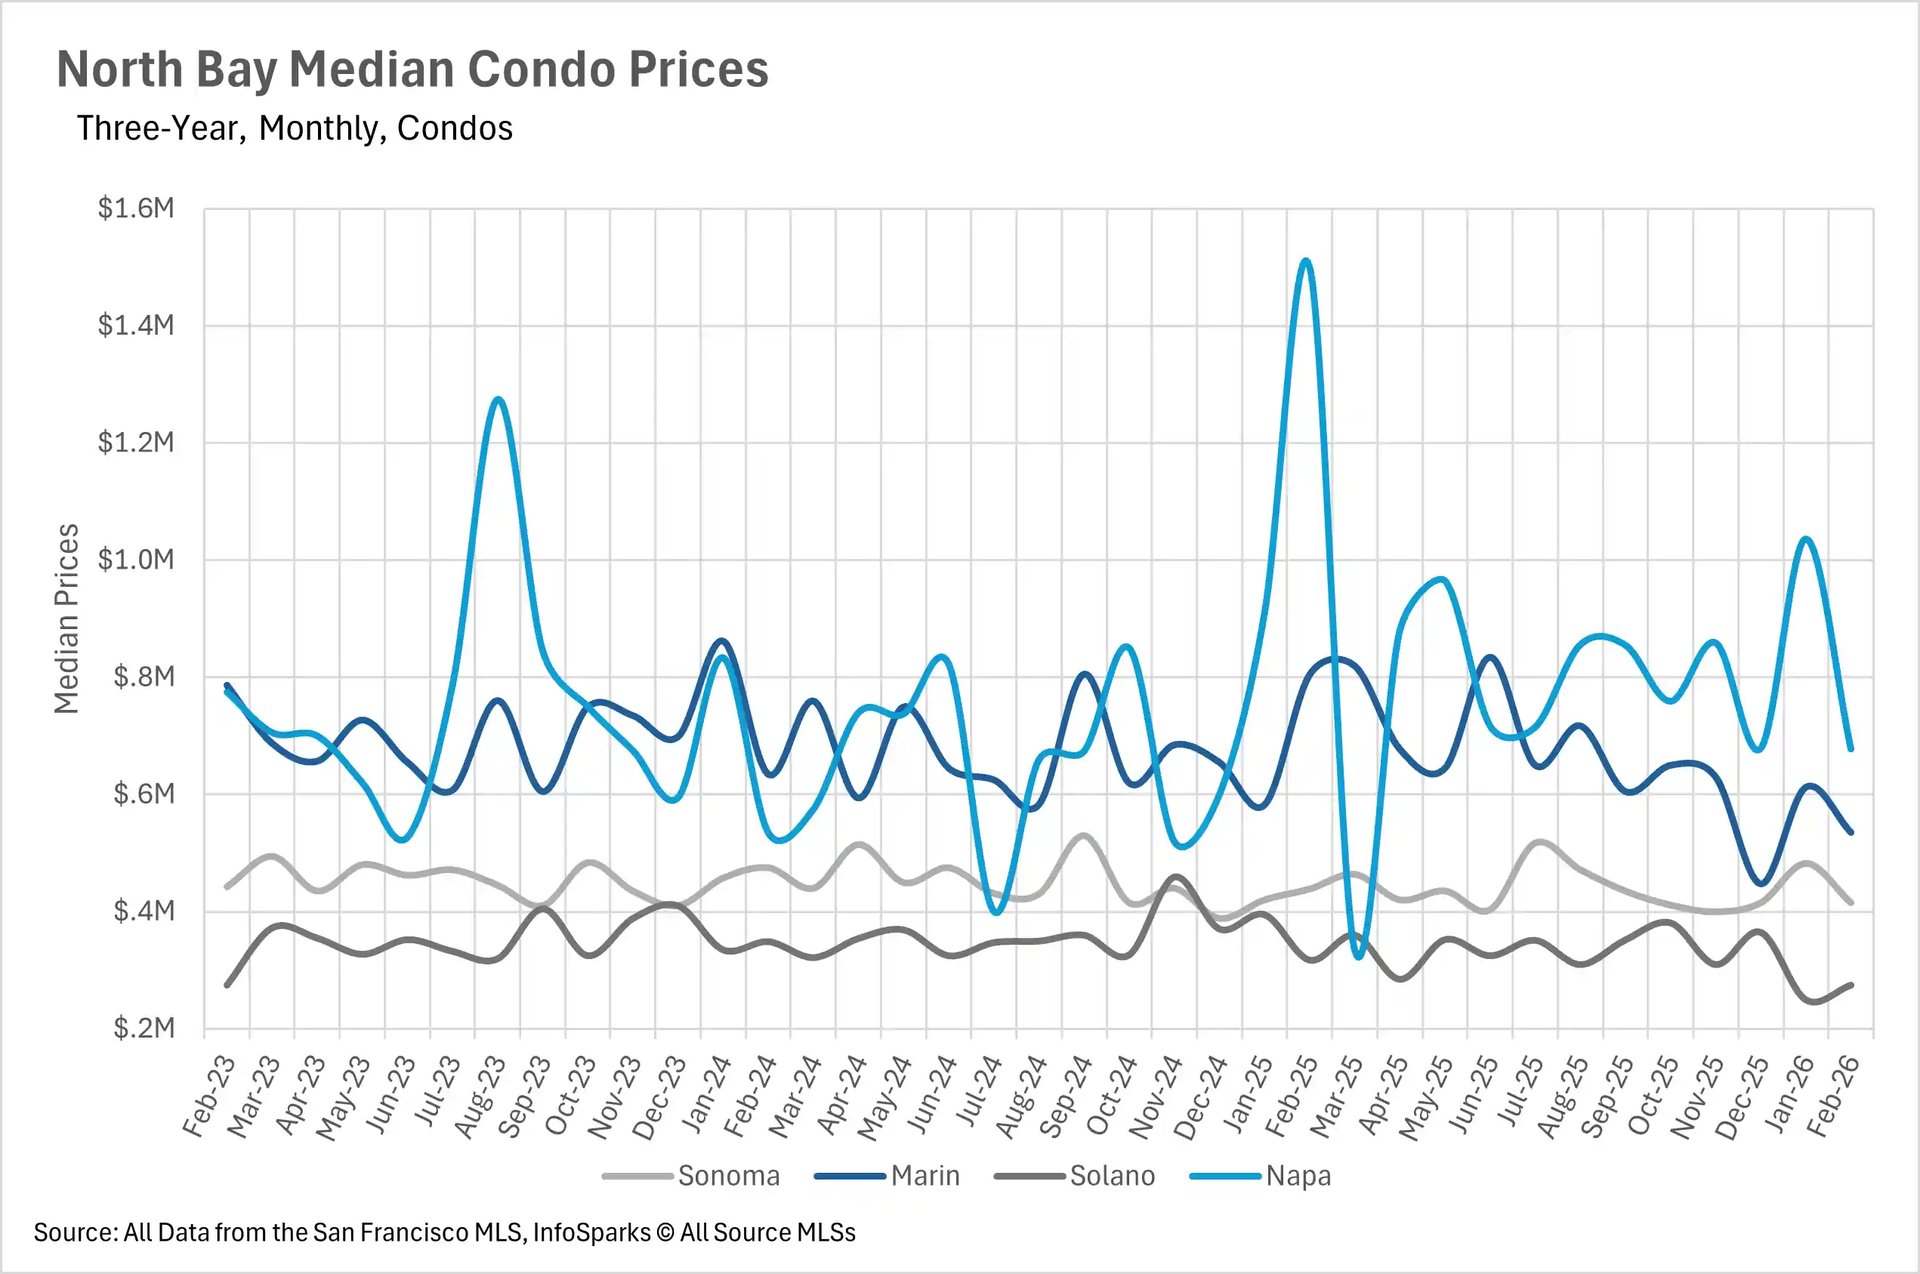
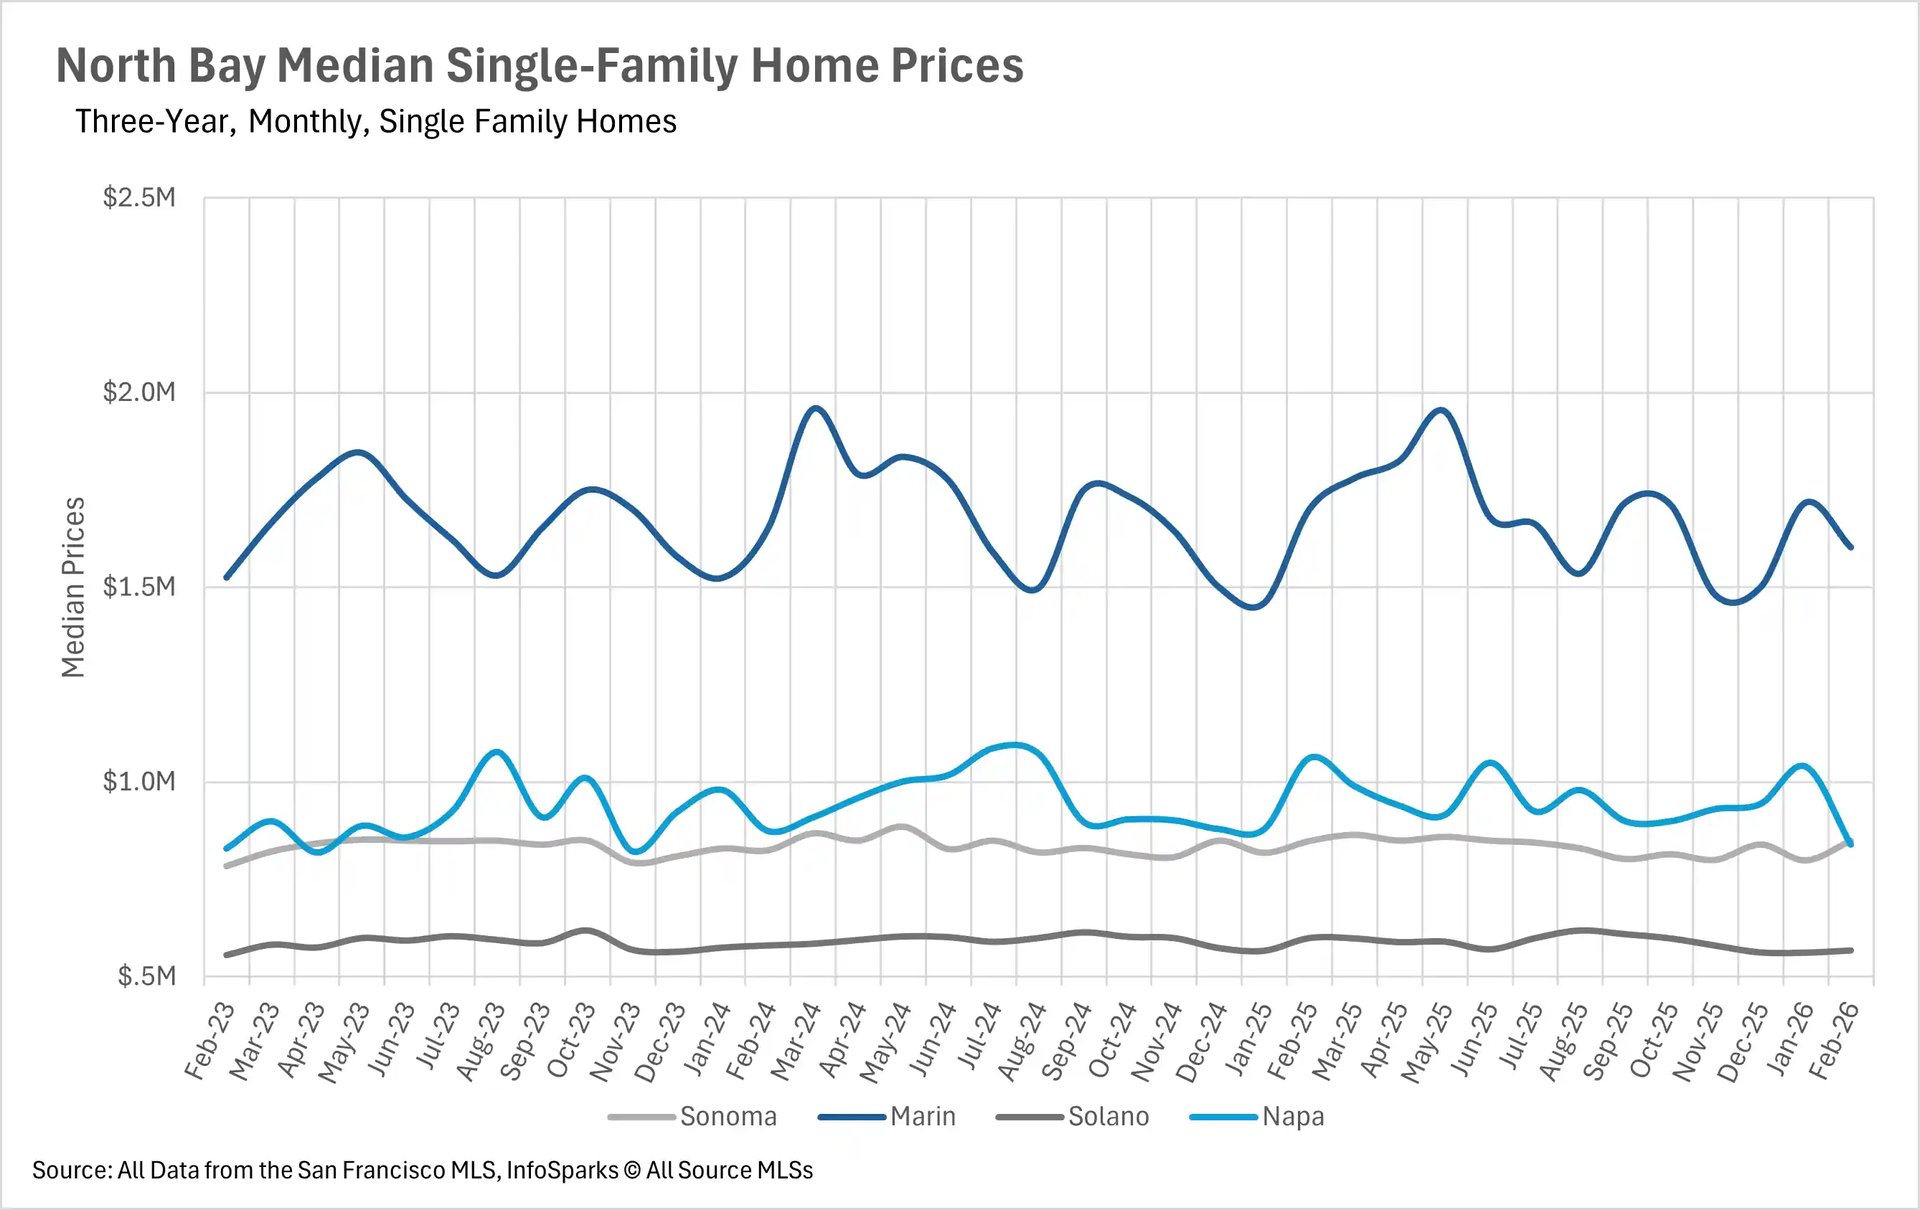
February brought some disappointing price action across much of the North Bay's single-family home market. Napa County saw the biggest decline, with the median single-family home selling for $840,500, a 20.86% drop compared to February 2025. Marin County also experienced a pullback, with median sale prices declining 5.74% year-over-year to $1,602,500. Solano County saw a 5.43% decline, while Sonoma County was essentially flat at 0.06%. The condo market painted an even more challenging picture. Napa County condos dropped 54.85% year-over-year, Marin County condos fell 33.54%, Solano County declined 13.39%, and Sonoma County dipped 5.36%. While these numbers may look concerning, it's important to remember that condo sales volumes are relatively low, which can lead to significant swings in median sale prices from month to month.
Inventory remains at historic lows
The inventory squeeze that has defined the North Bay market over the past several months shows no signs of letting up. Single-family home inventory now sits at just 1,634 units across the region, down a staggering 47.88% compared to February 2025. The condo market is experiencing a similar crunch, with inventory down 38.71% year-over-year to just 247 units. New listings are also well below last year's pace, down 45.90% for single-family homes and 47.30% for condos. The silver lining is that sales activity is holding steady, with single-family home sales flat year-over-year and condo sales actually up 8.06%. This combination of limited supply and steady demand continues to create a challenging environment for buyers looking to enter the market.
Homes are flying off the shelves
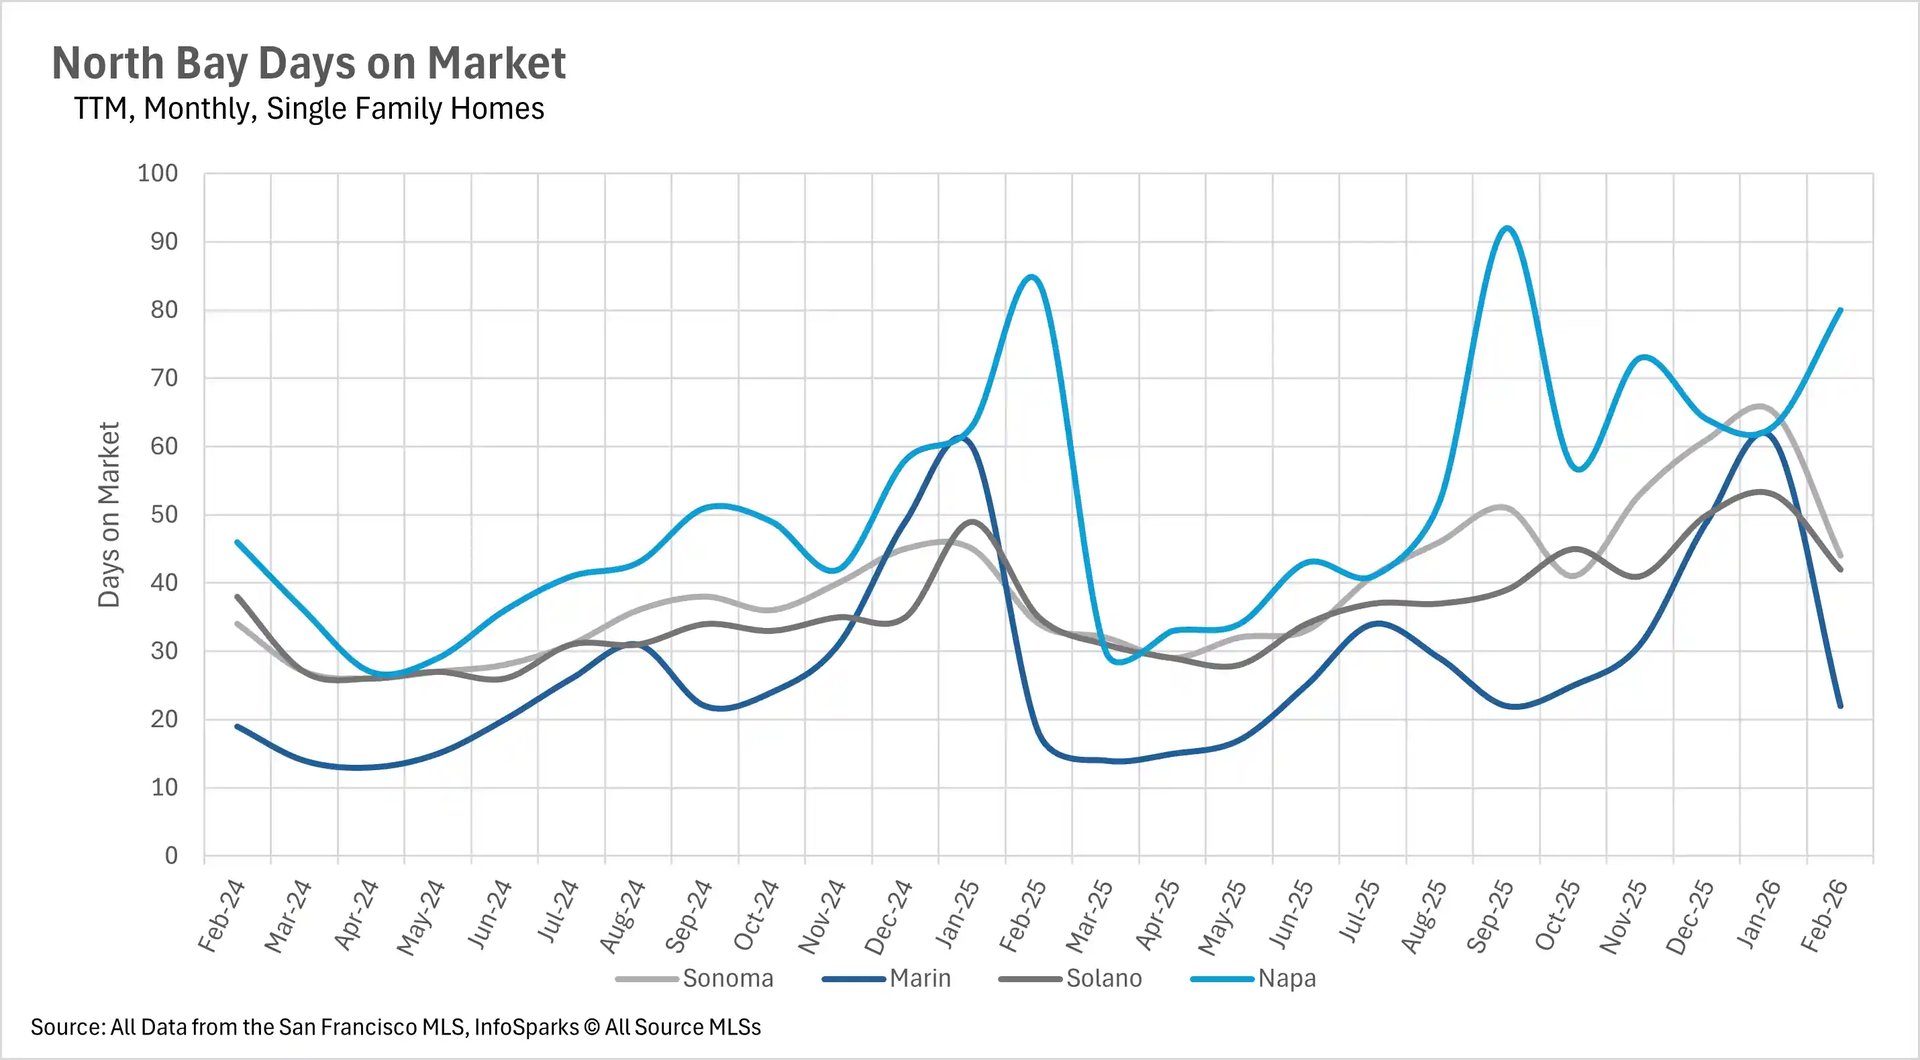
Despite the price corrections we're seeing, listings are actually moving faster than they were last month in most counties. Single-family homes in Marin County saw the most dramatic improvement, with the median listing selling in just 22 days, down 63.93% from January. Sonoma County single-family homes sold in 44 days, down 32.31% month-over-month, while Solano County came in at 42 days, a 20.75% improvement. Napa County bucked the trend, with days on market increasing 26.98% to 80 days. On a year-over-year basis, we're seeing mixed results. Sonoma, Marin, and Solano County single-family homes are spending 29.41%, 22.22%, and 20.00% more time on the market, respectively, while Napa County is actually 4.76% faster. The condo market was volatile as usual, with Marin County condos spending 231.25% more time on the market year-over-year, while Solano County condos moved 17.46% faster.
The spring market is shaping up to be a seller's market
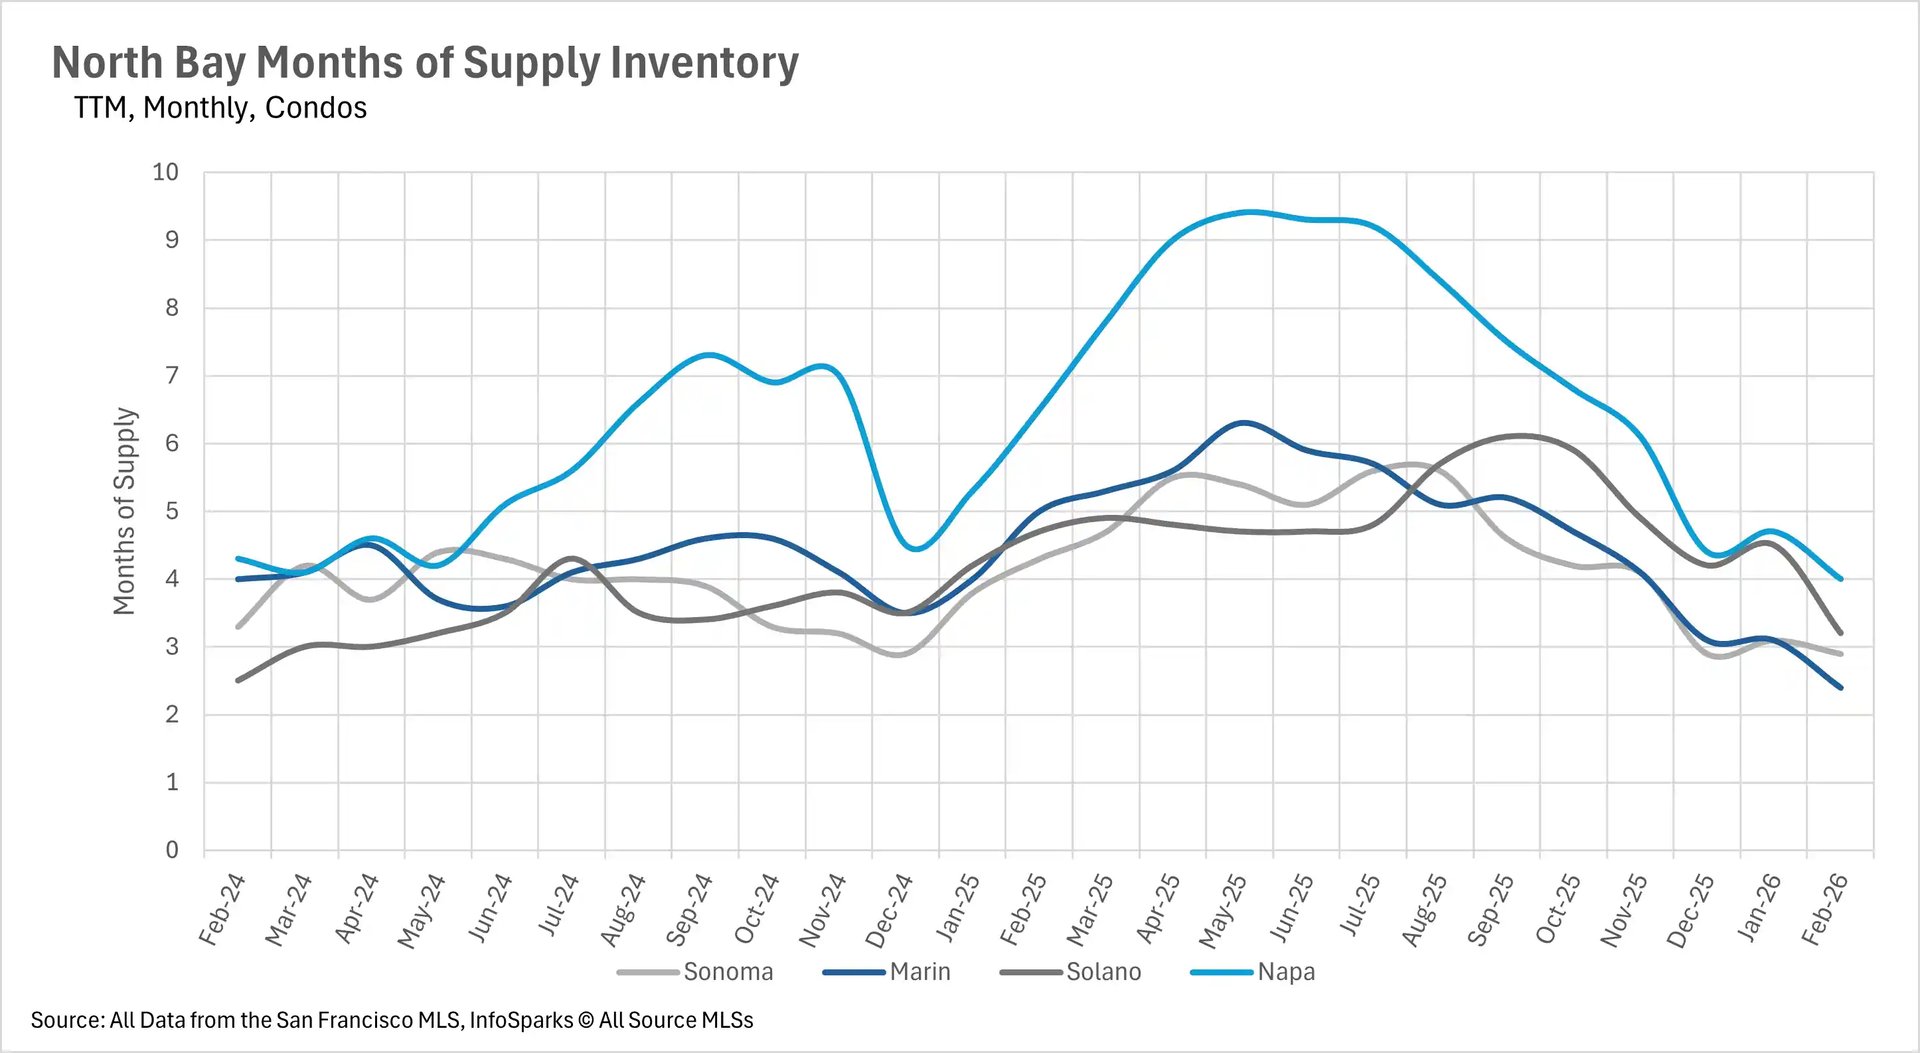
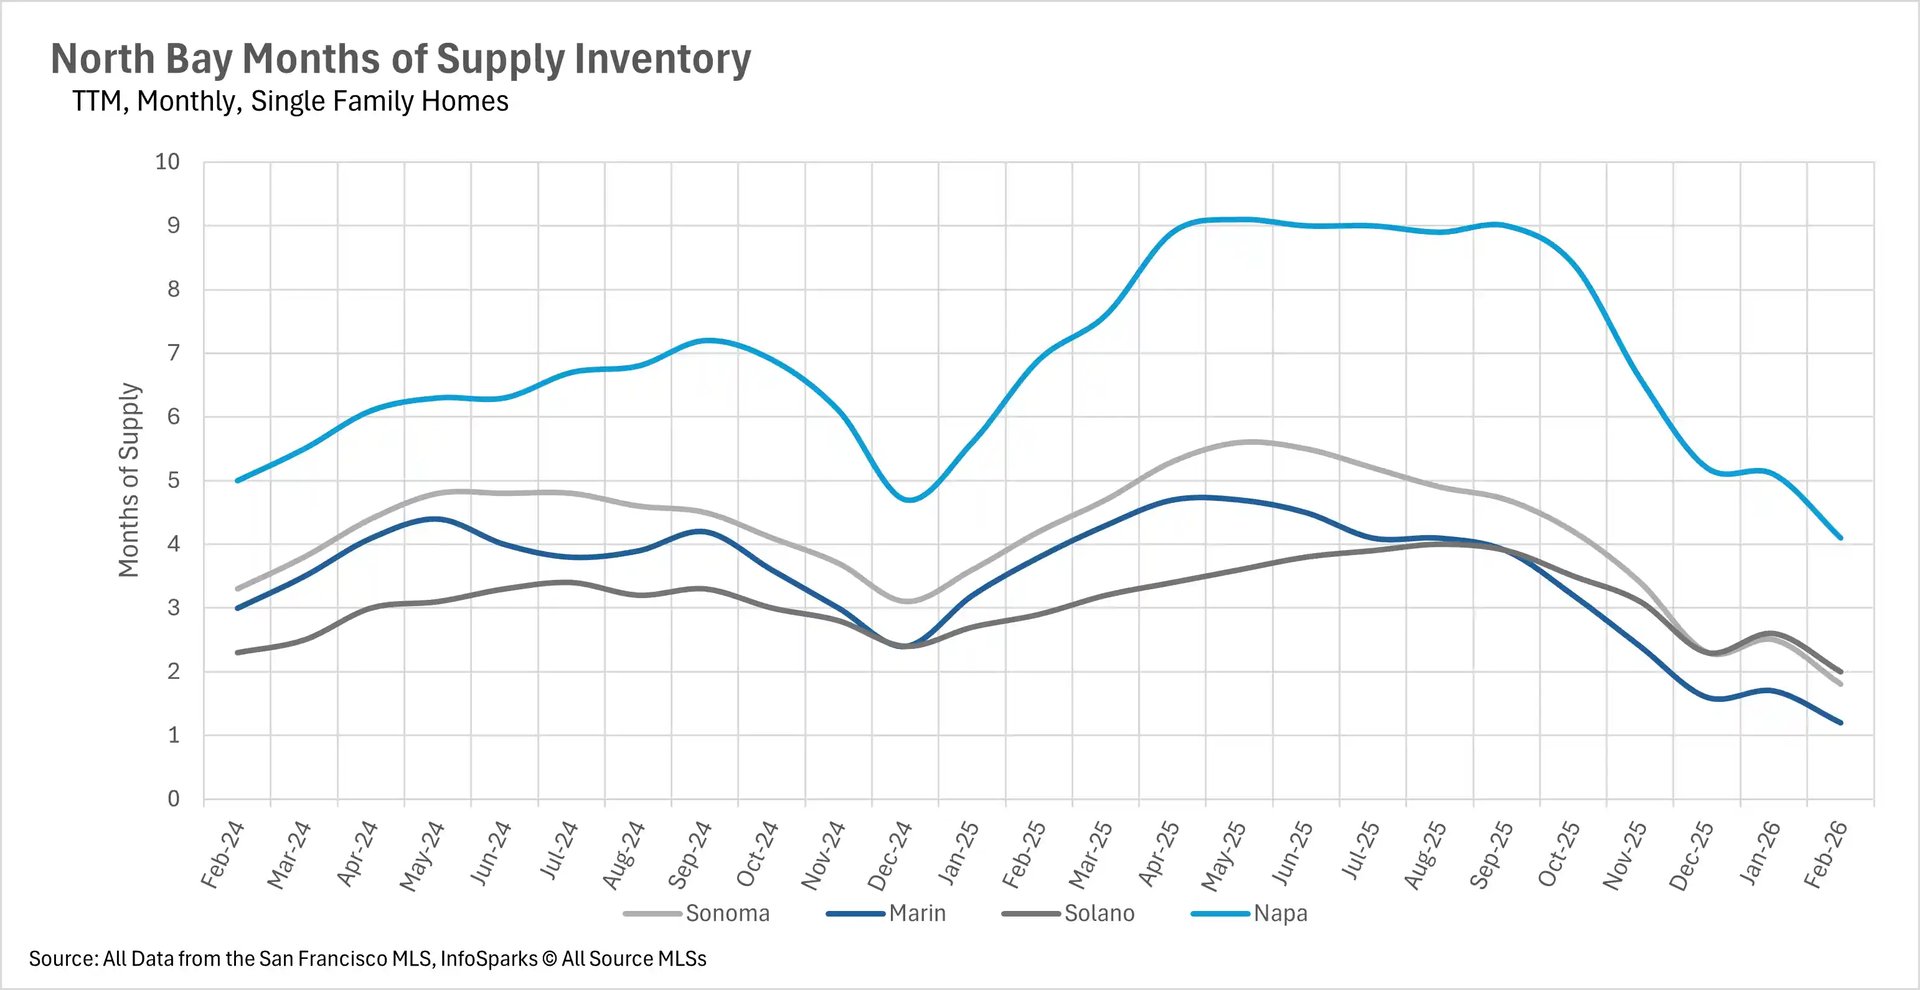
When determining whether a market is a buyers' market or a sellers' market, we look to the Months of Supply Inventory (MSI) metric. The state of California has historically averaged around three months of MSI, so any area with at or around three months of MSI is considered a balanced market. Any market that has lower than three months of MSI is considered a seller's market, whereas markets with more than three months of MSI are considered buyers' markets.
February brought a continued tightening of inventory across the North Bay, pushing most markets further into seller's territory. The single-family home market is now firmly a seller's market in three of the four counties. Marin County has just 1.2 months of supply, down an incredible 68.42% year-over-year. Sonoma County sits at 1.8 months (down 57.14%), and Solano County has 2 months of supply (down 31.03%). Even Napa County, which has historically been more balanced, has tightened to 4.1 months of supply, a 40.58% year-over-year decline. The condo market has also shifted, with Marin County at 2.4 months (down 52% year-over-year), Sonoma County at 2.9 months, Solano County at 3.2 months, and Napa County at 4 months. As we head into the spring selling season, sellers remain in the driver's seat across most of the region.