The Local Lowdown
Quick Take:
Median sale prices posted gains in three of four counties, with Sonoma County leading the way at 2.33% year-over-year growth, while Marin County saw a 4.70% decline.
Inventory levels remain significantly constrained, with single-family home inventory down 36% and condo inventory down 25.32% on a year-over-year basis.
Listings are moving quickly across most of the region, with Marin County single-family homes selling in just 13 days.
Note: You can find the charts/graphs for the Local Lowdown at the end of this section.
Three out of four counties post year-over-year gains
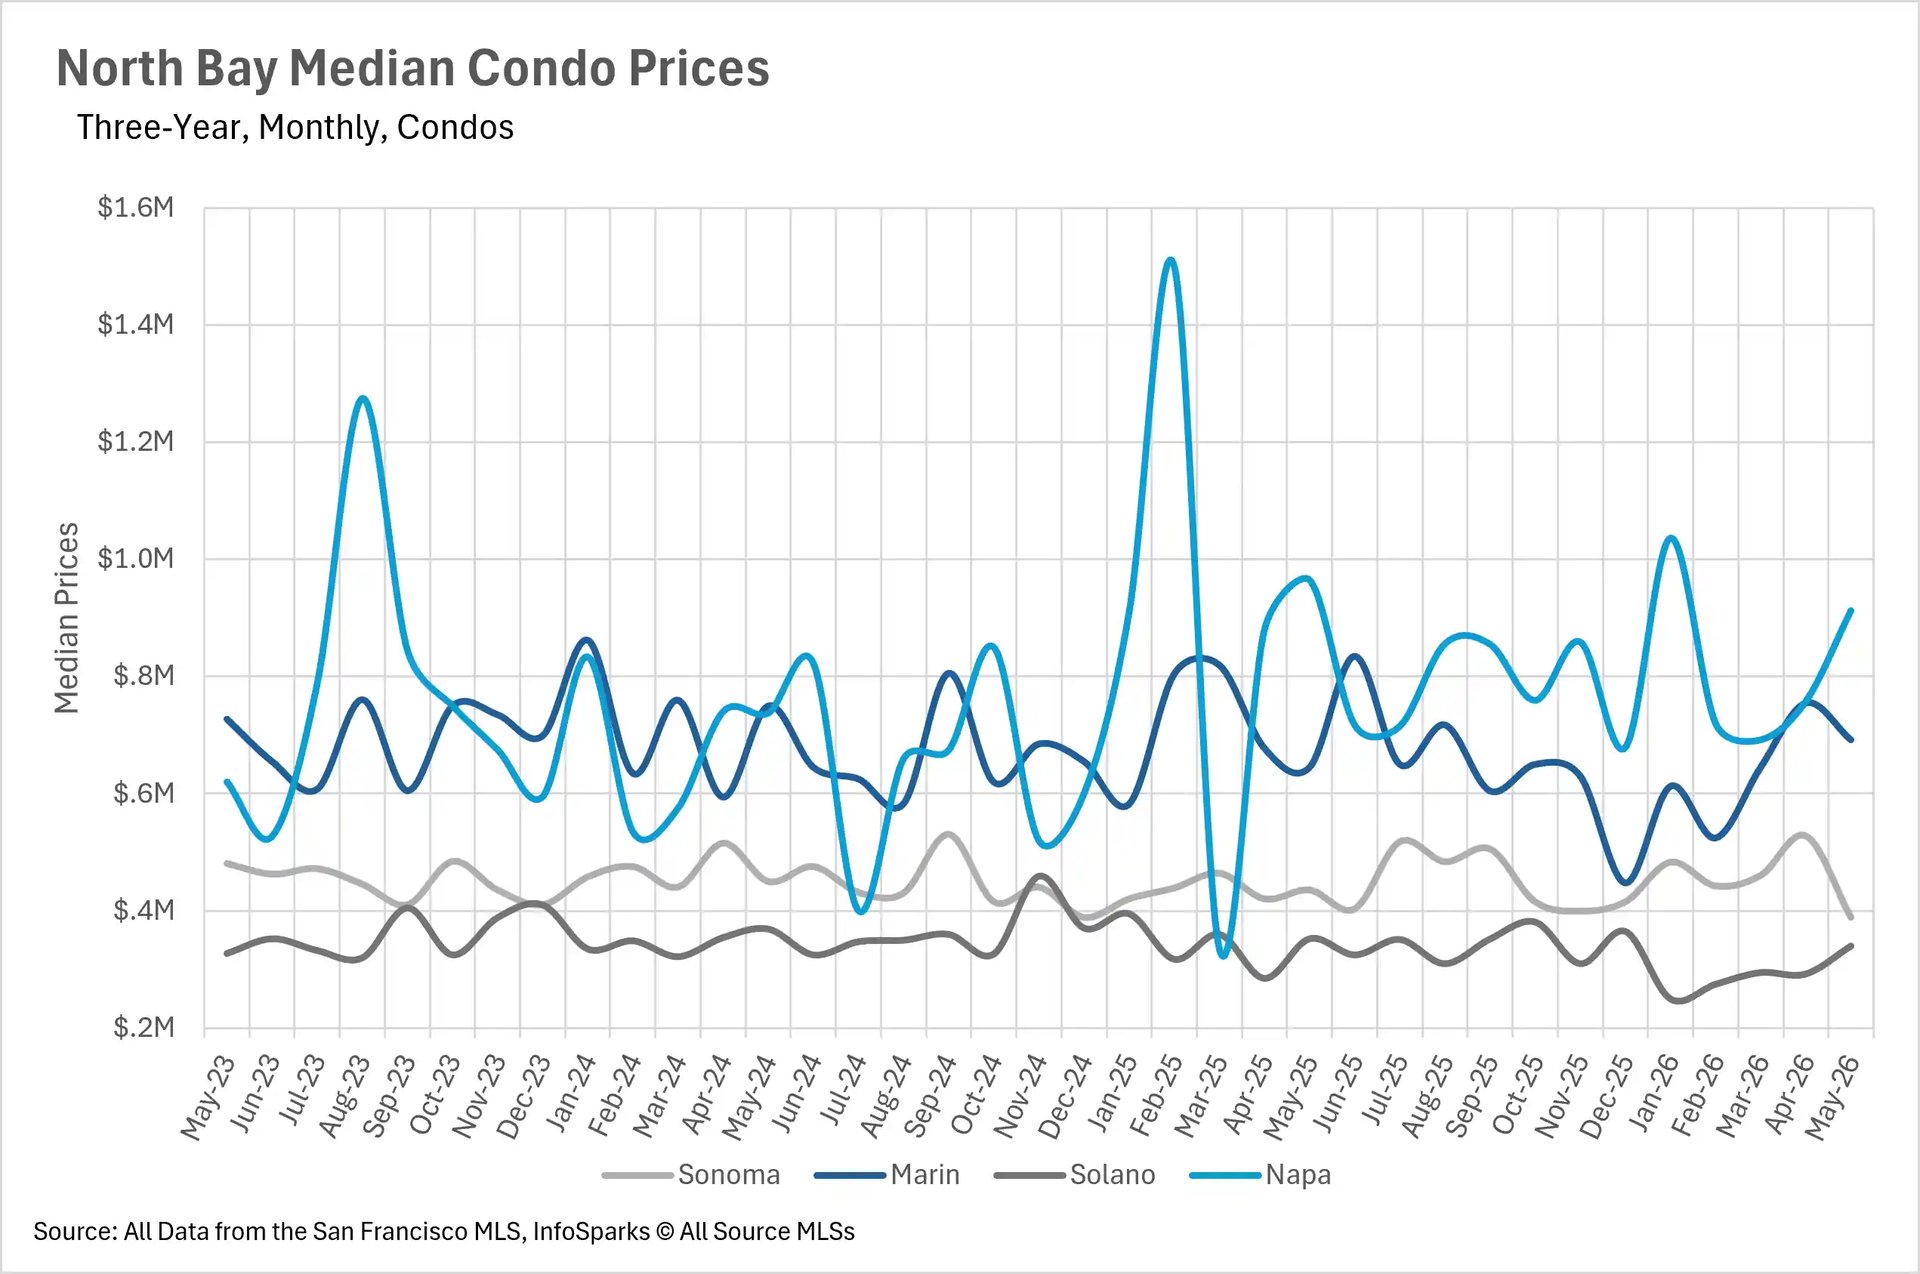
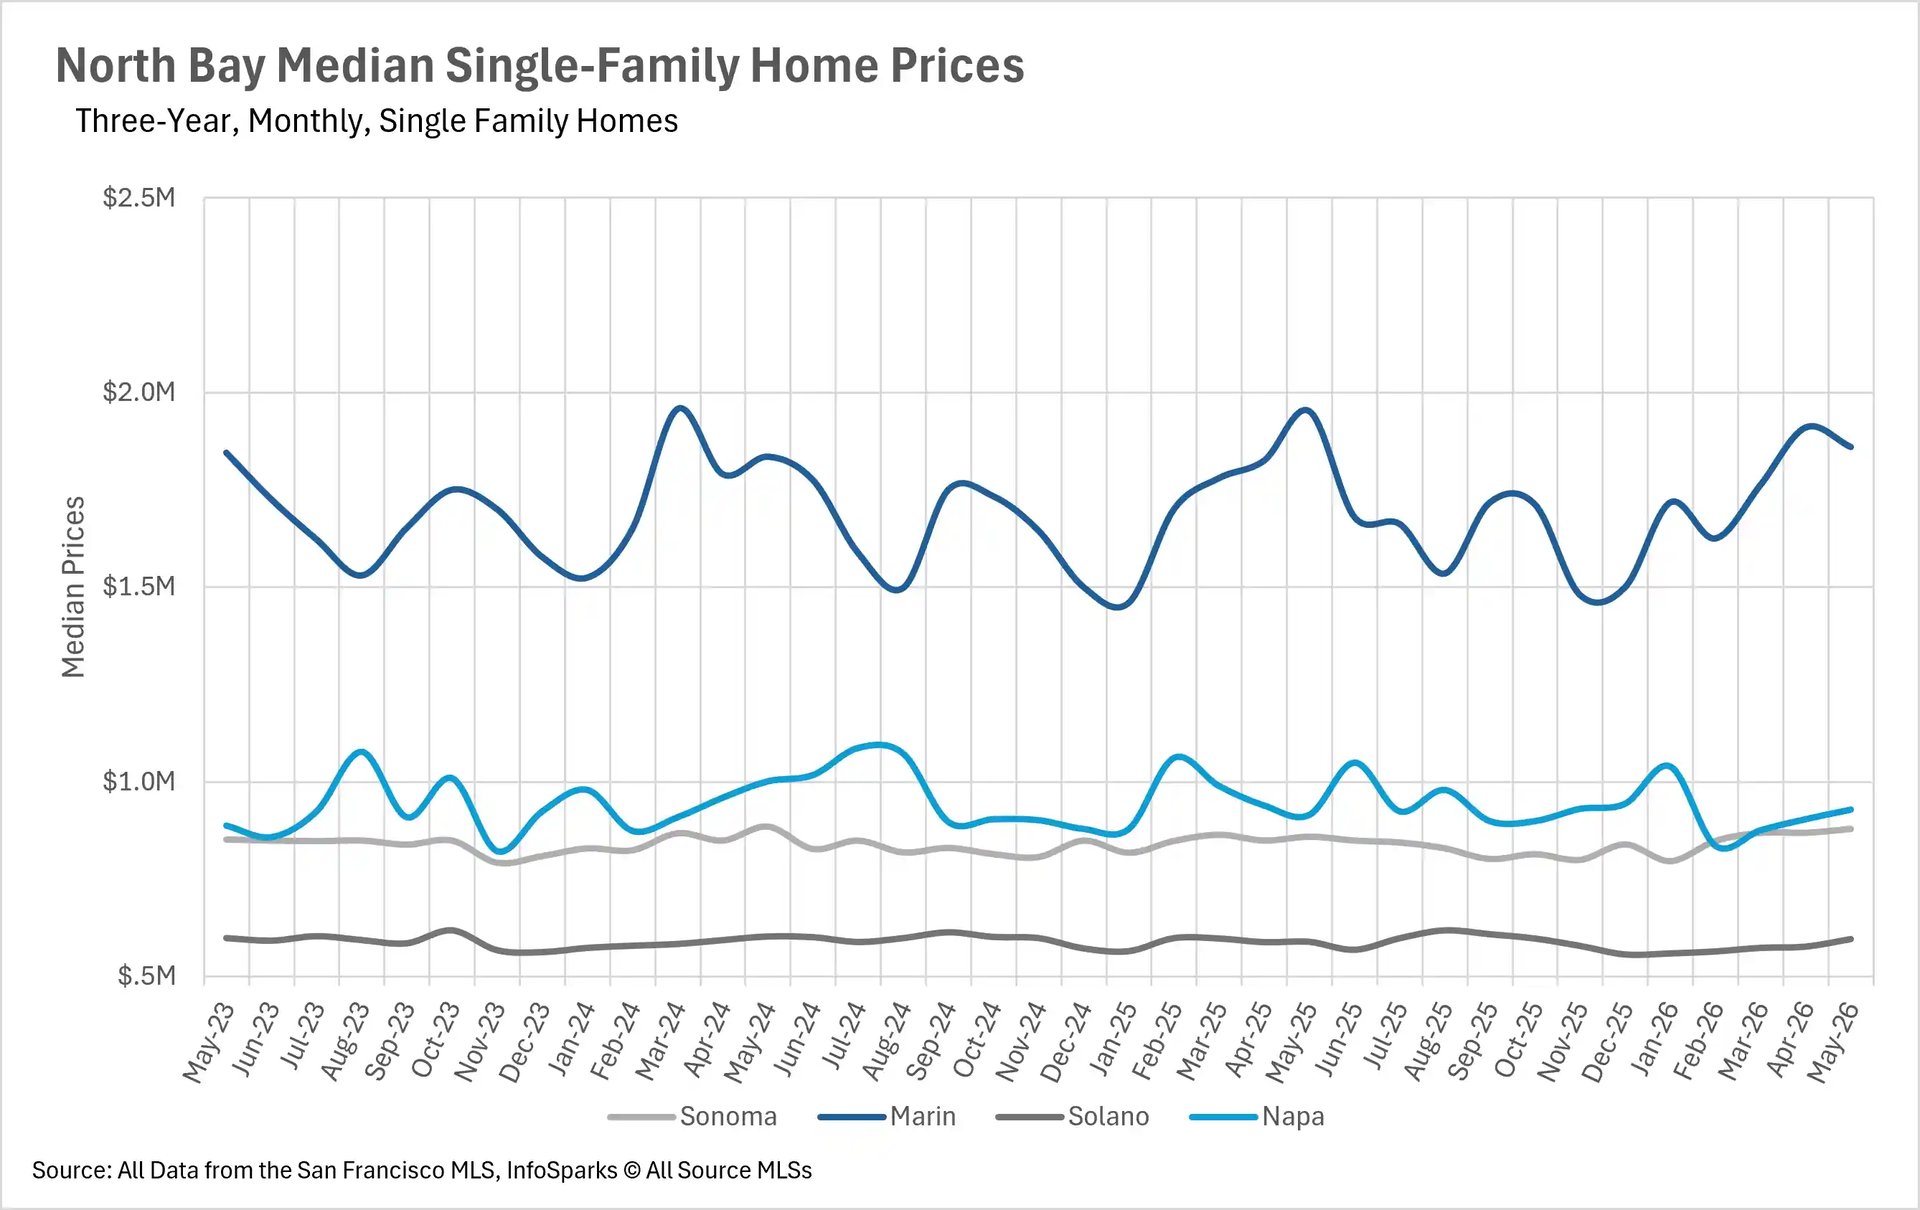
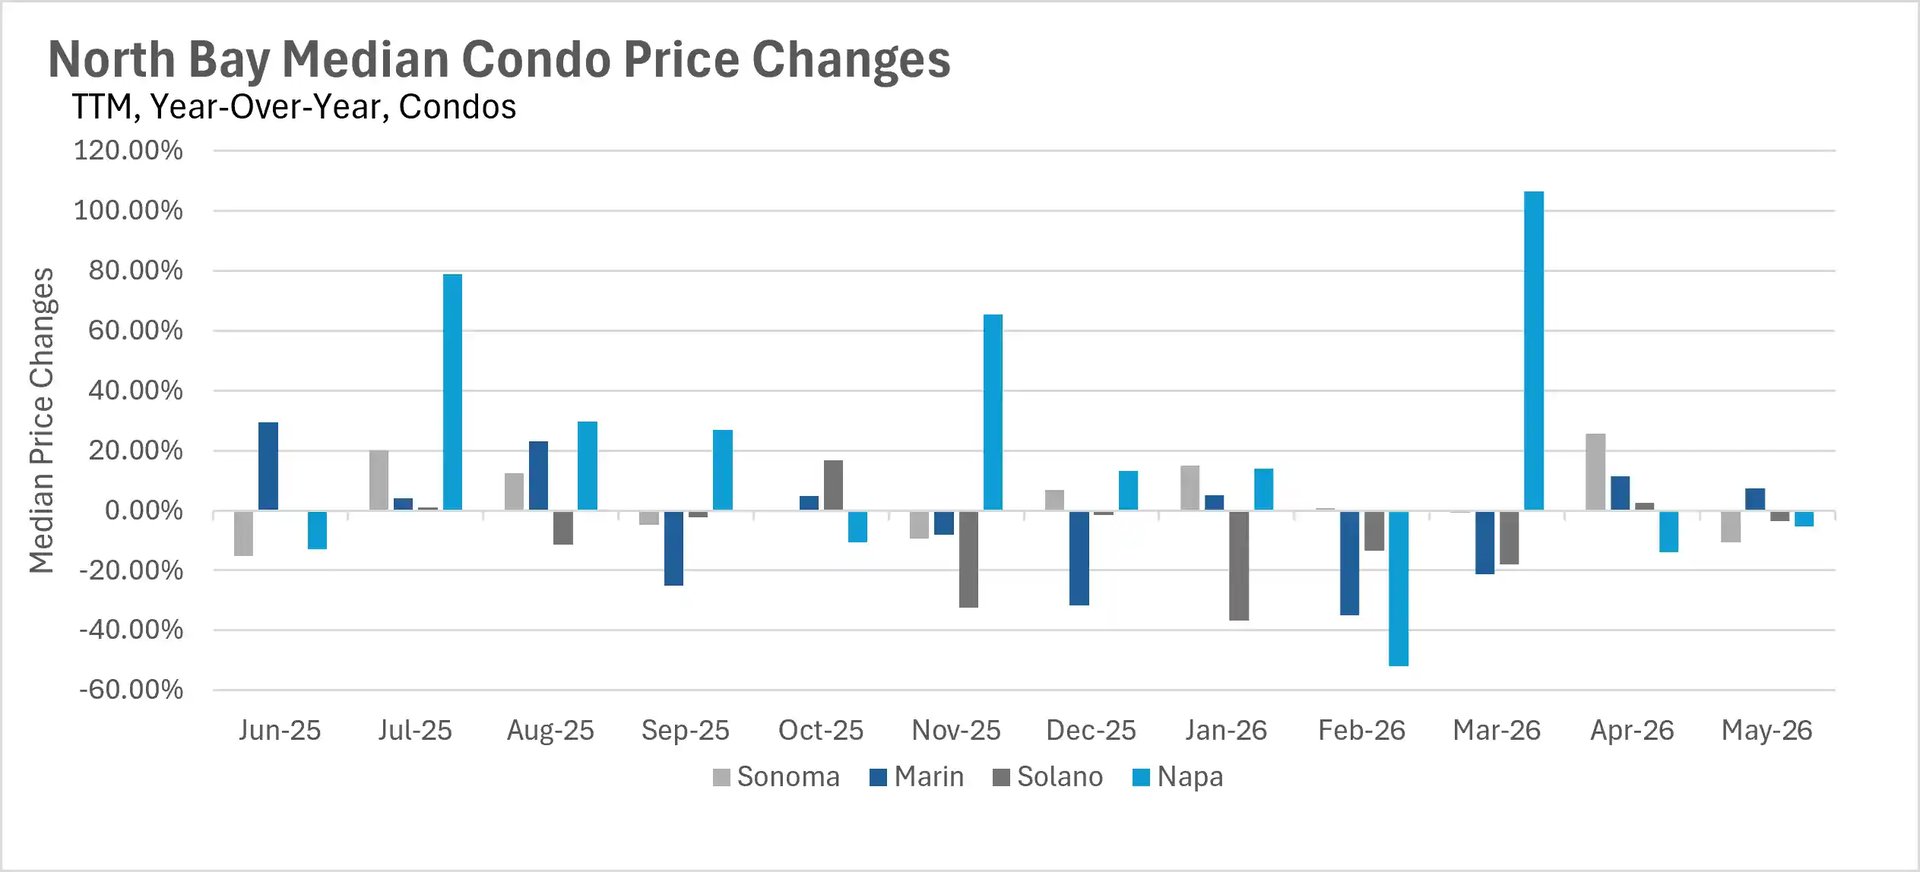
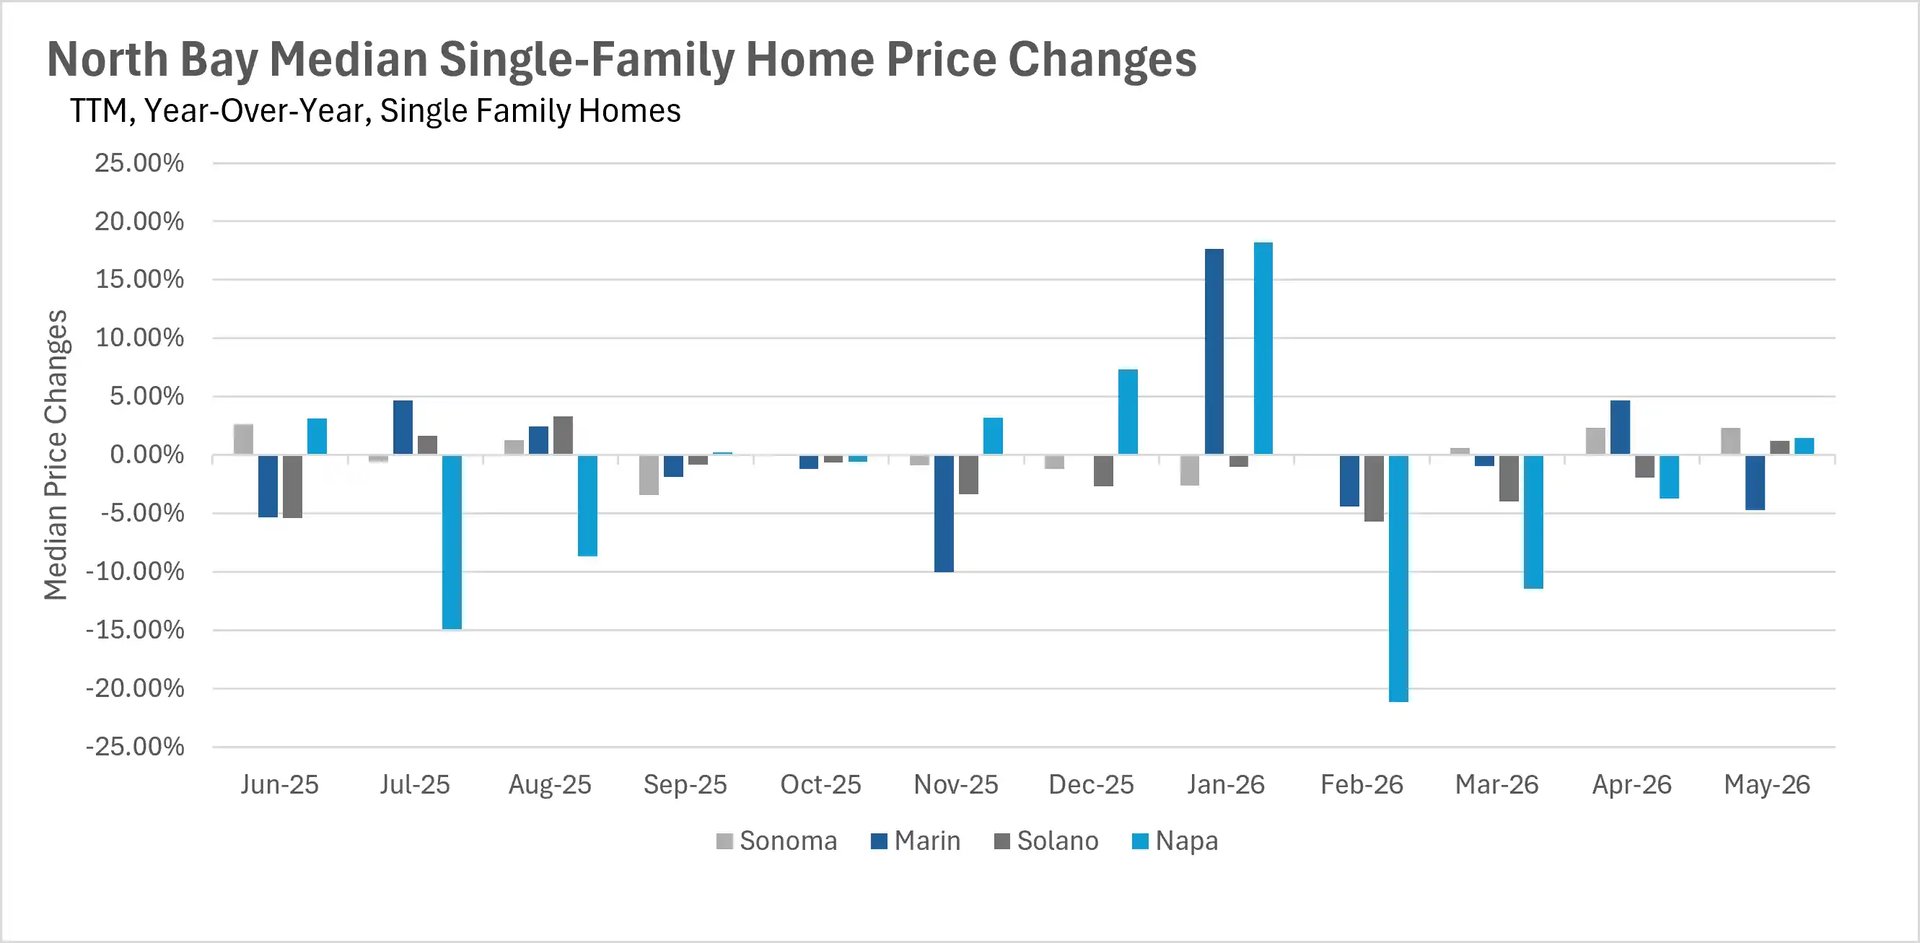
May brought welcome news for homeowners across much of the North Bay, with three of the four counties posting year-over-year price gains in the single-family home market. Sonoma County led the way, with the median single-family home selling for $880,000, a 2.33% increase compared to May 2025. Napa County saw a 1.47% gain to $929,500, and Solano County ticked up 1.19% to $597,475. Marin County was the lone decliner, with the median sale price falling 4.70% year-over-year to $1,860,000. The condo market painted a different picture, with most counties seeing declines. Sonoma County condos dropped 10.73% year-over-year, Napa County fell 5.44%, and Solano County declined 3.55%. Marin County bucked the trend with a 7.29% increase in median condo sale price.
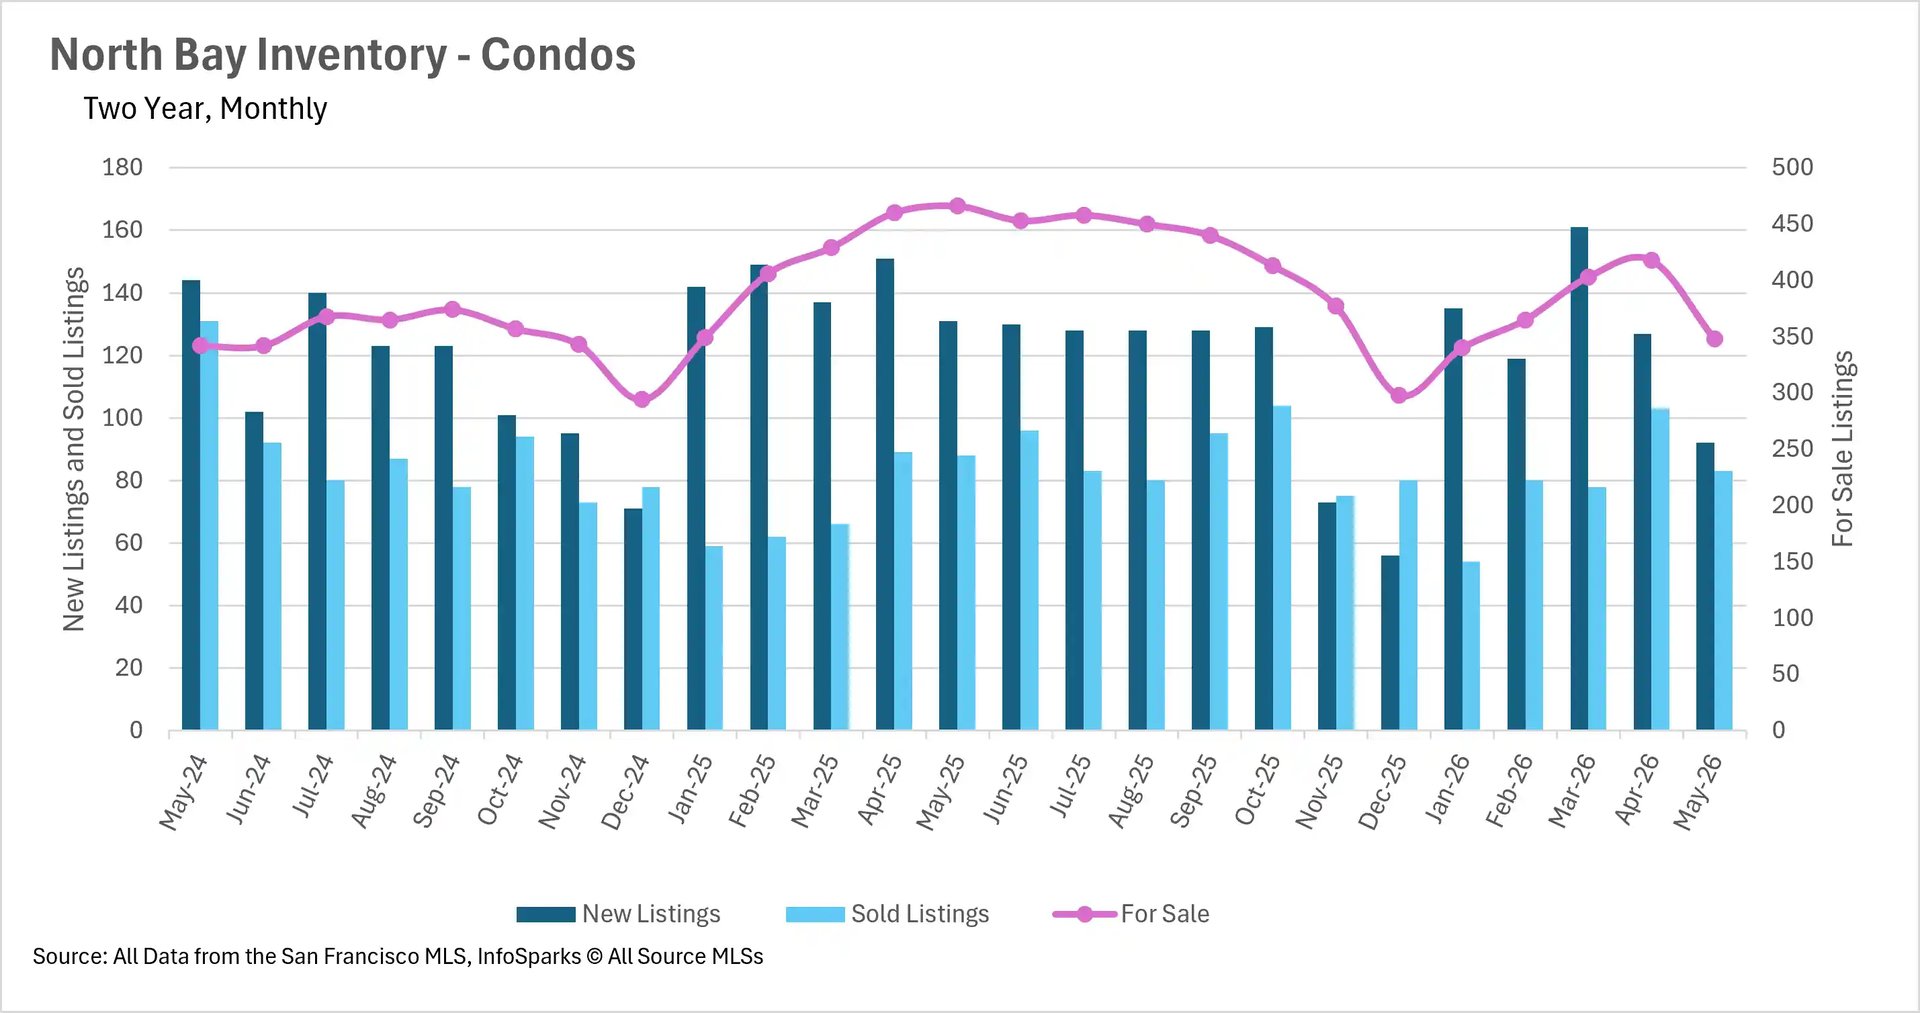
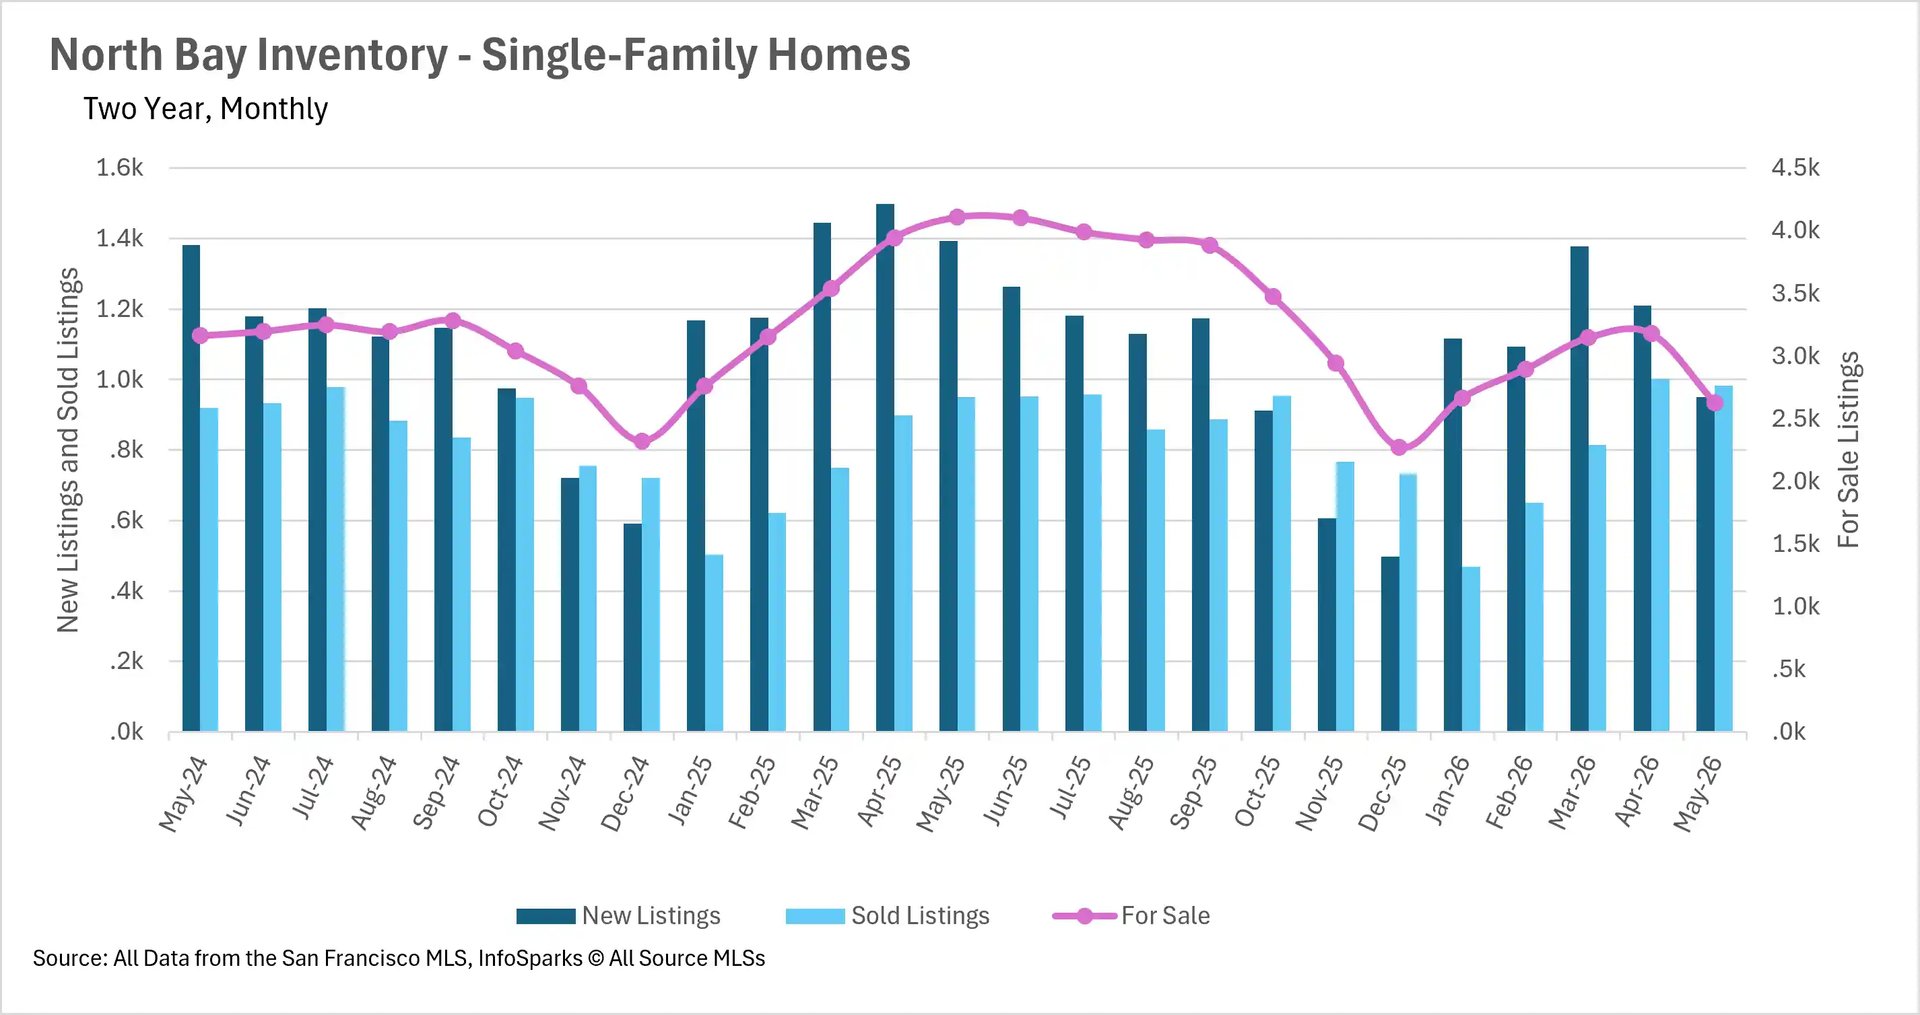
Inventory remains in short supply as summer approaches
The inventory crunch that has defined the North Bay market over the past year shows no signs of easing. Single-family home inventory now sits at just 2,629 units across the region, down 36% compared to May 2025. The condo market is similarly constrained, with just 348 units available, a 25.32% year-over-year decline. New listings continue to trail last year's pace, down 31.73% for single-family homes and 29.77% for condos. On the demand side, single-family home sales are up 3.37% year-over-year, while condo sales are down 5.68%. This imbalance between supply and demand continues to create competitive conditions for buyers, particularly in the single-family home market.
Marin County homes are selling at lightning speed
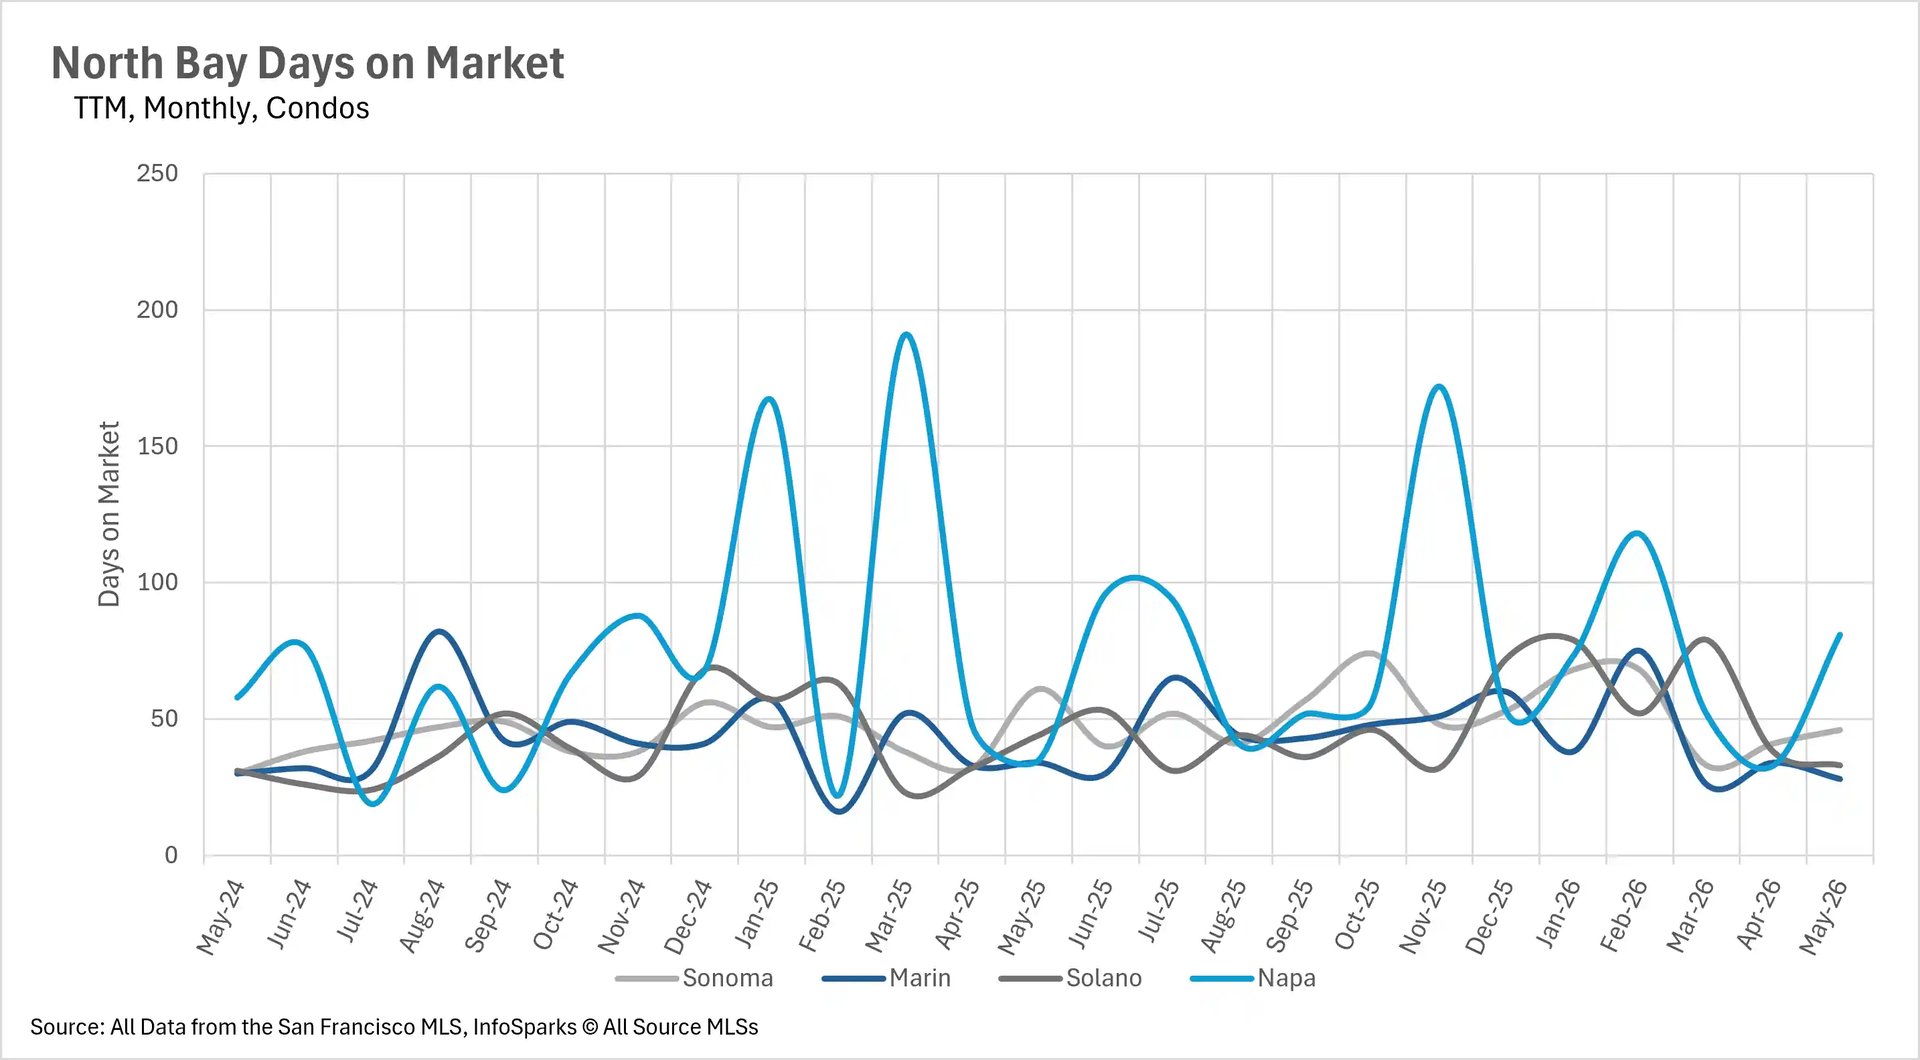
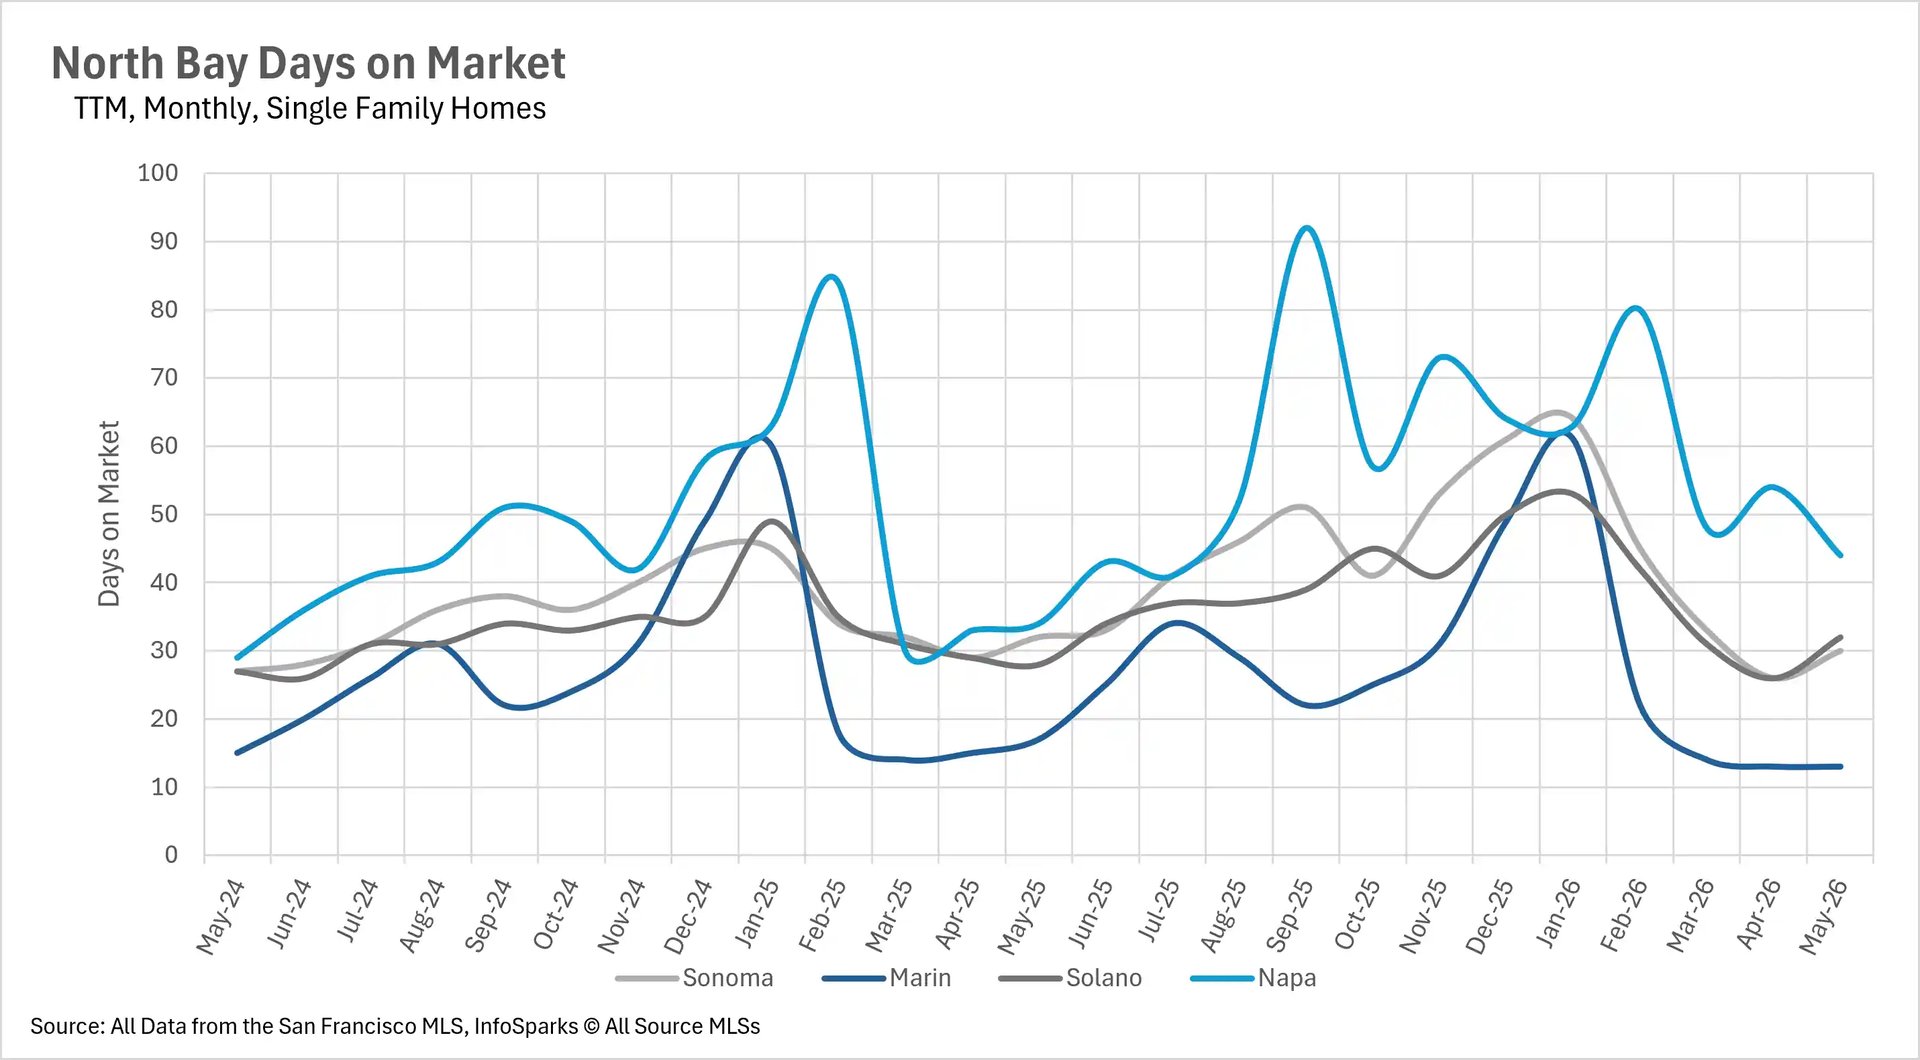
May brought some impressive sales velocity across the North Bay, particularly in the single-family home market. Marin County led the way with a median of just 13 days on market, a 23.53% improvement compared to last May. Sonoma County single-family homes also moved faster, selling in 30 days, a 6.25% year-over-year improvement. Solano County was slightly slower at 32 days (up 14.29% year-over-year), while Napa County continued to lag at 44 days (up 29.41%). The condo market showed broad improvement, with Sonoma County condos moving 24.59% faster, Solano County condos 25% faster, and Marin County condos 17.65% faster than last year. The exception was Napa County, where condos are spending 131.43% more time on the market, with a median of 81 days.
Summer heats up with seller's market conditions
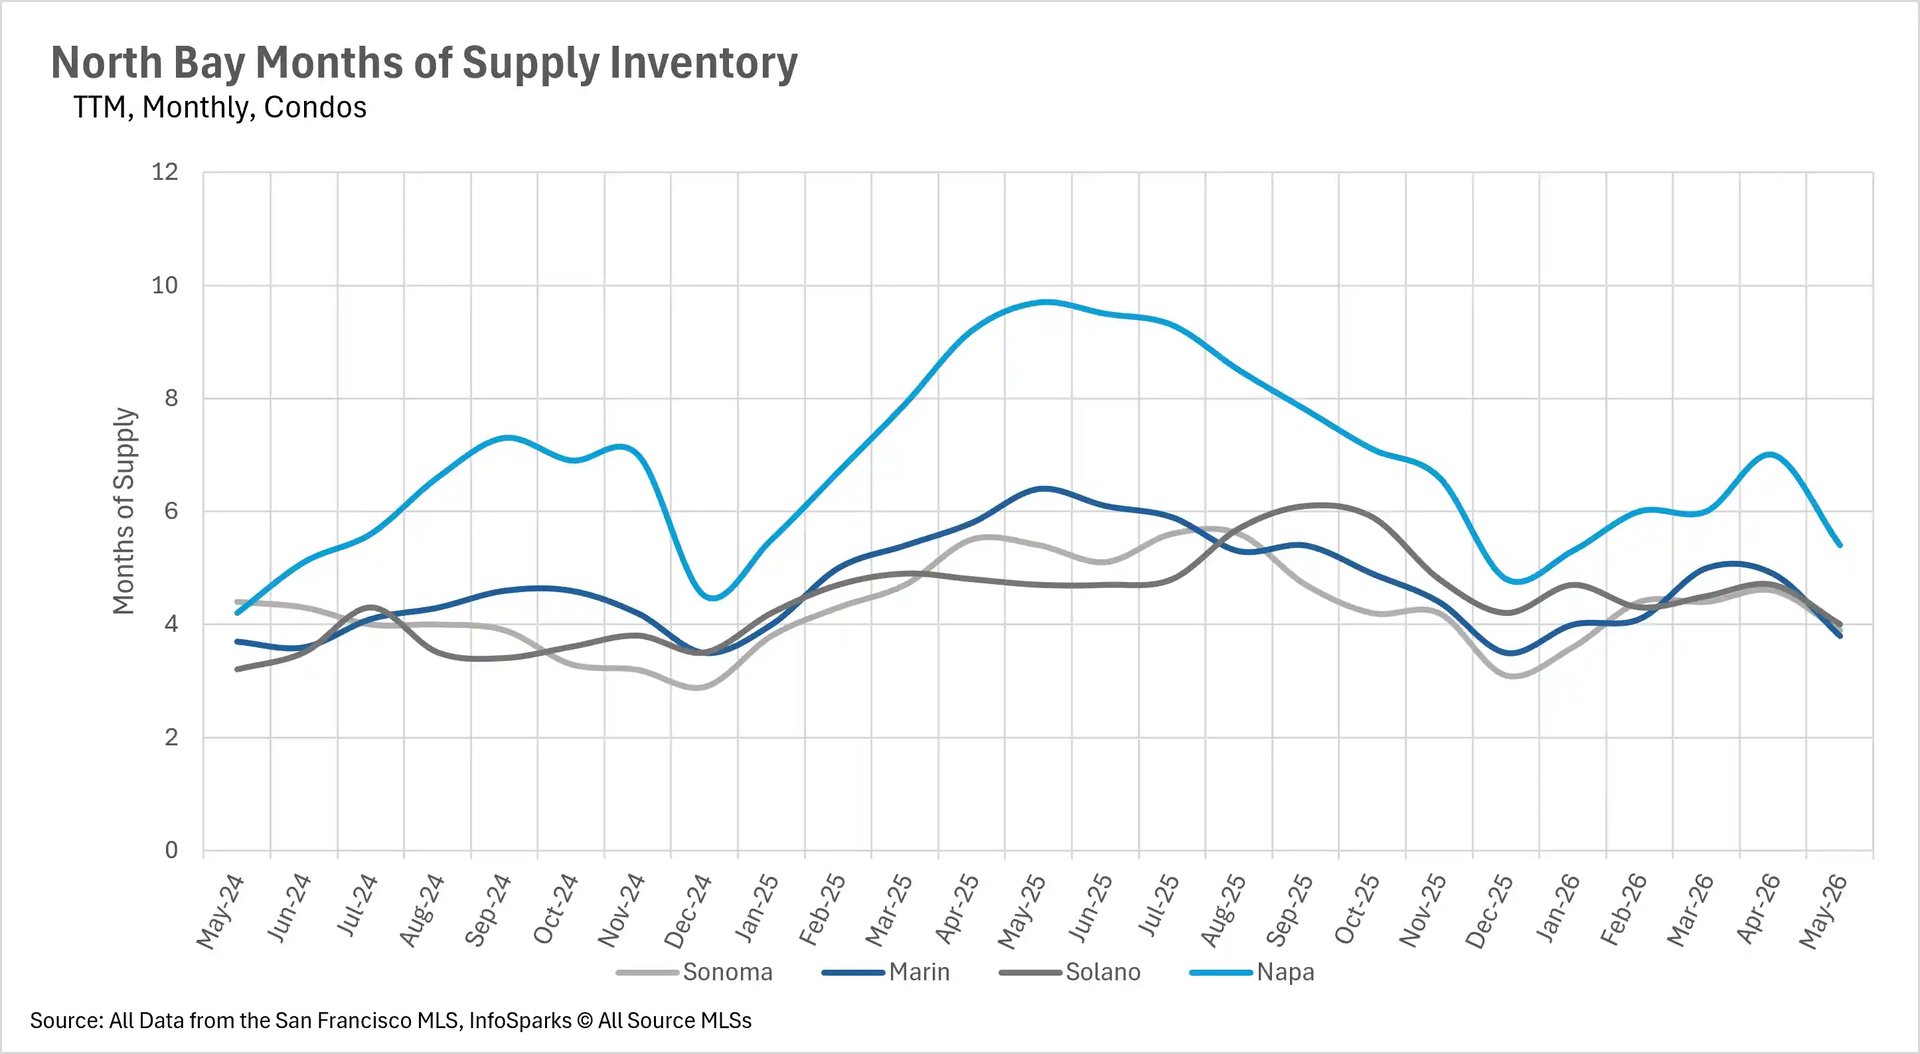
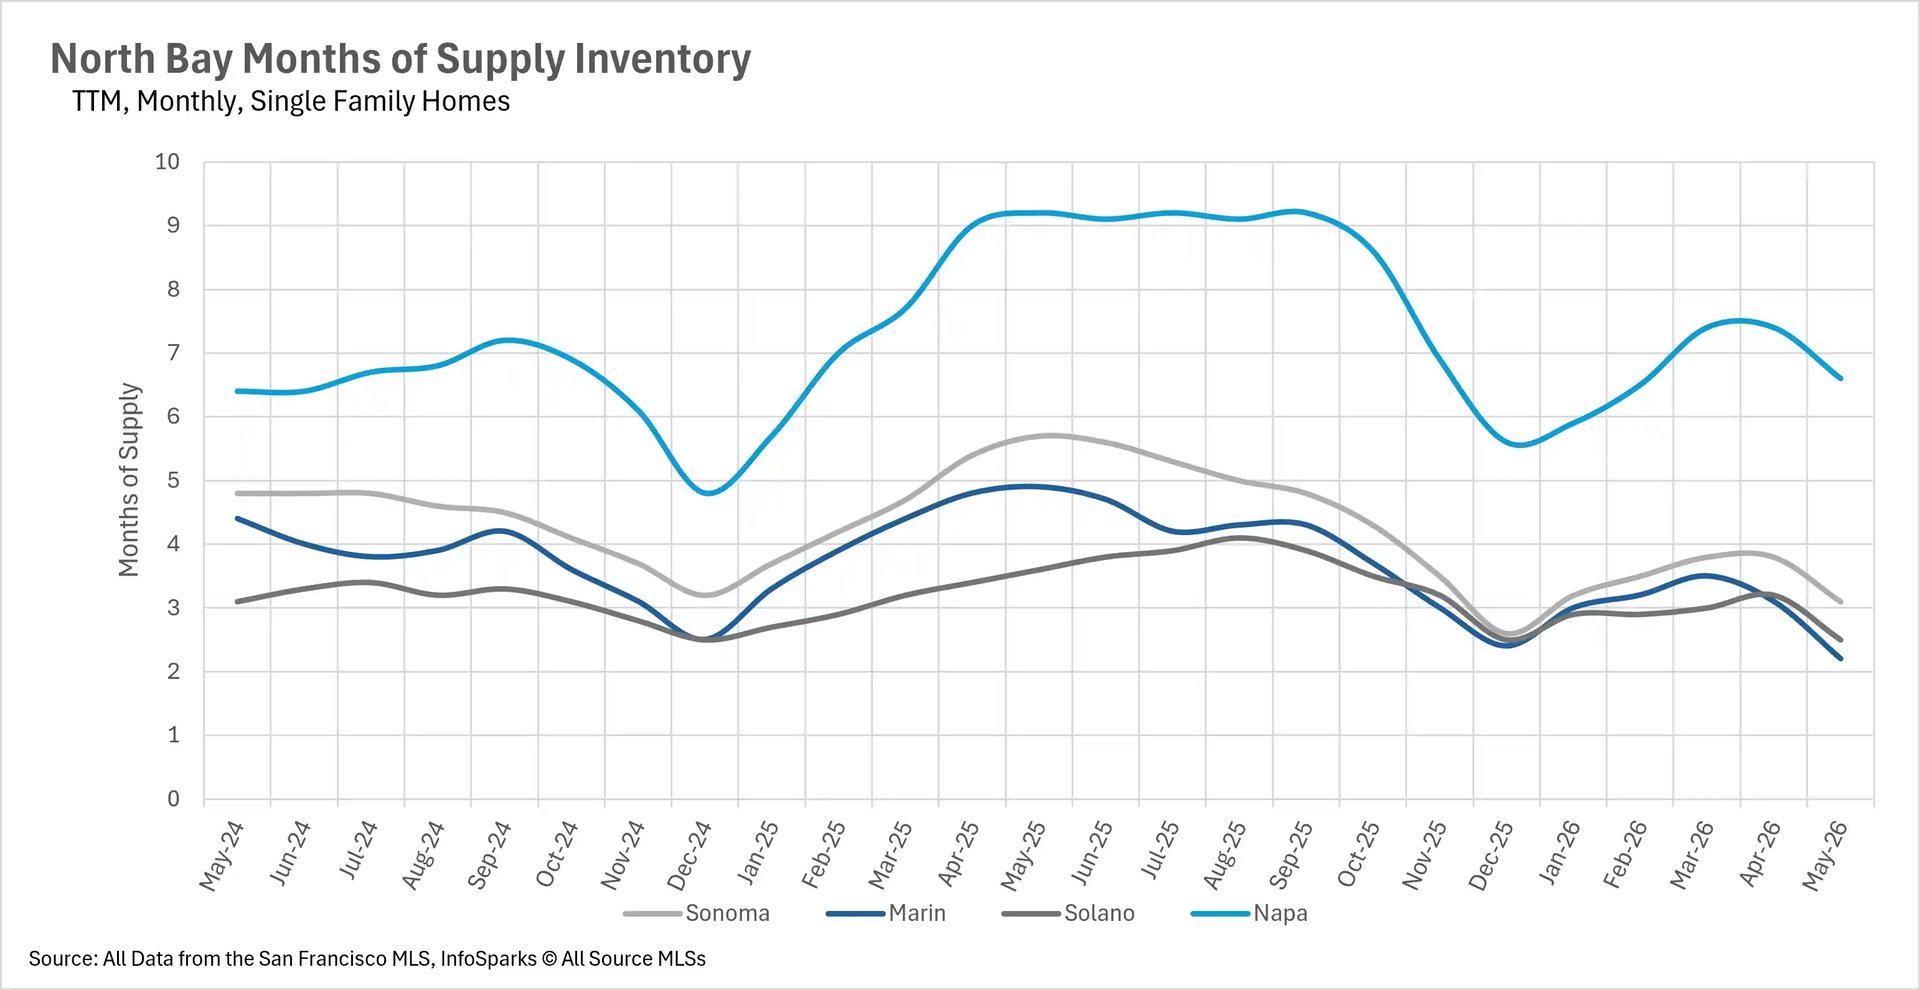
When determining whether a market is a buyers' market or a sellers' market, we look at the Months of Supply Inventory (MSI) metric. The state of California has historically averaged around three months of MSI, so any area with at or around three months of MSI is considered a balanced market. Any market that has less than three months of MSI is considered a seller's market, whereas markets with more than three months of MSI are considered buyers' markets.
May brought a significant tightening of inventory across the North Bay as we head into the summer selling season. The single-family home market is firmly in seller's territory in three of the four counties. Marin County has just 2.2 months of supply, down a remarkable 55.10% year-over-year. Solano County sits at 2.5 months (down 30.56%), and Sonoma County has 3.1 months of supply (down 45.61%). Even Napa County, which remains a buyer's market at 6.6 months, has tightened by 28.26% compared to last year. The condo market is more balanced, with Marin and Sonoma Counties hovering around 3.8-3.9 months of supply, Solano County at 4 months, and Napa County at 5.4 months. Overall, sellers continue to enjoy favorable conditions, especially in the single-family home market, as we move into the busiest season of the year.
Local Lowdown Data