Updated November 4, 2026. Data through October 31, 2026.
Are Mission Bay condos selling above asking price?
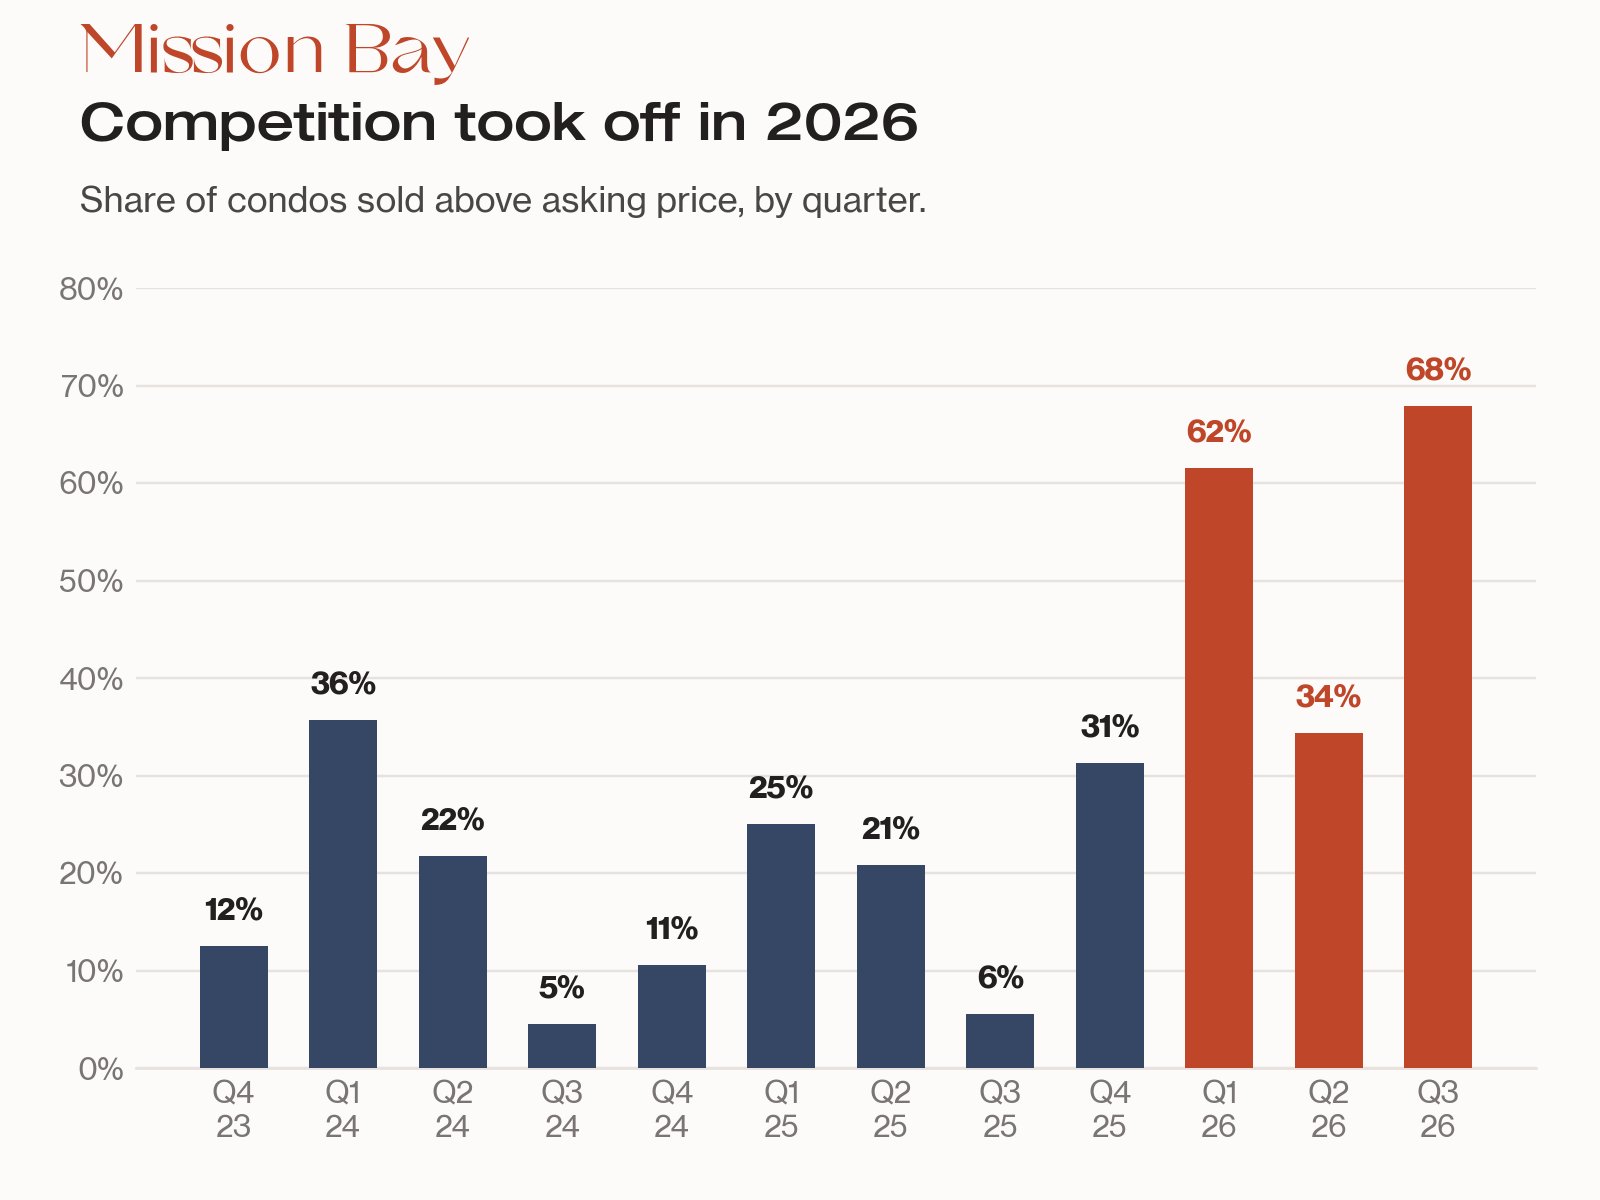
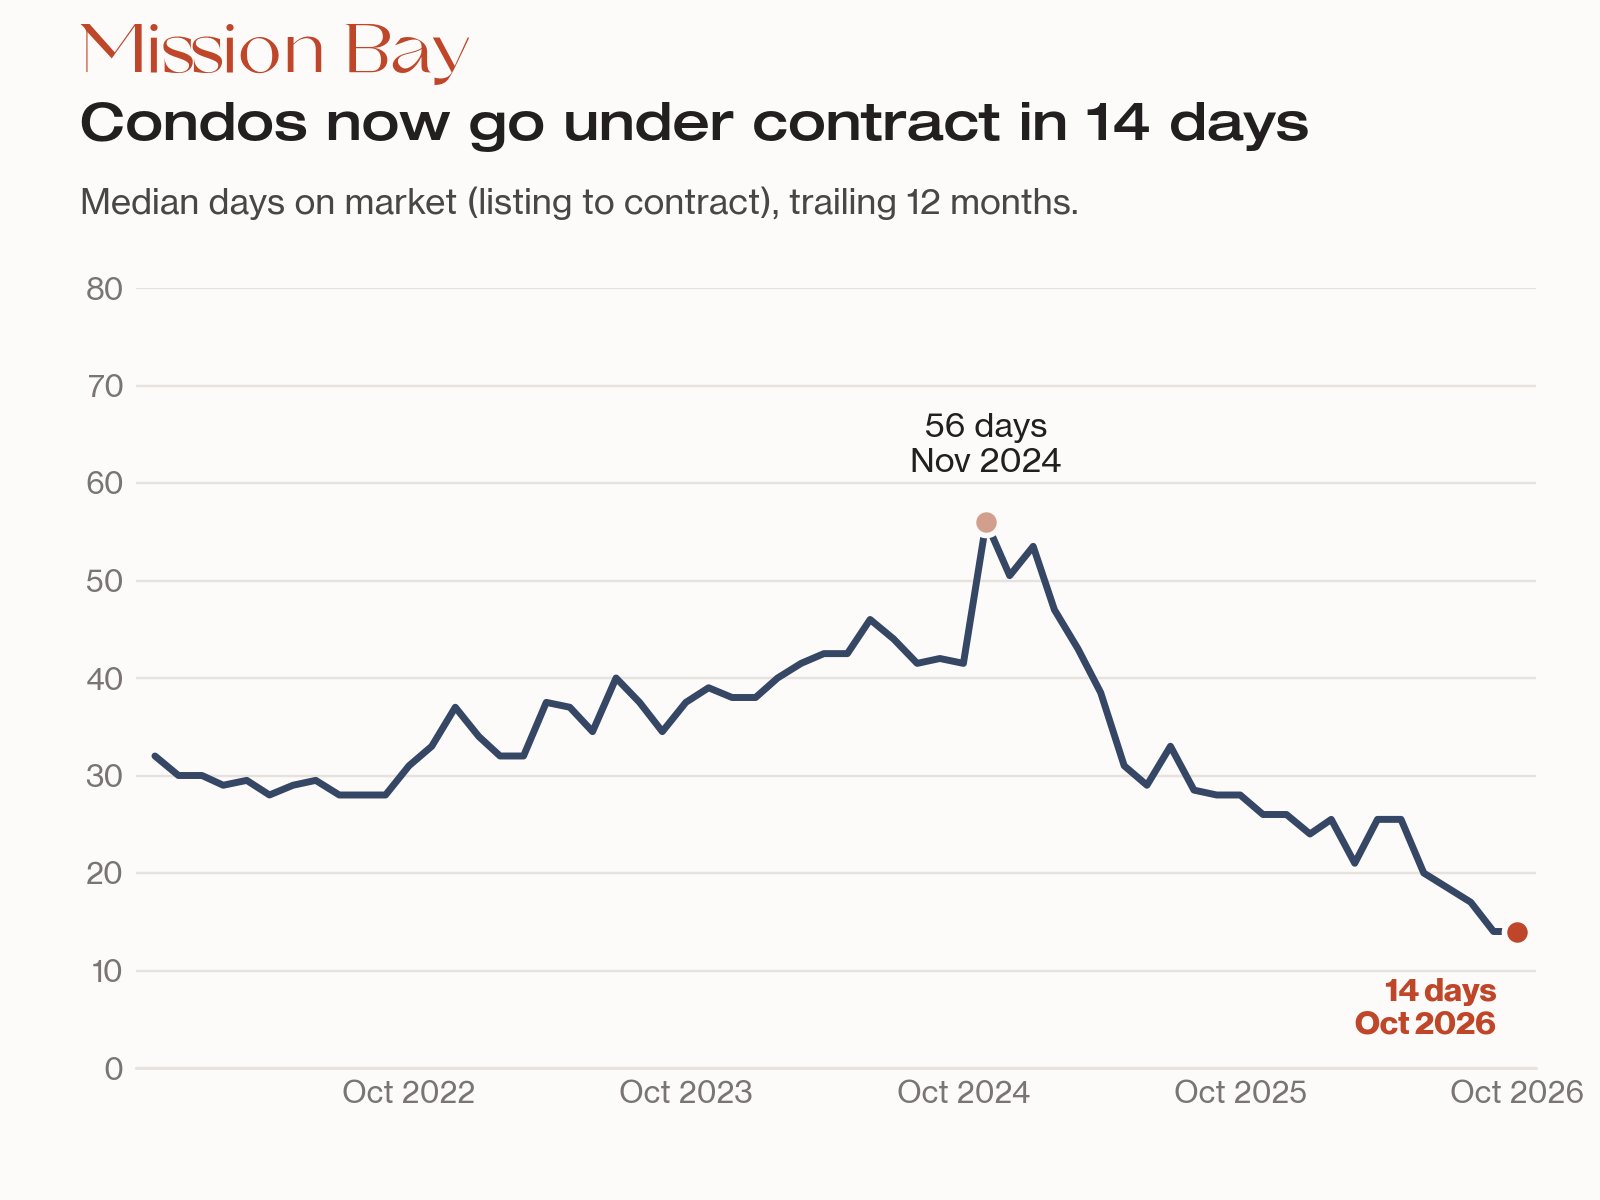
Yes, and far more often than a year ago. Of the 97 condos that sold in Mission Bay from November 2025 through October 2026, 49% closed above asking price, up from 20% in the 12 months before. The typical condo went under contract in 14 days, down from 28, and price per square foot is up about 16%.
This update covers condos in Mission Bay, using San Francisco Association of Realtors (SFAR) MLS sales through October 31, 2026. The pace picked up even more in the last three months: from August through October, 61% of condos sold above asking (22 of 36), against 26% (5 of 19) in the same months of 2025.
What do the latest Mission Bay condo numbers show?
Over the last 12 months, Mission Bay condos sold faster, for more per square foot and with far fewer price cuts than the year before. For comparison with the wider city, see our San Francisco market update.
Measure | Now | A year ago |
|---|---|---|
Sold above asking | 49% (48 of 97) | 20% (17 of 87) |
Median days to contract | 14 | 28 |
Sales that needed a price cut | 11% (11 of 97) | 31% (27 of 87) |
Median price per sq ft | $1,157 | $995 |
Median sale price | $1,300,000 | $1,060,000 |
Closed sales | 97 | 87 |
August through October 2026 versus the same months of 2025:
- Sold above asking: 61% (22 of 36), up from 26% (5 of 19)
- Median days to contract: 11, down from 26
- Median price per sq ft: $1,258, up from $1,111
- New listings: 48, up from 23
- Condos going under contract: 33, up from 16
October on its own: 15 sales, a $1,360,000 median, 12 days to contract and $1,301 per square foot. That's the busiest month in the last three, but a single month is a small sample, so we lead with the longer view.
What changed in the Mission Bay condo market?
Competition and speed changed in ways the numbers can support. Over 12 months, the share of condos sold above asking rose 30 points, and the gain could plausibly be anywhere from about 17 to 43 points. Median days to contract fell from 28 to 14, and the plausible range (6 to 32 days faster) stays below zero. Sellers have noticed: only 11% of recent sales needed a price cut first, versus 31% a year ago.
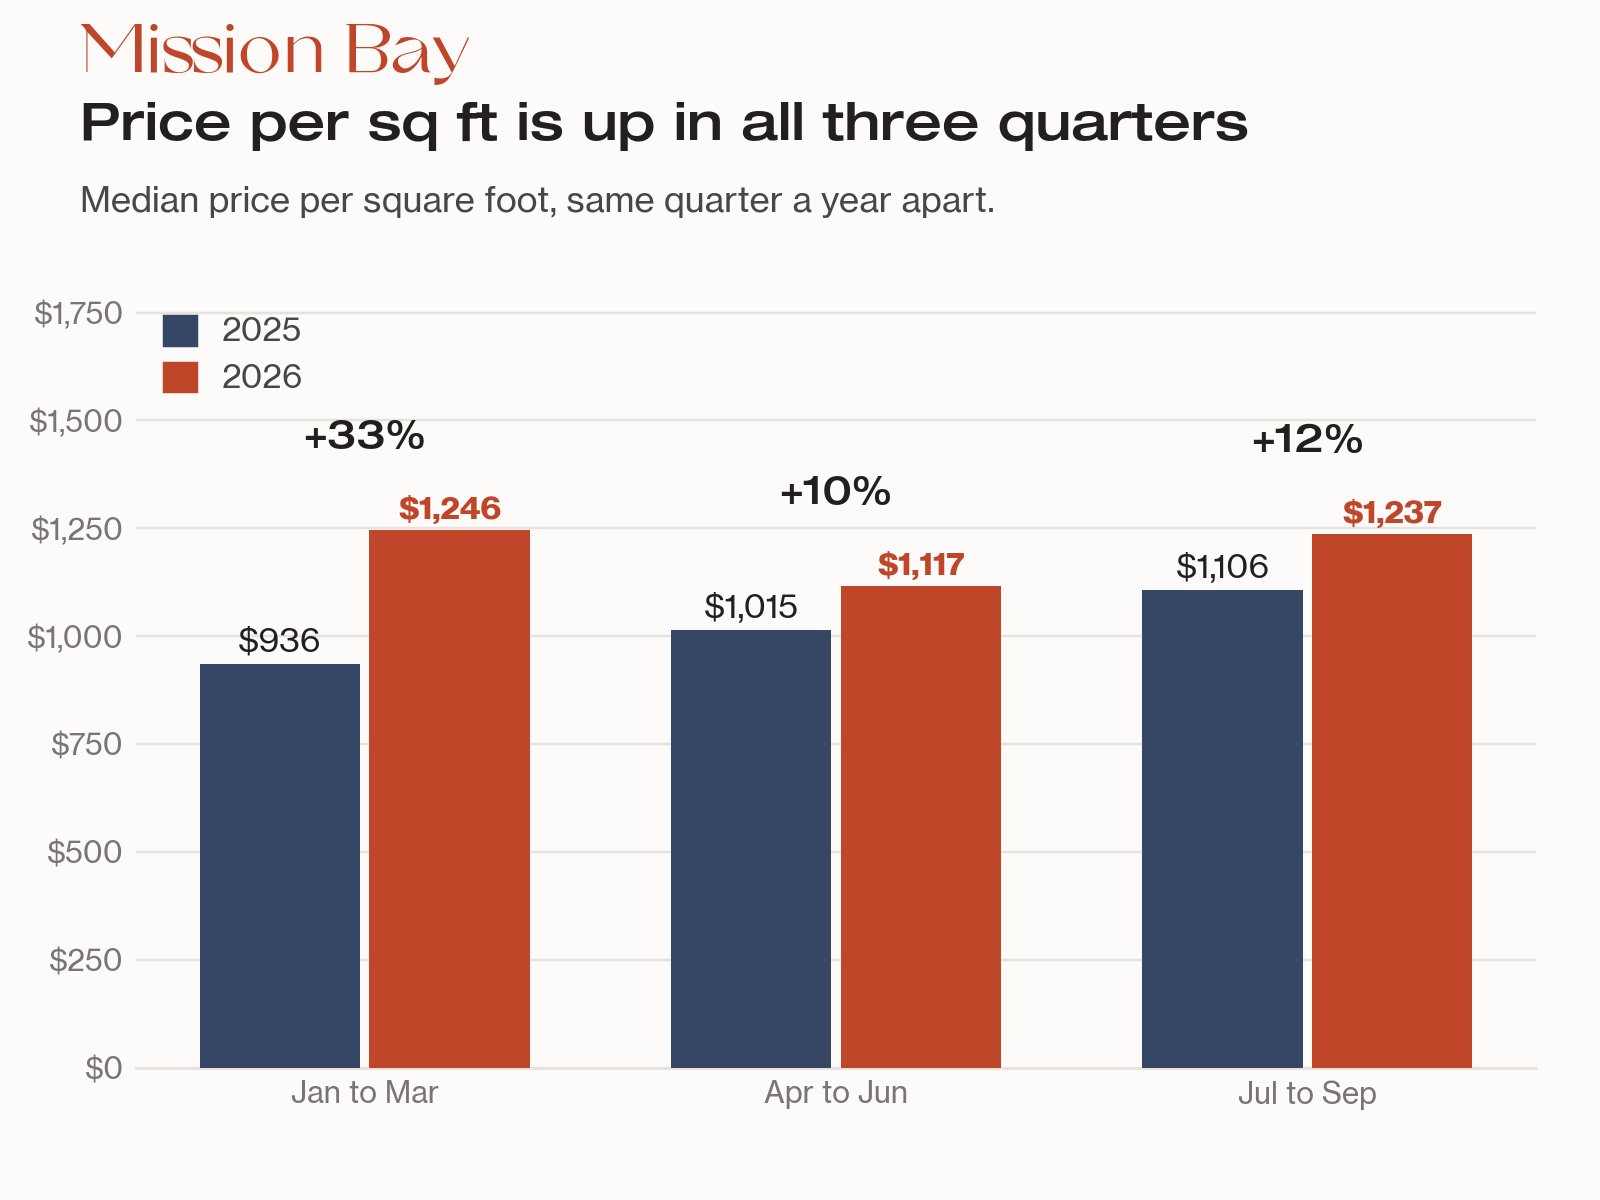
Price per square foot is the number we'd trust. It rose about 16% over 12 months, with a plausible range of roughly 4% to 31%. Holding last year's bedroom mix fixed, the gain is about 17% (7% to 27%). The 12-month median sale price rose 23% to $1,300,000, but the plausible range runs from about -5% to 50%, because the mix of units that sell each year shifts a lot. Part of that is visible: condos under $900,000 were 38% of sales a year ago (33 of 87) and 25% now (24 of 97). Price per square foot adjusts for size, and it rose in each of the first three quarters of 2026 compared with the same quarter of 2025, though any single quarter has only 13 to 32 sales.
We can check this another way. In the 10 years of data we track, 42 of the Mission Bay condos sold in the last 12 months had also sold earlier, at least a year before. Two of every three sold for more the second time, with a median gain of 7% over a median of 6.5 years. That's a sanity check on long-run direction, not a forecast.
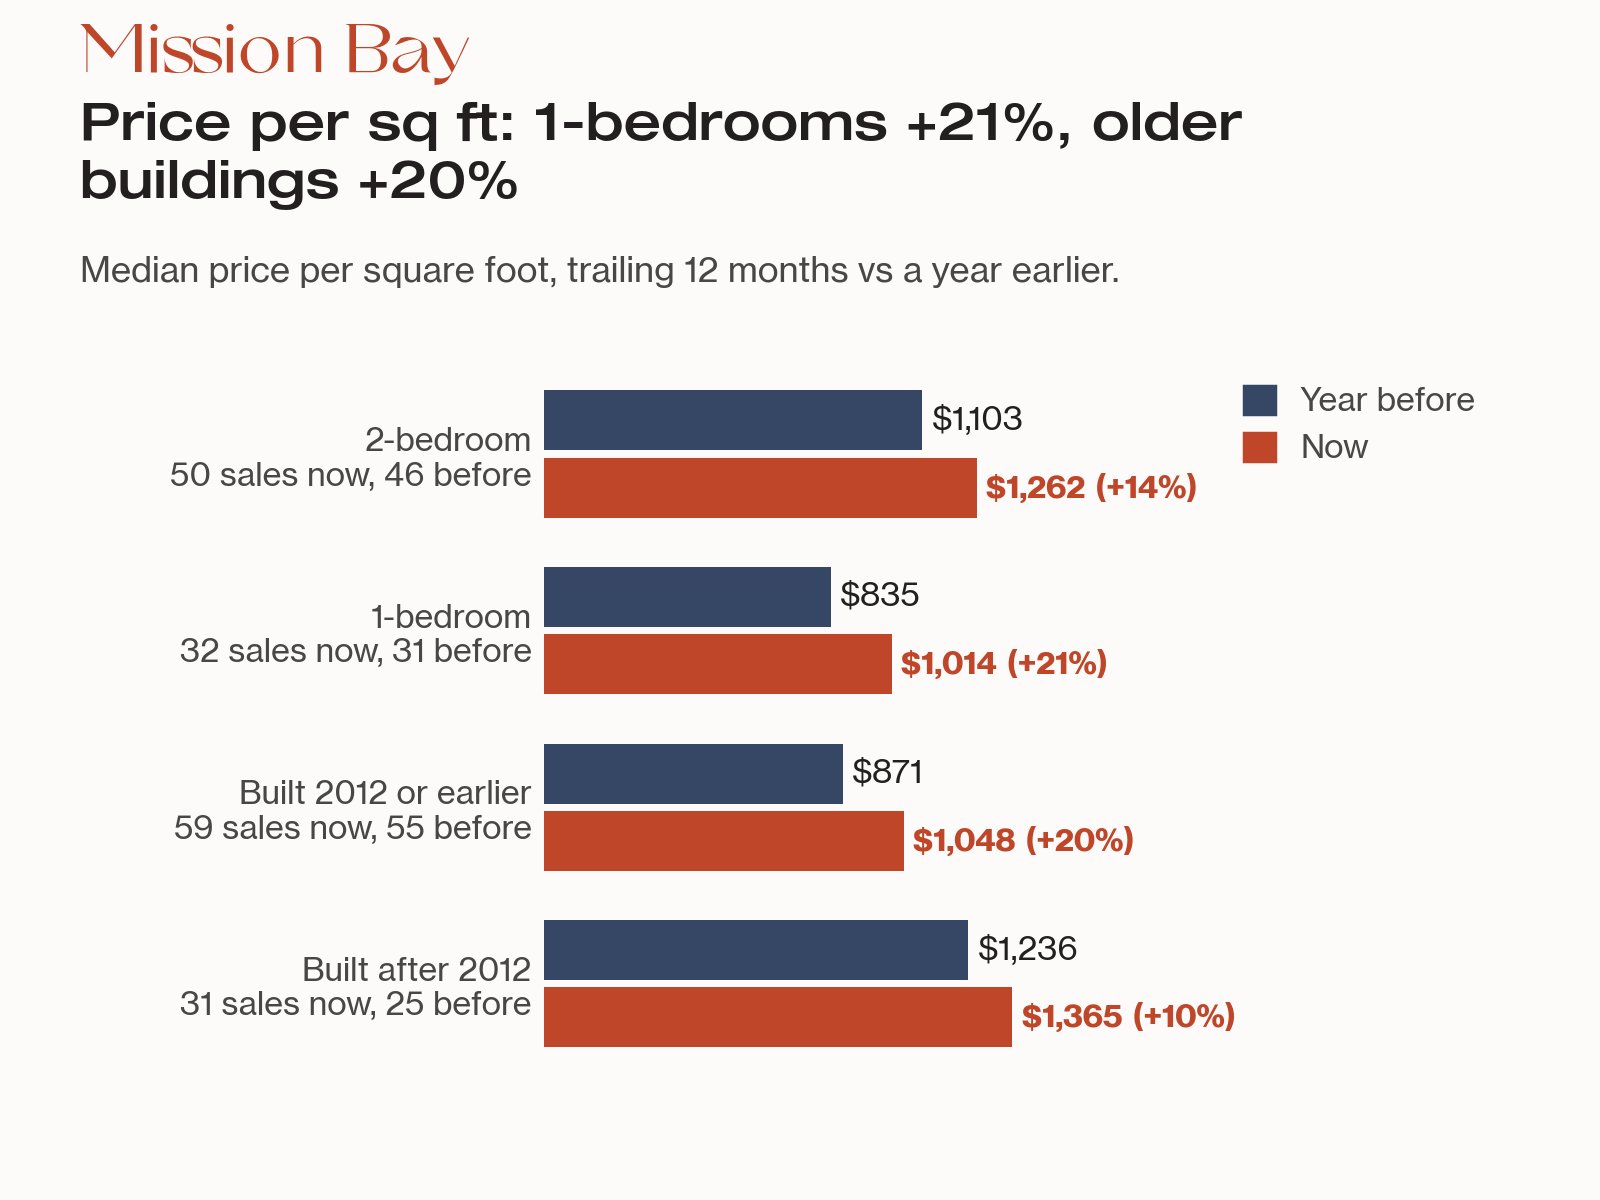
Where the gains are. They're broad, and strongest in smaller and older condos. Price per square foot rose about 21% for one-bedrooms ($835 to $1,014) and 20% for buildings from 2012 or earlier ($871 to $1,048). Two-bedrooms rose about 14% ($1,103 to $1,262) and newer buildings about 10% ($1,236 to $1,365), though for newer buildings the plausible range reaches slightly below zero, so we read it as a direction, not a precise figure. One-bedrooms now spend a median of 21 days on the market instead of 46, and two-bedrooms 13 days instead of 25.
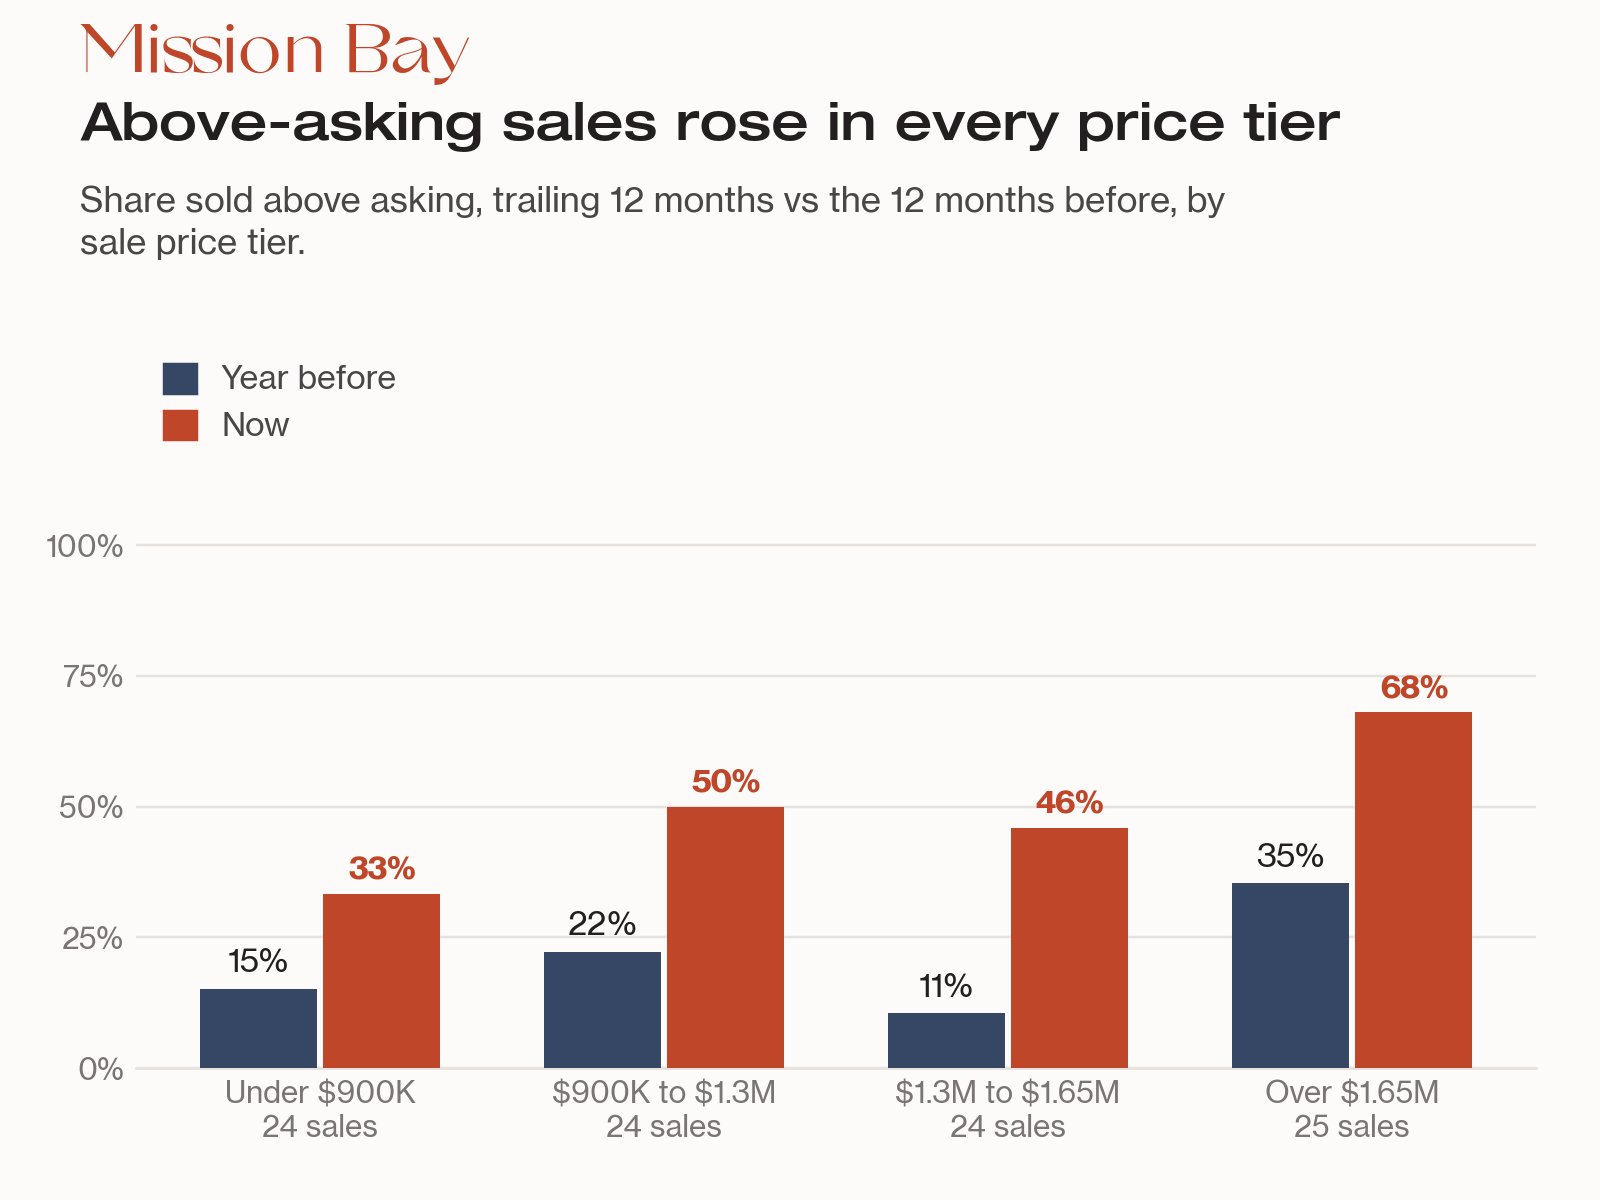
Competition rose at every price. We split the last 12 months of condo sales into four price tiers of about 24 sales each. Above-asking sales rose in all four: from 15% to 33% under $900,000, from 22% to 50% between $900,000 and $1.3 million, from 11% to 46% between $1.3 million and $1.65 million, and from 35% to 68% over $1.65 million. The biggest change in speed was at the entry level, where the median went from 63 days to contract to 25.5. Each tier is a small sample, so treat the pattern as a guide.
Is Mission Bay a buyer's or seller's market?
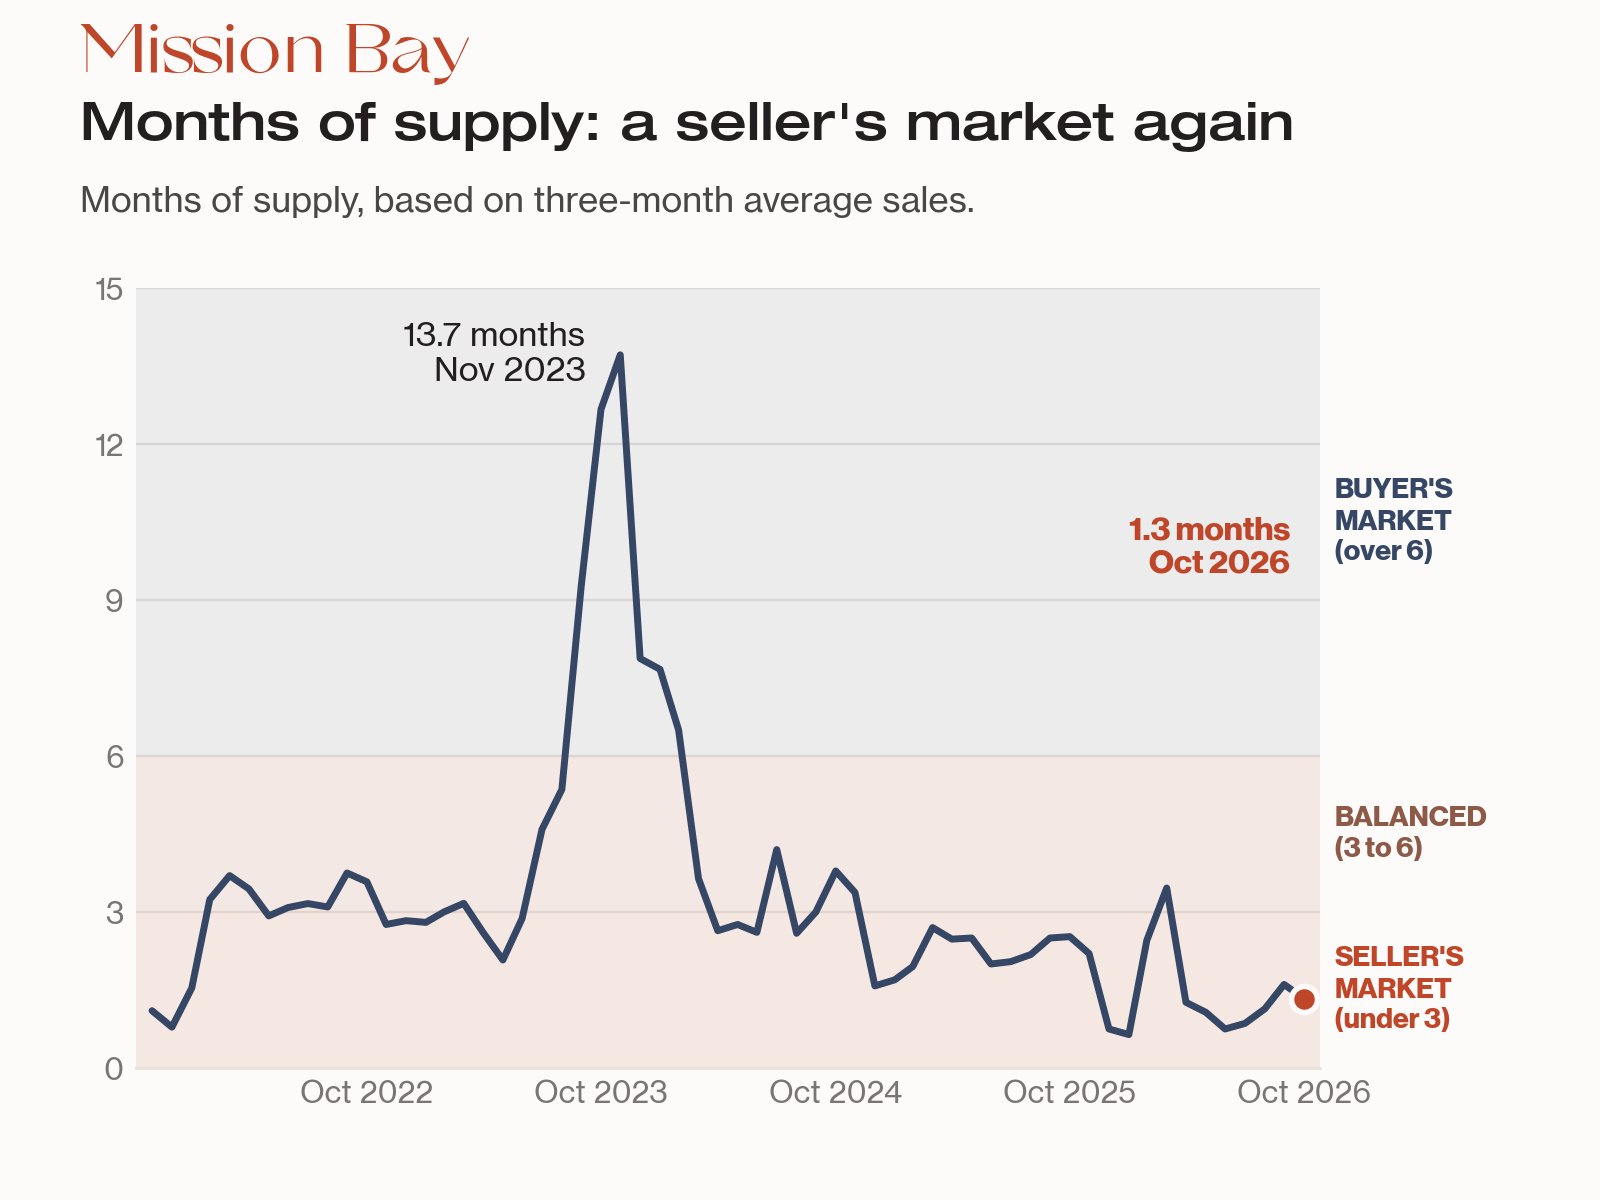
Right now it's a seller's market. Mission Bay has 1.3 months of supply (based on the last three months of sales), meaning it would take about five to six weeks to sell every listed condo at the recent pace. At the end of October, 16 condos were on the market, counting active and contingent listings, where an offer is accepted but conditions haven't cleared. Under 3 months favors sellers, 3 to 6 is balanced, and over 6 favors buyers.
It hasn't always been this way. Over the last 60 months, Mission Bay has been a seller's market in 36, balanced in 18 and a buyer's market in 6. Those six ran from September 2023 through February 2024, when supply peaked at 13.7 months.
Are Mission Bay condo prices at a record?
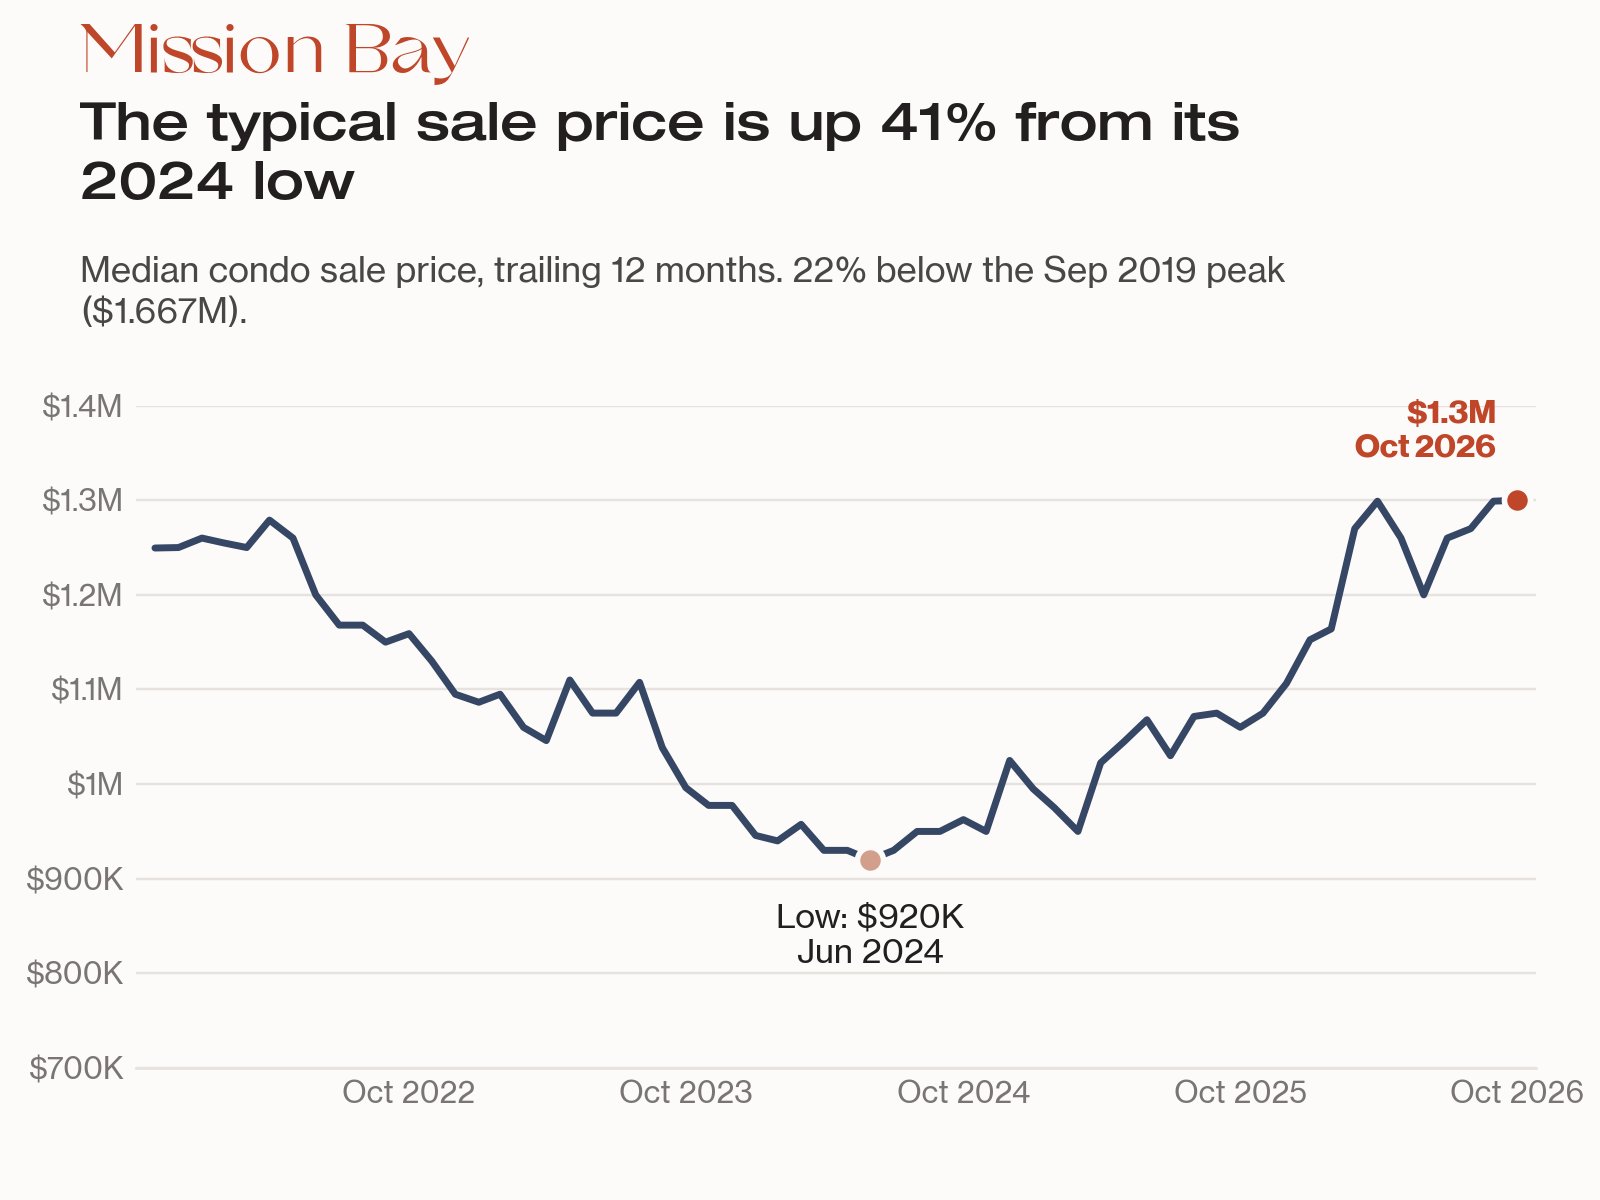
No. A strong rebound can feel like a record, but the 12-month median condo price of $1,300,000 is only 7.0% above October 2016 ($1,215,000), about 0.7% a year. After San Francisco-area inflation (up 38% over the same windows), that's a decline of about 22%. The price is still 22% below the September 2019 peak of $1,667,500, and price per square foot is up 7% in ten years, from $1,079 to $1,157. The median has risen 41% since its low of $920,000 in June 2024, so this is a recovery, not a new high.
What does this mean for Mission Bay buyers and sellers?
If you're buying a Mission Bay condo
Our recommendation is to get pre-approved and decide your maximum price before you tour, because 49% of condos sold above asking and 31% went under contract within a week. Our buying process walks through each step.
- Newer buildings move fastest. 16 of the 31 condos sold in buildings from after 2012 went under contract within a week, and the median was 7 days. Two-bedrooms took a median of 13 days and sold for $1,580,000.
- Talk to a lender about rate locks and buydowns now. Freddie Mac's 30-year average was 7.40% on October 8 and 15, and 7.24% on October 29, 2026, versus 6.17% a year earlier.
- Look for the listings that have sat. Of the 14 Mission Bay condos for sale in early November, 3 had been listed more than 60 days and 5 had cut their price. That's where there's room to negotiate.
- Widen the search if you need to. Neighboring South Beach is a natural comparison.
If you're selling a Mission Bay condo
The goal is to use the demand that's here and to price from recent sales, not last year's. Our selling process covers preparation and timing, and you can start with a free home valuation.
- Price from current comps. Condos that sold from August through October 2026 had a median of $1,258 per square foot, versus $1,111 a year earlier. Median price can swing with the mix of units sold, so price per square foot is the better comparison.
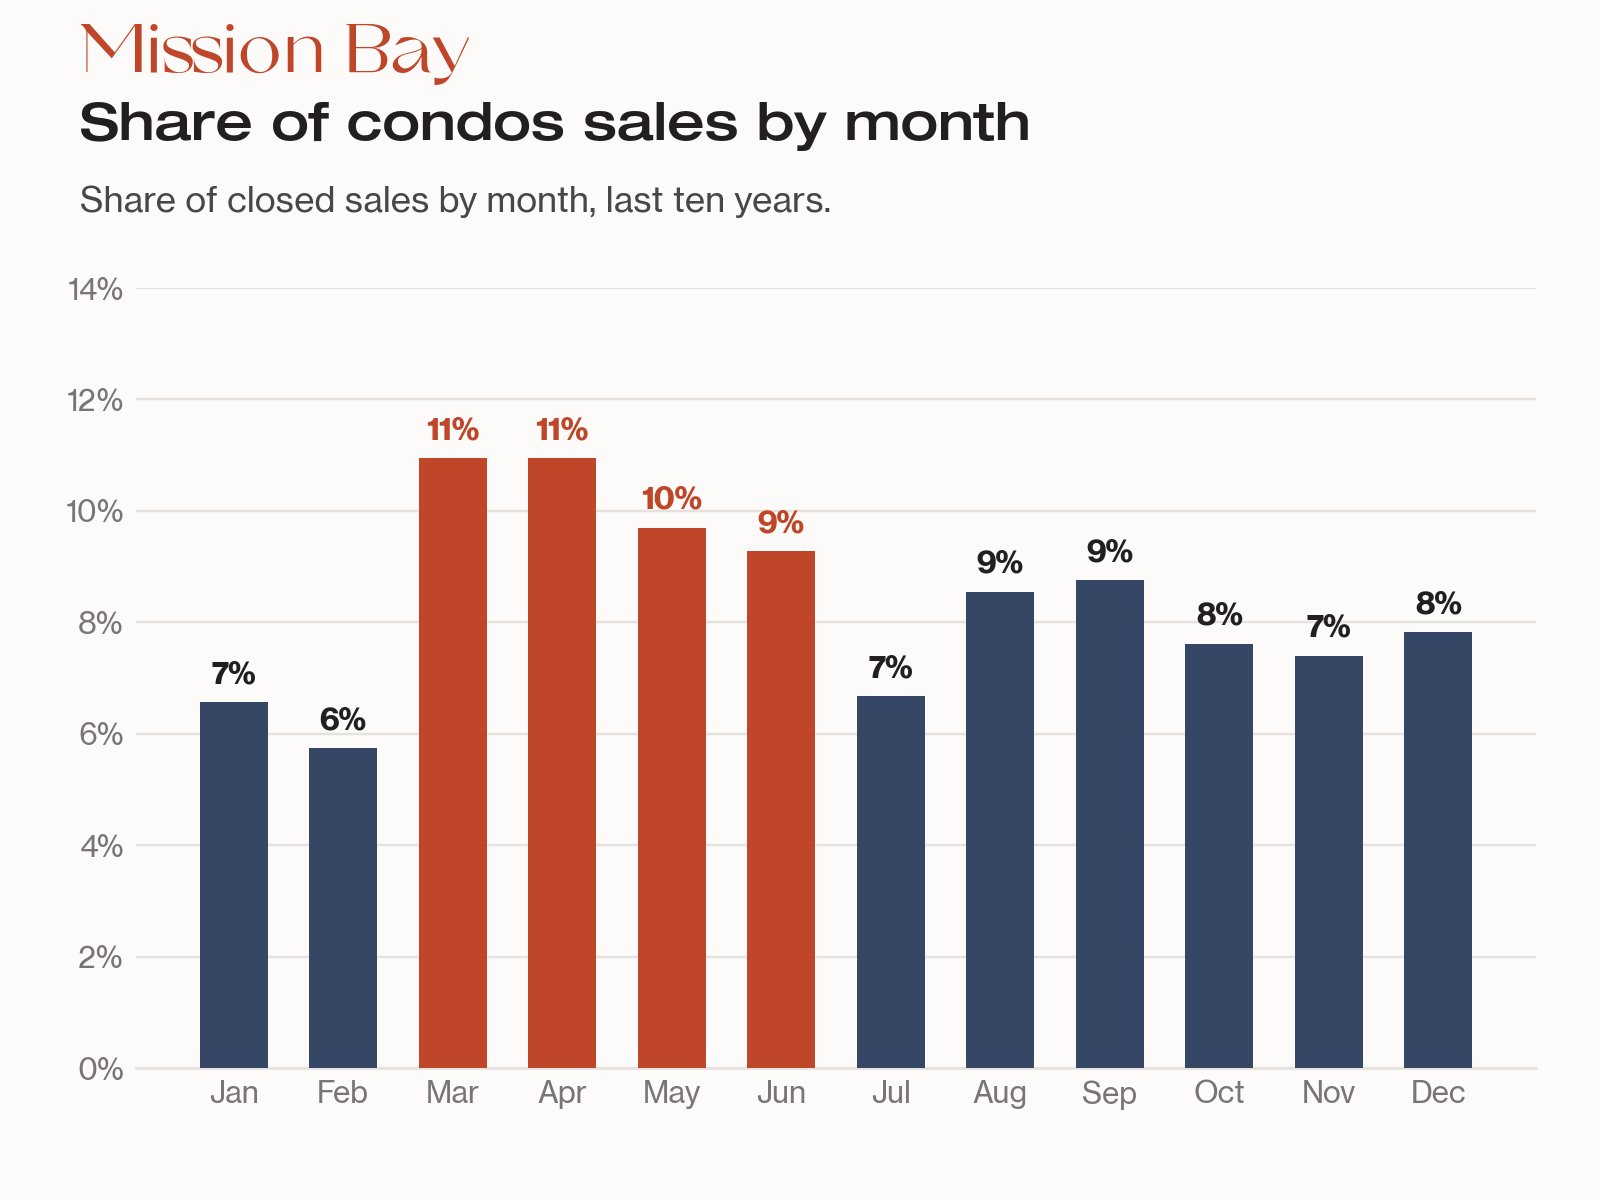
- Mind the calendar. Over the last 10 years, March through June brought 41% of Mission Bay condo sales. November, December and January are slower: condos took a median of 35, 41 and 55 days to go under contract in those months, against 21 to 26 days in March through June. Our recommendation is to plan a February or March launch if you can wait, because February's 18-day median was the quickest of any month, though it's also a low-volume month (6% of sales). If you'd rather list now, expect more time on the market. For the citywide picture, see our guide to the best time to sell a home in San Francisco.
- Prepare before you list. With a median of 11 to 14 days to contract, the first week matters most, so photos, disclosures and pre-inspections should be done before launch.
What should you watch in the Mission Bay market this winter?
Here's the line between what we've measured and what we haven't. The rise in above-asking sales, the faster days to contract and the rise in price per square foot over 12 months are well supported by the sales. The change in median sale price and the change in any single quarter or segment could largely reflect which condos happened to sell, so don't lean on them.
What we haven't measured is how mortgage rates near 7.24% will affect buyers. Sales close weeks after a contract is signed, so October's closings mostly reflect offers made earlier in the fall. November and December closings will show more. We're watching three things:
- Condos going under contract (the leading indicator). 33 condos went under contract from August through October, up from 16 a year earlier. A drop would show up here first.
- New listings versus inventory. New listings more than doubled to 48 for the three months, from 23, and 16 condos were on the market at the end of October. More listings would loosen supply.
- Sale-to-list ratio. The typical condo sold for 100% of its list price over 12 months, and 102% in October. A slide below 100% would be the earliest sign of cooling.
Thinking about a move this winter? Let's look at the data for your building, not the neighborhood headline. Contact our team and we'll send you a short read on your unit. You can also browse all of our Bay Area market updates, or visit Kinoko Real Estate.
Mission Bay condo market FAQ
How much do condos cost in Mission Bay?
In the 12 months through October 2026, the median Mission Bay condo sold for $1,300,000, or $1,157 per square foot, across 97 sales. One-bedrooms had a median of $842,500 and two-bedrooms $1,580,000. Prices vary by building age and unit size. Source: Kinoko analysis of SFAR MLS data.
How long does it take to sell a condo in Mission Bay?
The median Mission Bay condo went under contract in 14 days over the 12 months through October 2026, down from 28 a year earlier, and 31% went under contract within a week. From August through October it was 11 days. November through January is slower, with 10-year medians of 35 to 55 days.
Do Mission Bay condos sell above asking price?
Increasingly, yes. In the 12 months through October 2026, 49% of Mission Bay condos sold above list price (48 of 97), up from 20% a year earlier. From August through October it was 61% (22 of 36). Above-asking sales rose in every price tier.
Is Mission Bay a buyer's or seller's market?
Mission Bay is a seller's market. It had 1.3 months of supply in October 2026, with 16 condos on the market at month end. Under 3 months favors sellers, 3 to 6 is balanced and over 6 favors buyers. It was a buyer's market from September 2023 to February 2024.
Sources
- Kinoko Real Estate analysis of San Francisco Association of Realtors (SFAR) MLS data, Mission Bay condominiums, through October 31, 2026. Retrieved November 4, 2026.
- Freddie Mac, "Mortgage Rates" (Primary Mortgage Market Survey, 30-year fixed average of 7.40% on October 8 and 15, 7.24% on October 29, 2026, and 6.17% a year earlier), freddiemac.com/pmms. Retrieved November 4, 2026.
- U.S. Bureau of Labor Statistics, CPI-U San Francisco-Oakland-Hayward, all items (series CUURS49BSA0), data.bls.gov. Retrieved October 30, 2026.
- Kinoko Real Estate, "San Francisco Real Estate Market Update", kinokorealestate.com. Retrieved November 4, 2026.
Kevin Gueco | CA DRE #01461677