The Local Lowdown
Quick Take:
- Single-family median sale prices in Santa Cruz County have fallen on a year-over-year basis for the first time in over a year.
- We’re seeing drastic increases in inventory across the board, as new listings flood the market.
- Despite a flood of new listings hitting the market, homes are still being bought up relatively quickly.
Note: You can find the charts/graphs for the Local Lowdown at the end of this section.
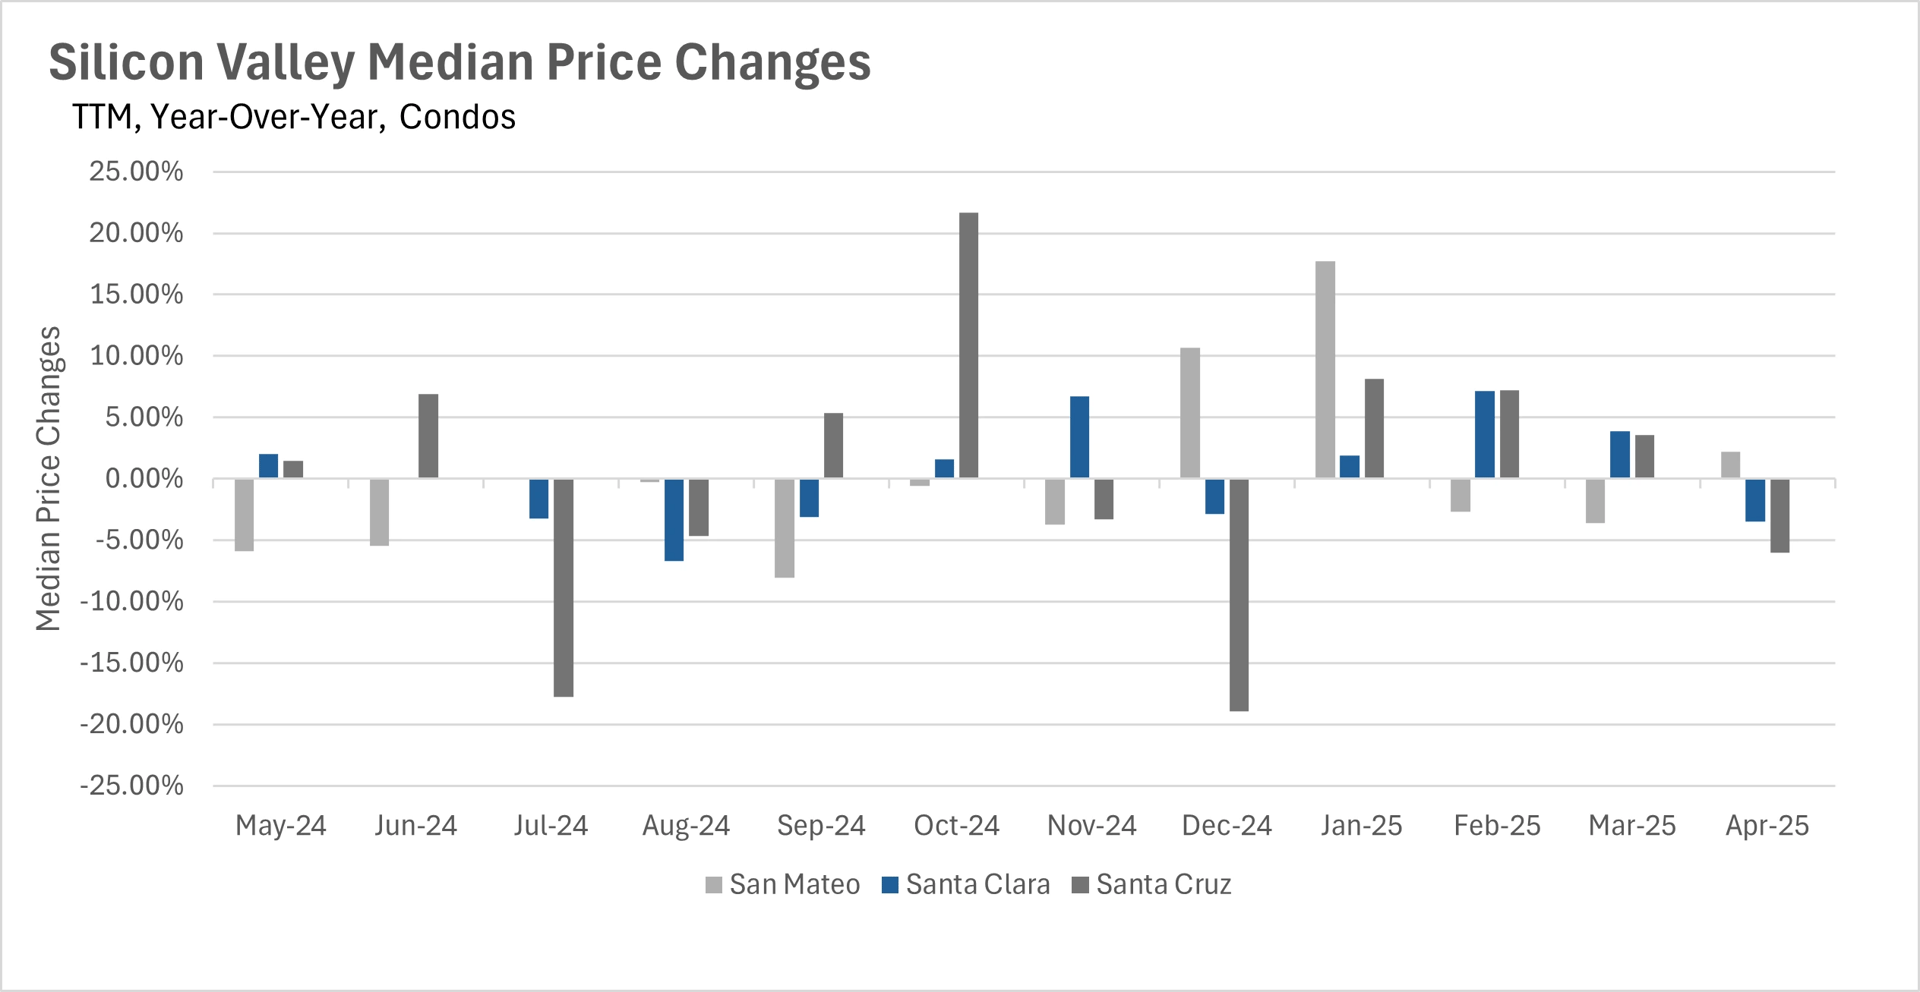
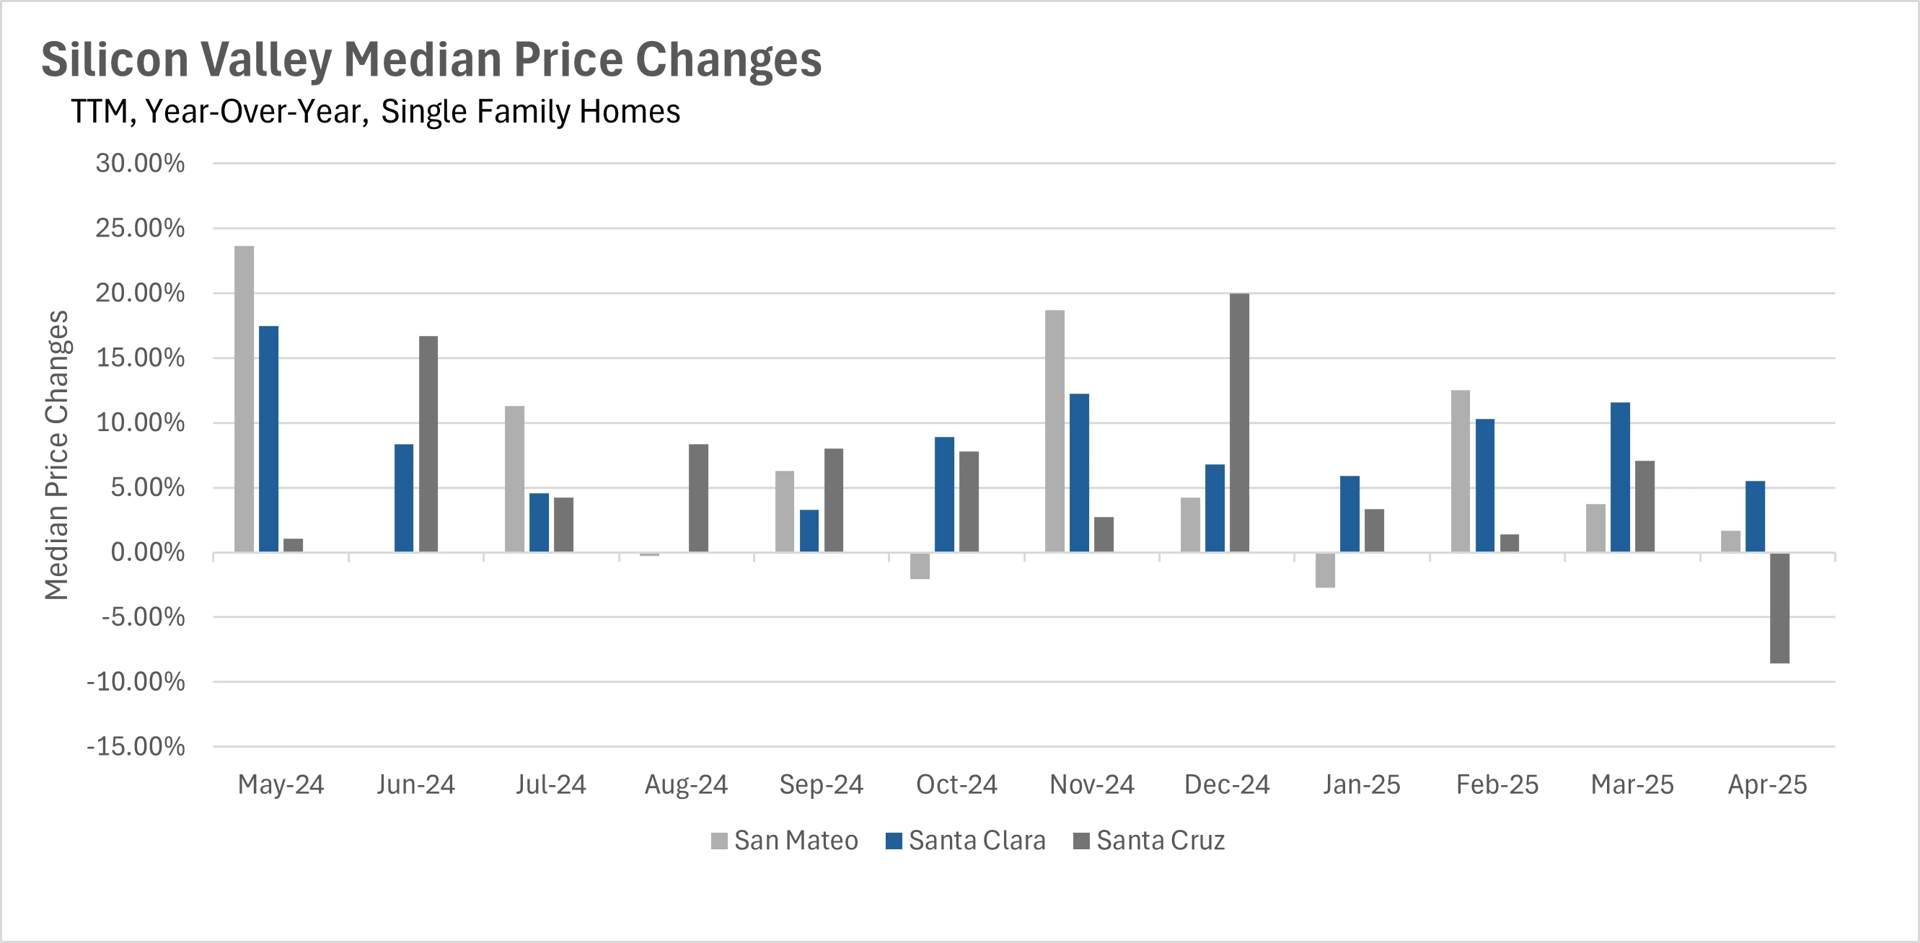
Santa Cruz County Breaks Its Winning Streak
For over a year, the median sale price for a single-family home increased every single month in Santa Cruz County. However, in April, this streak was unfortunately broken, and we saw quite a decline! The median listing sold for 8.57% less than it did around this time last year. Although this might sound like doom and gloom, it’s perfectly normal and healthy for a market to cool off after it’s been on fire for so long!
Additionally, it’s worth noting that the broader Silicon Valley market is performing quite well, with the median homes in San Mateo and Santa Clara Counties selling for 1.69% and 5.50% more than this time last year!
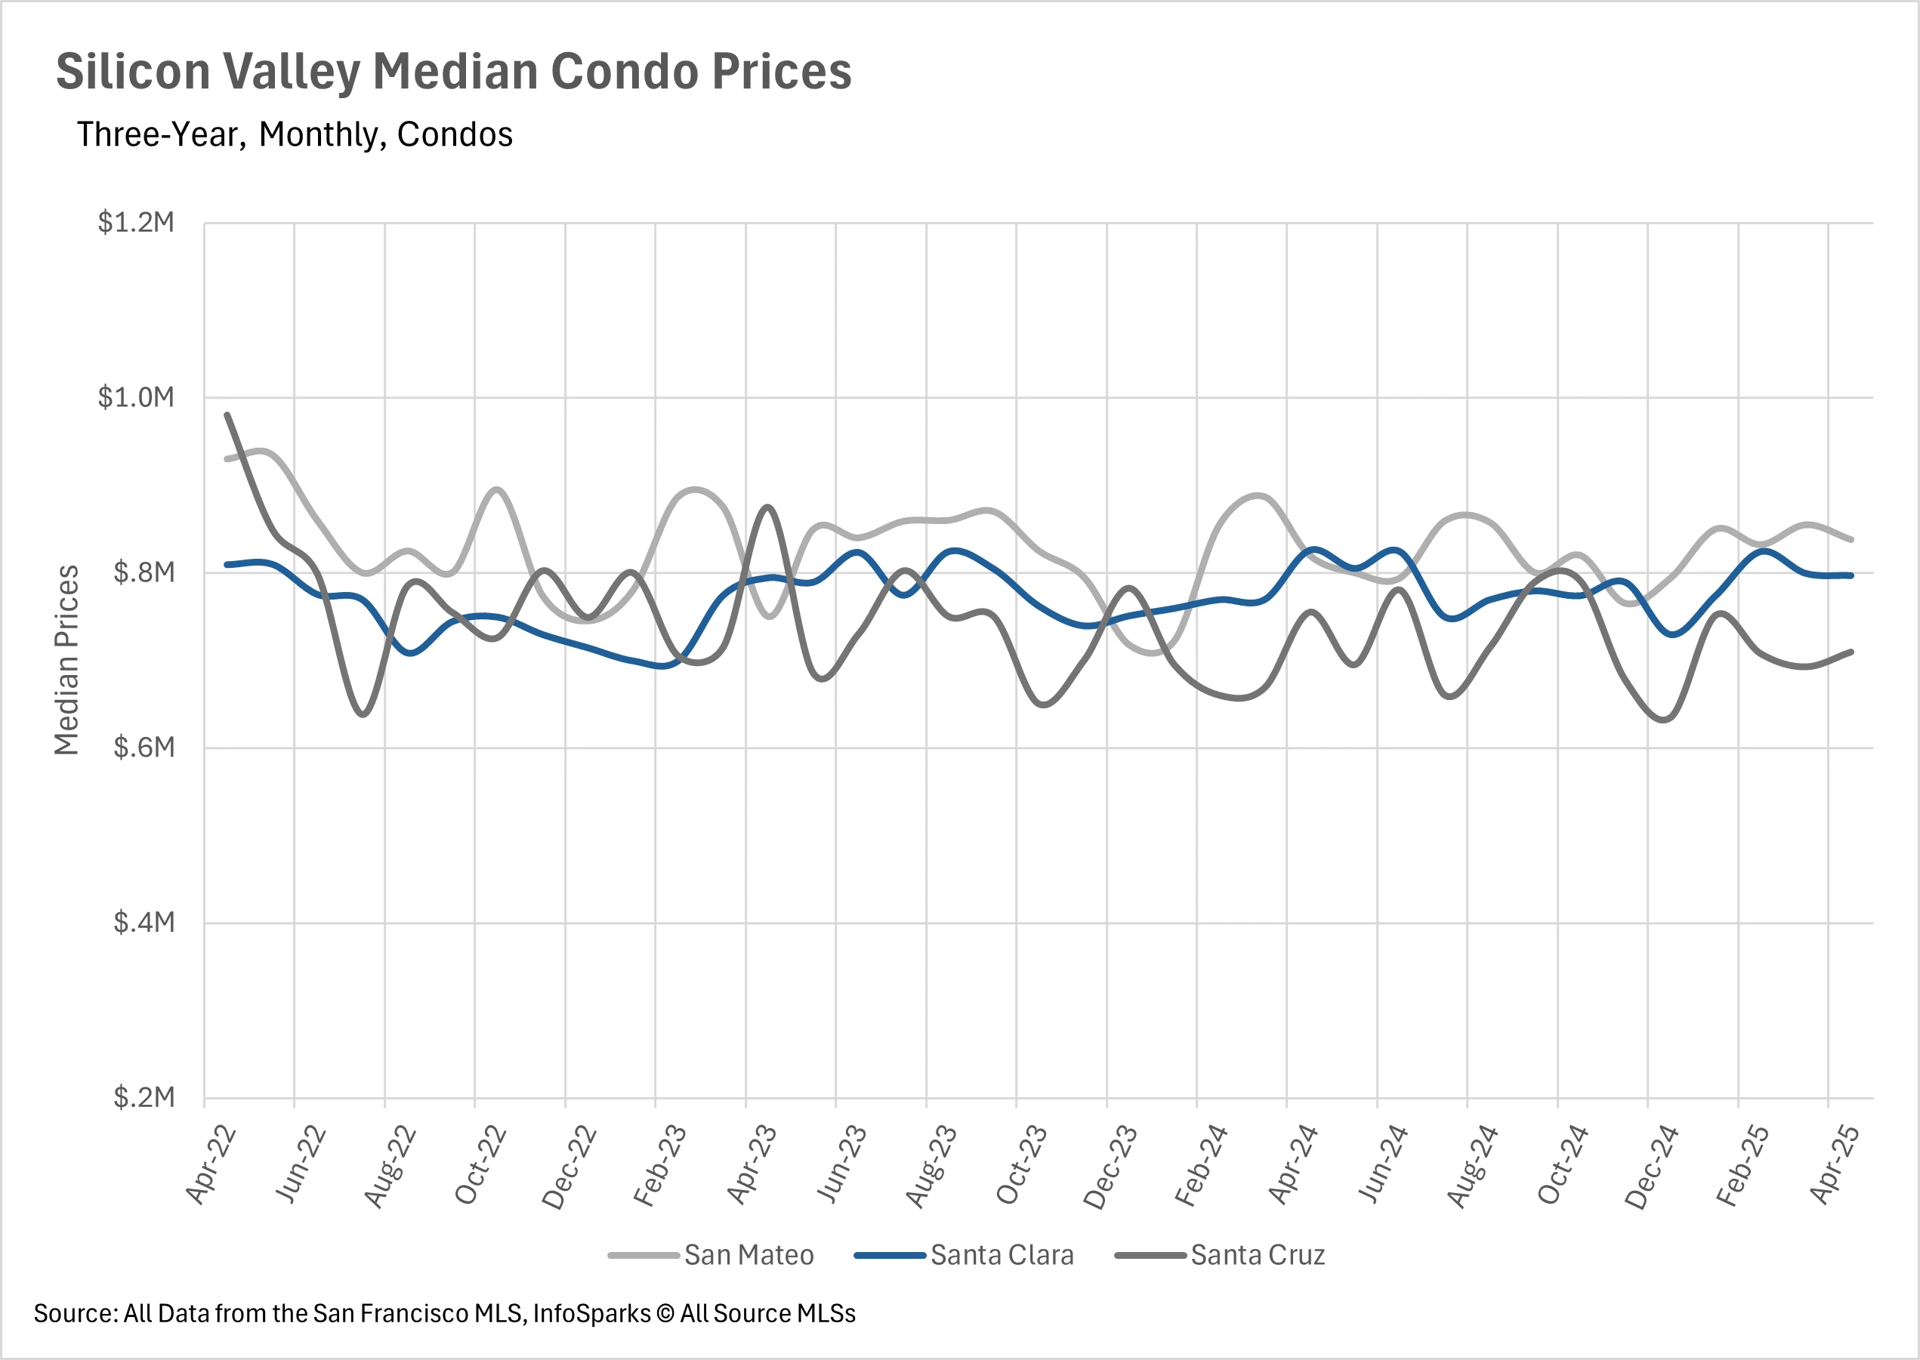
Inventory Levels are Skyrocketing Across the Silicon Valley
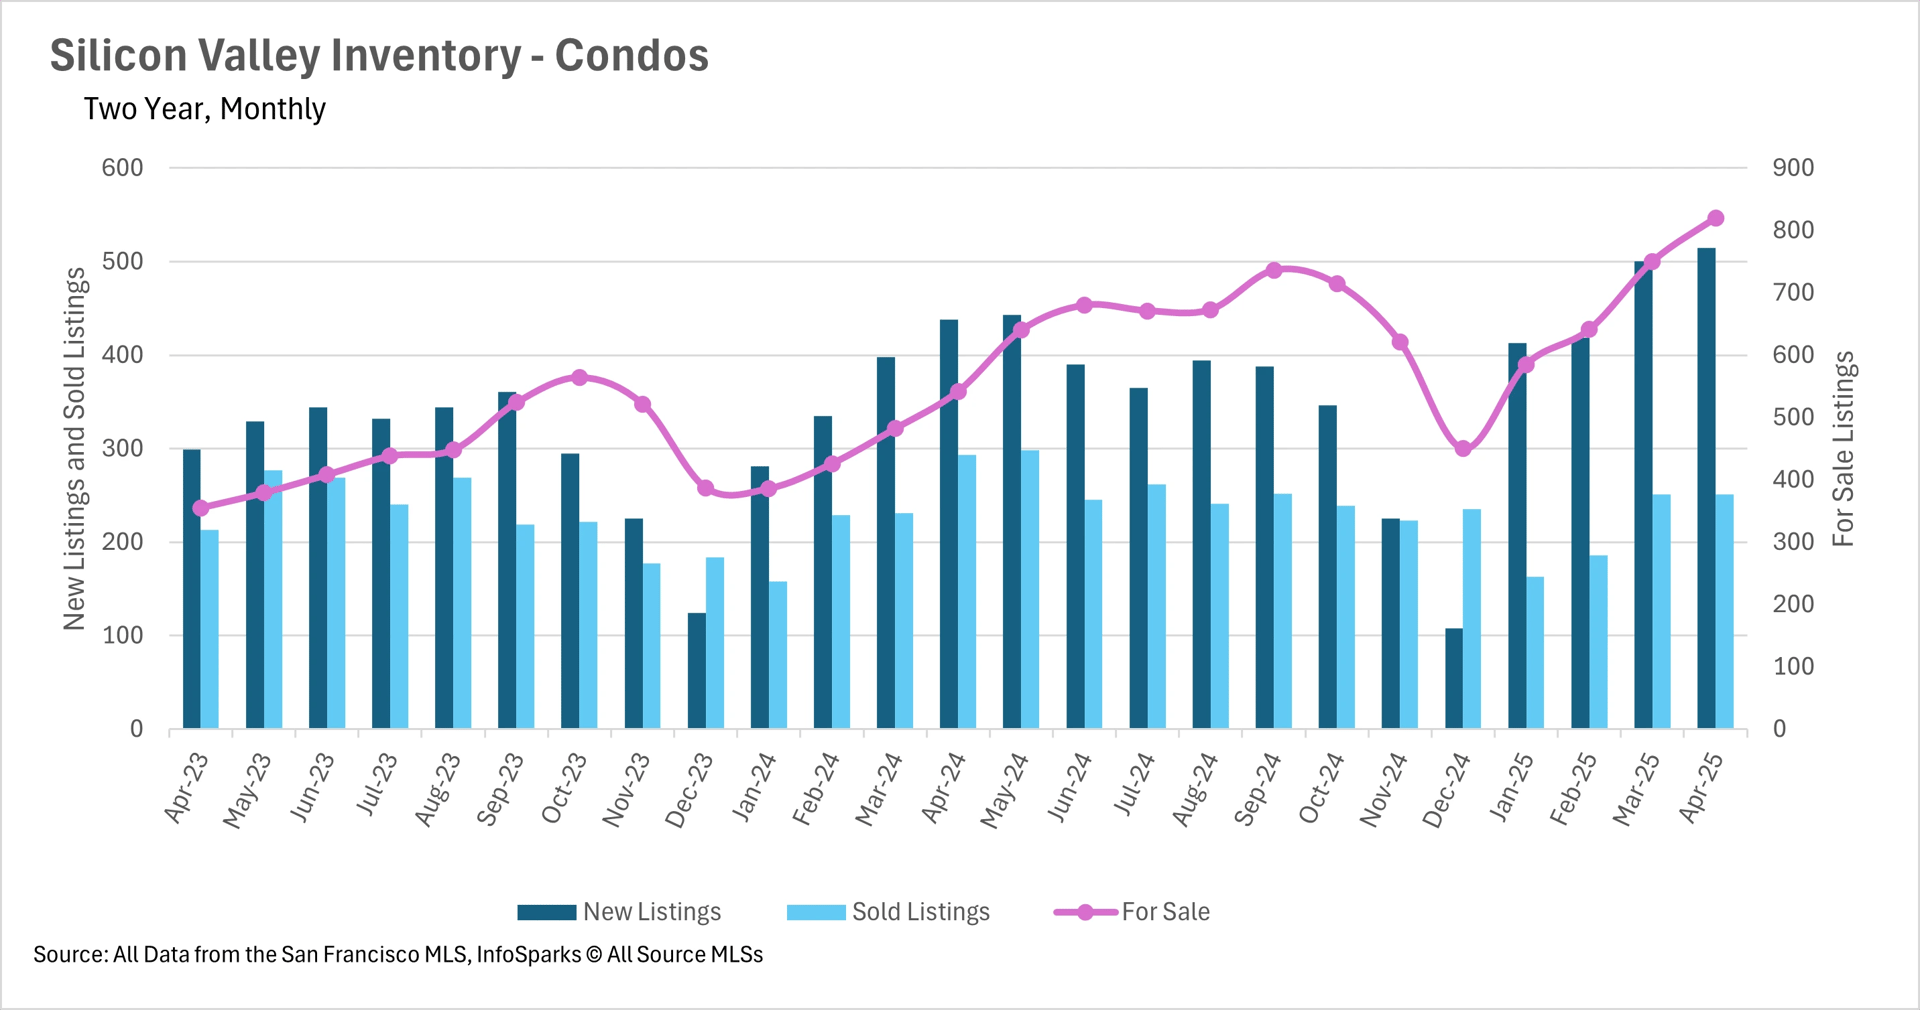
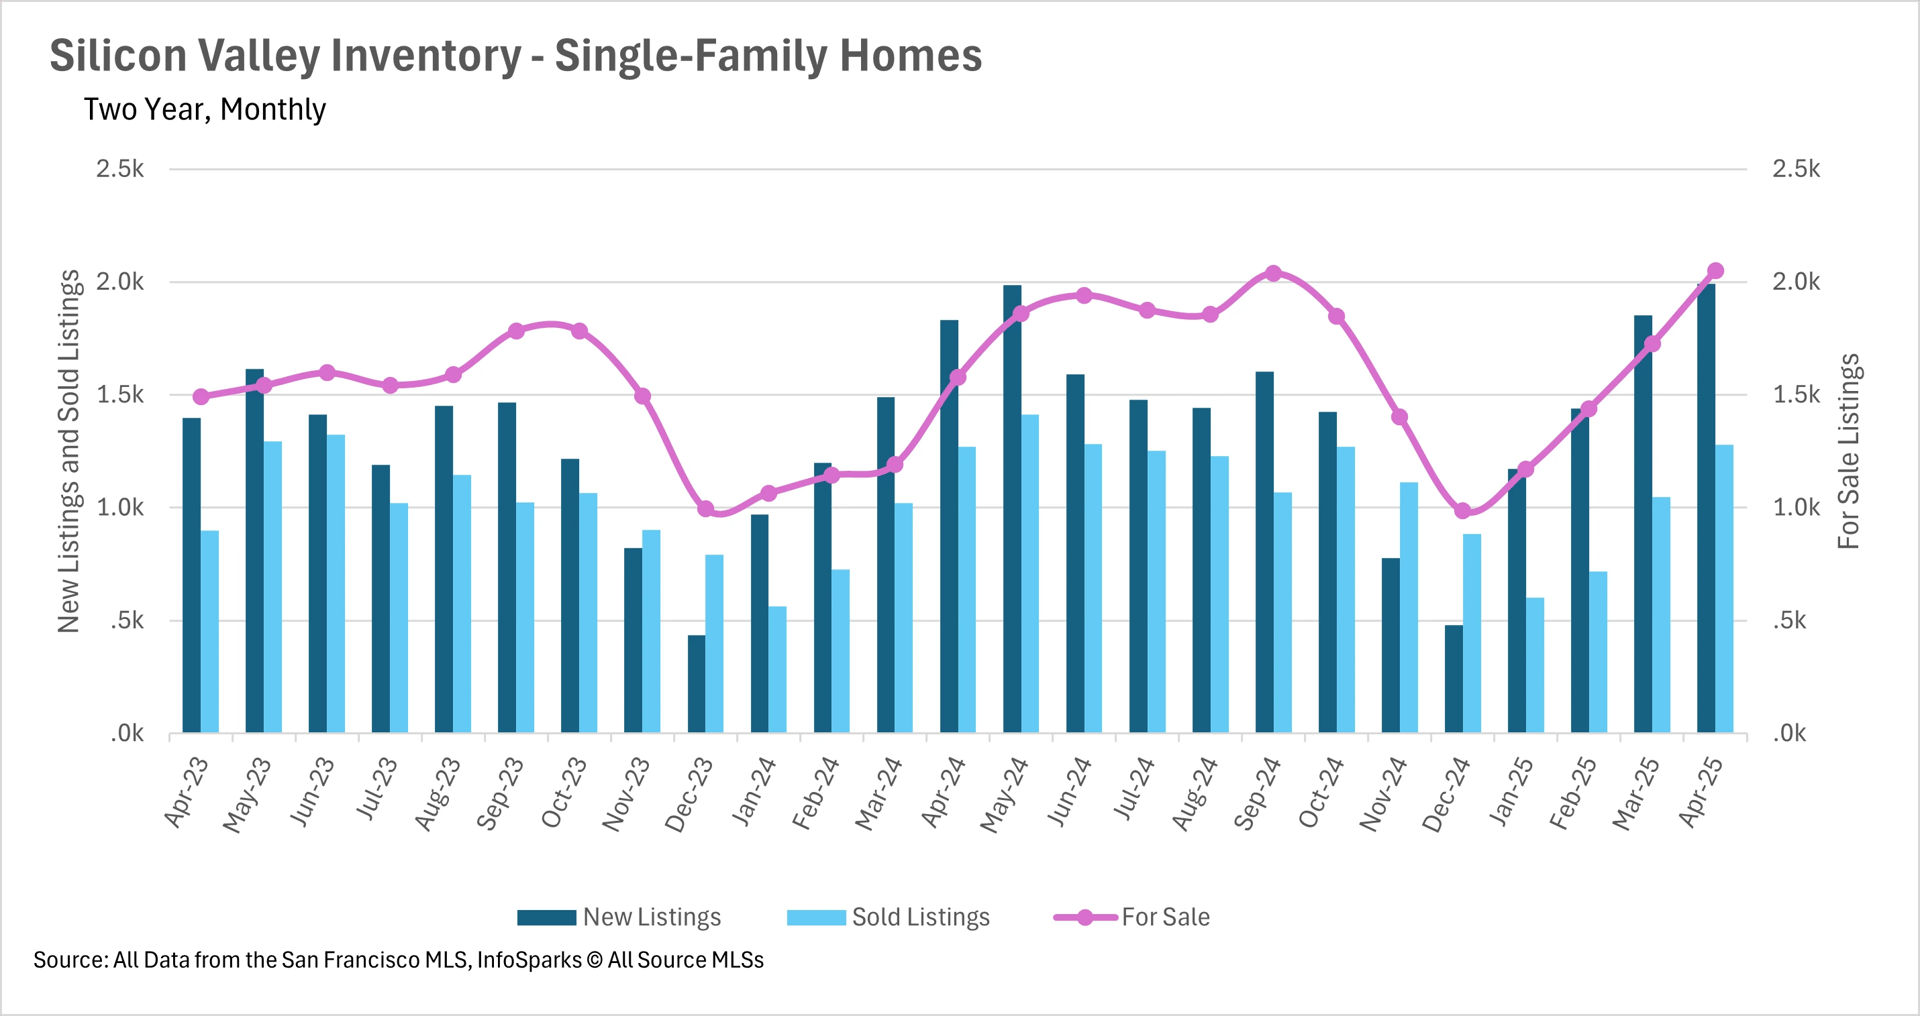
This past month, we saw inventory levels continue to grow, as growth in new supply continues to outstrip the growth in demand. In the single-family home market, we saw 8.73% more new listings than a year ago, while there were only 0.79% more closings. When you couple this with the inventory trends that we’ve seen in recent months, we have nearly 30% more inventory on the market than this time last year. Additionally, inventories are at the highest levels we’ve seen in the past two years! The same goes for the condo market, which is currently seeing a surge in new listings and a considerable drop in closed listings, resulting in a 51.29% increase in active inventory on a year-over-year basis!
Despite Inventory Issues, Listings Are Still Being Snapped Up at a Breakneck Pace!
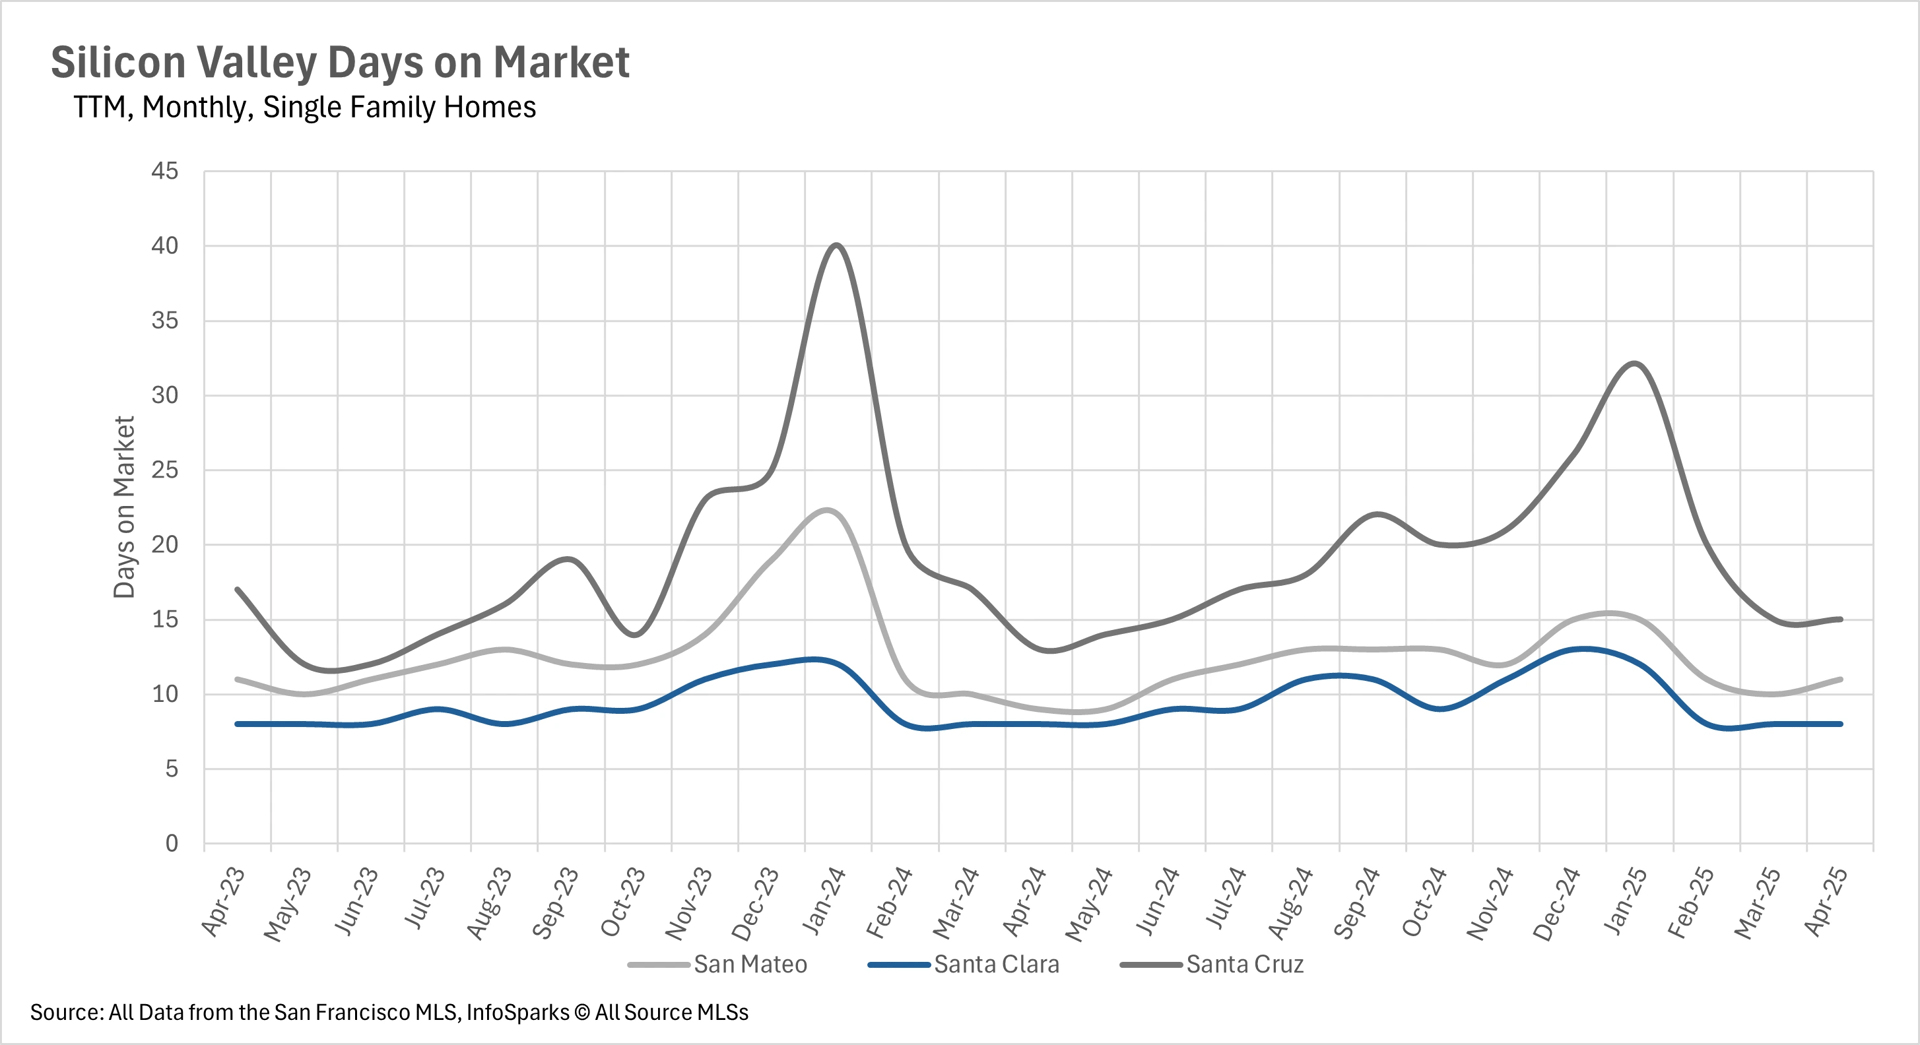
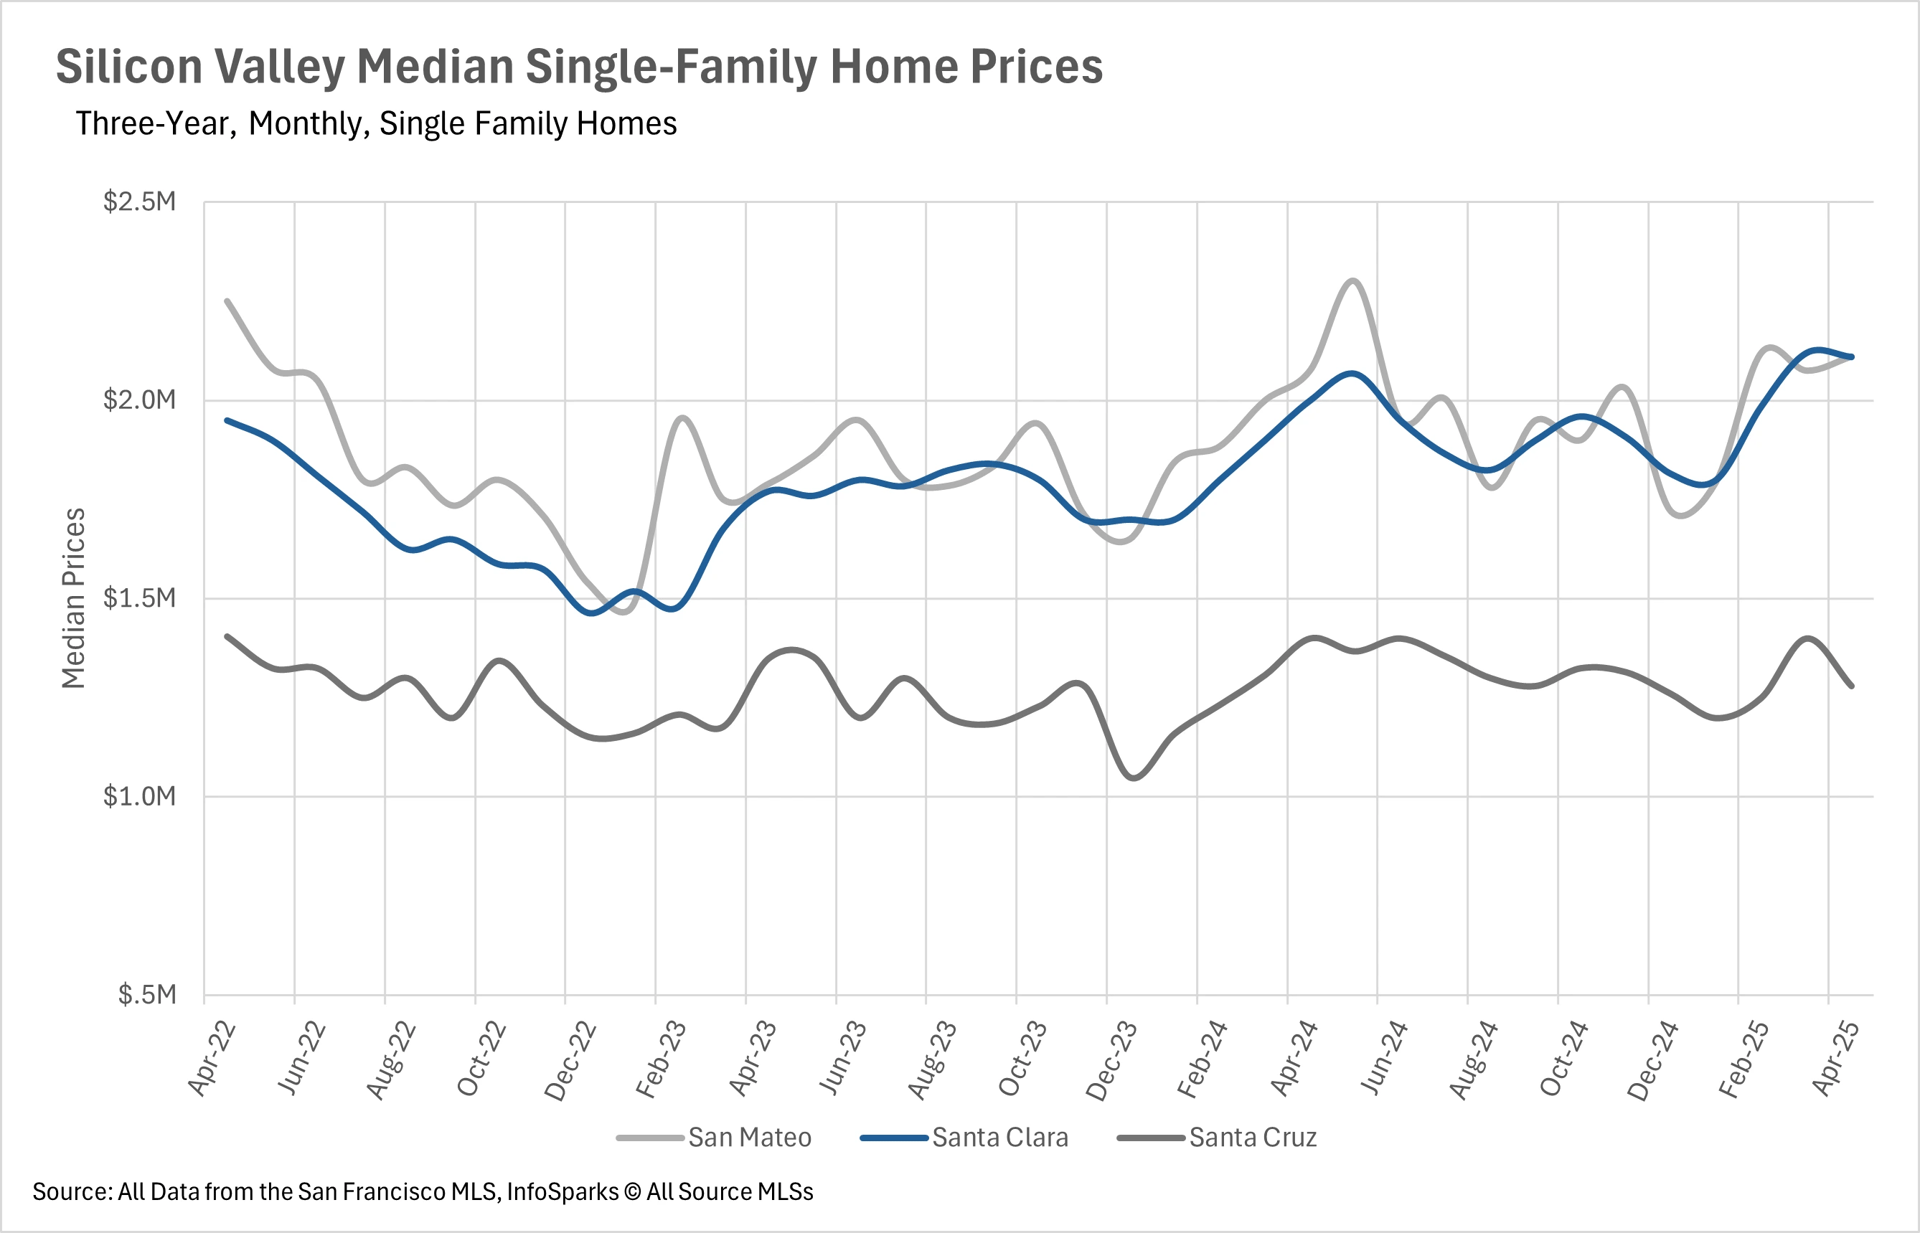
Although based on the information we just laid out, you might assume that listings are sitting on the market for a long time, that couldn’t be further from the truth. The average single-family home in Santa Clara County is only on the market for 8 days before it’s bought up! Although not quite as impressive, listings in San Mateo and Santa Cruz Counties aren’t lasting long either, as the average listing only lasts 11 and 15 days, respectively!
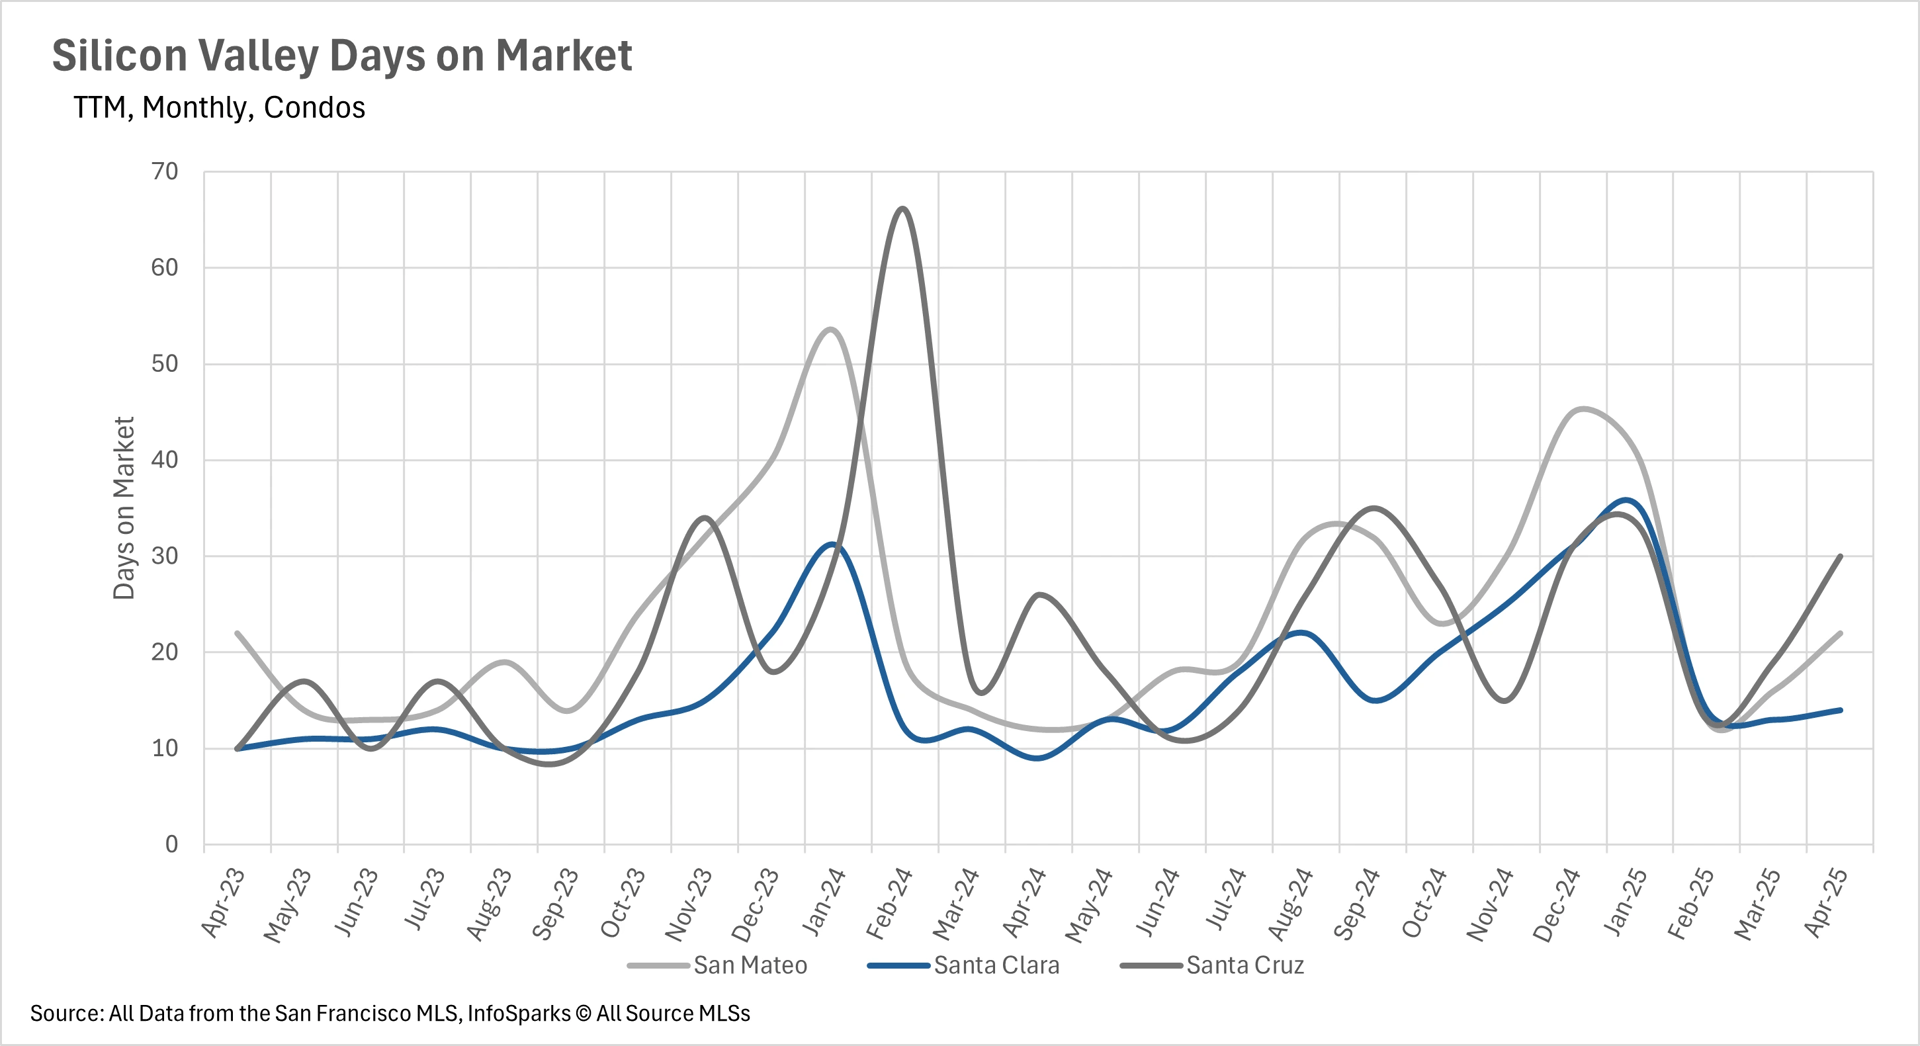
The condo market is only slightly better, with the average listing on the market for 22 days in San Mateo County, 14 days in Santa Clara, and 30 days in Santa Cruz.
Buyers vs. Sellers Markets
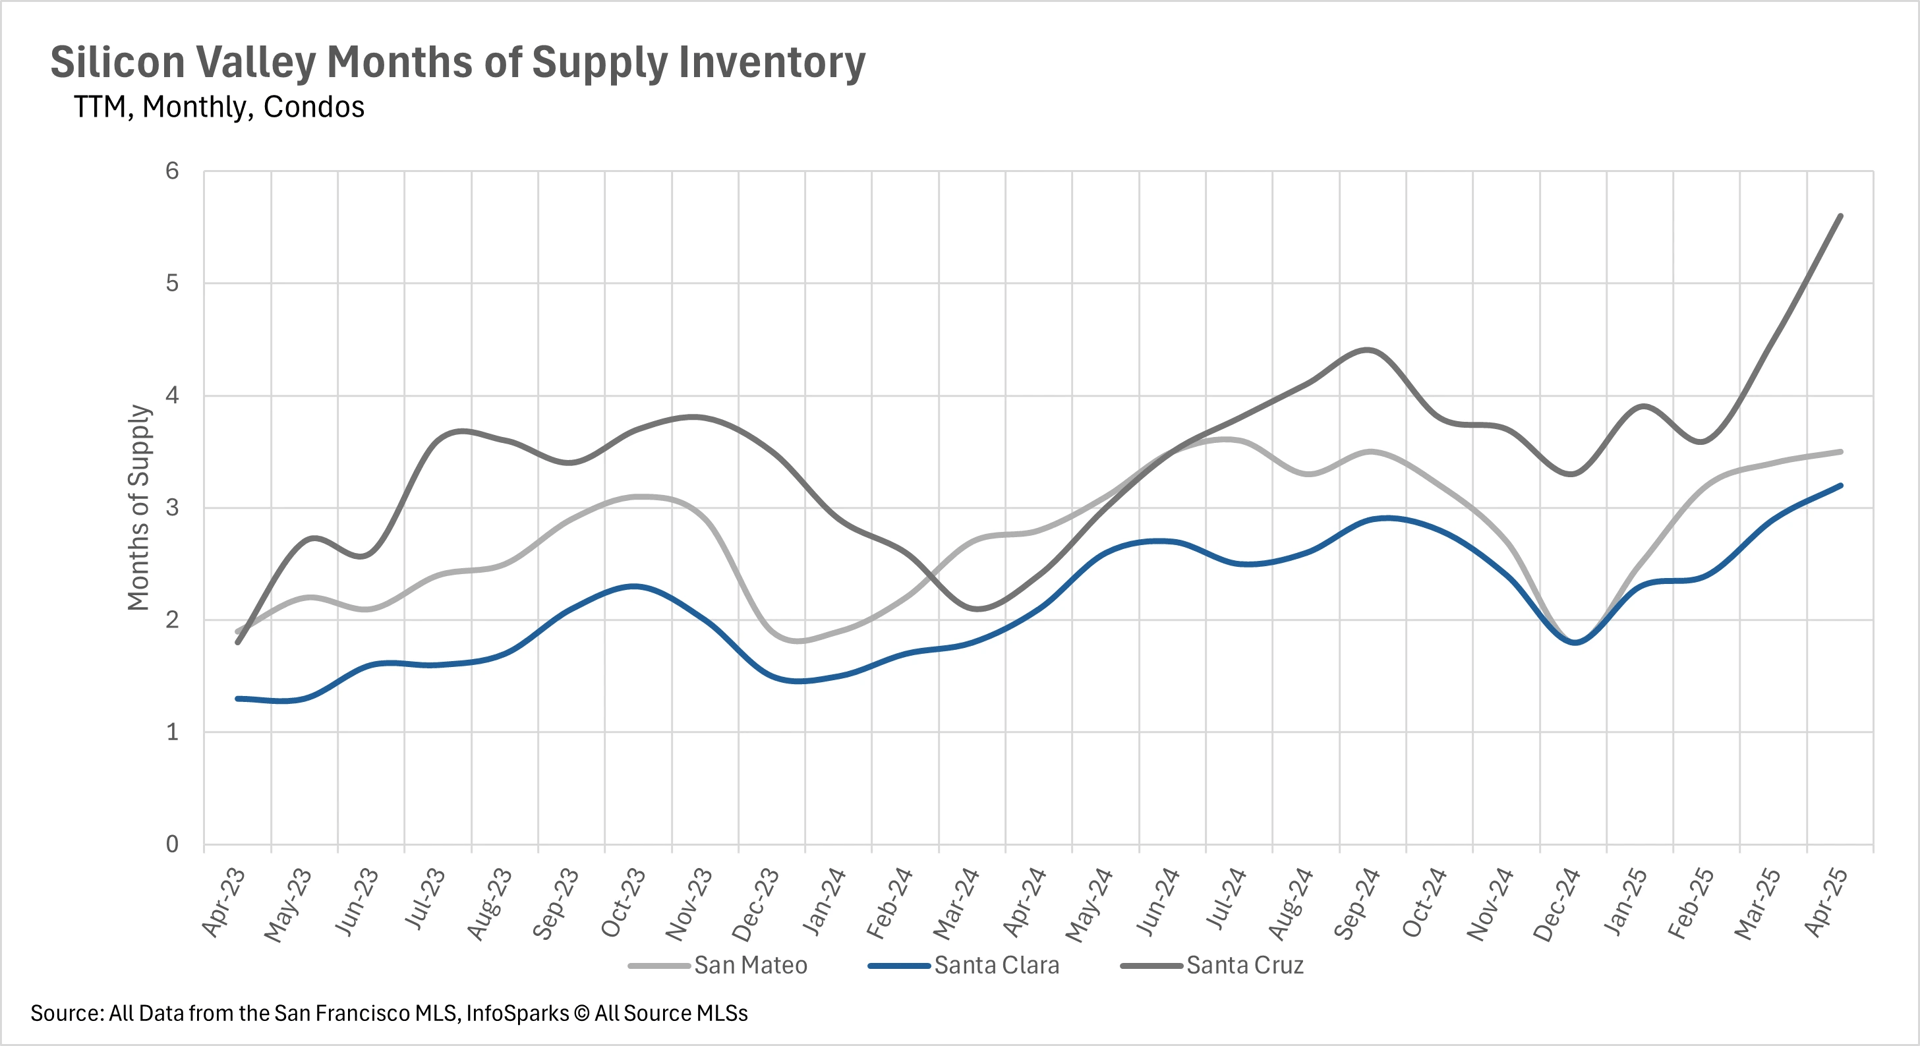
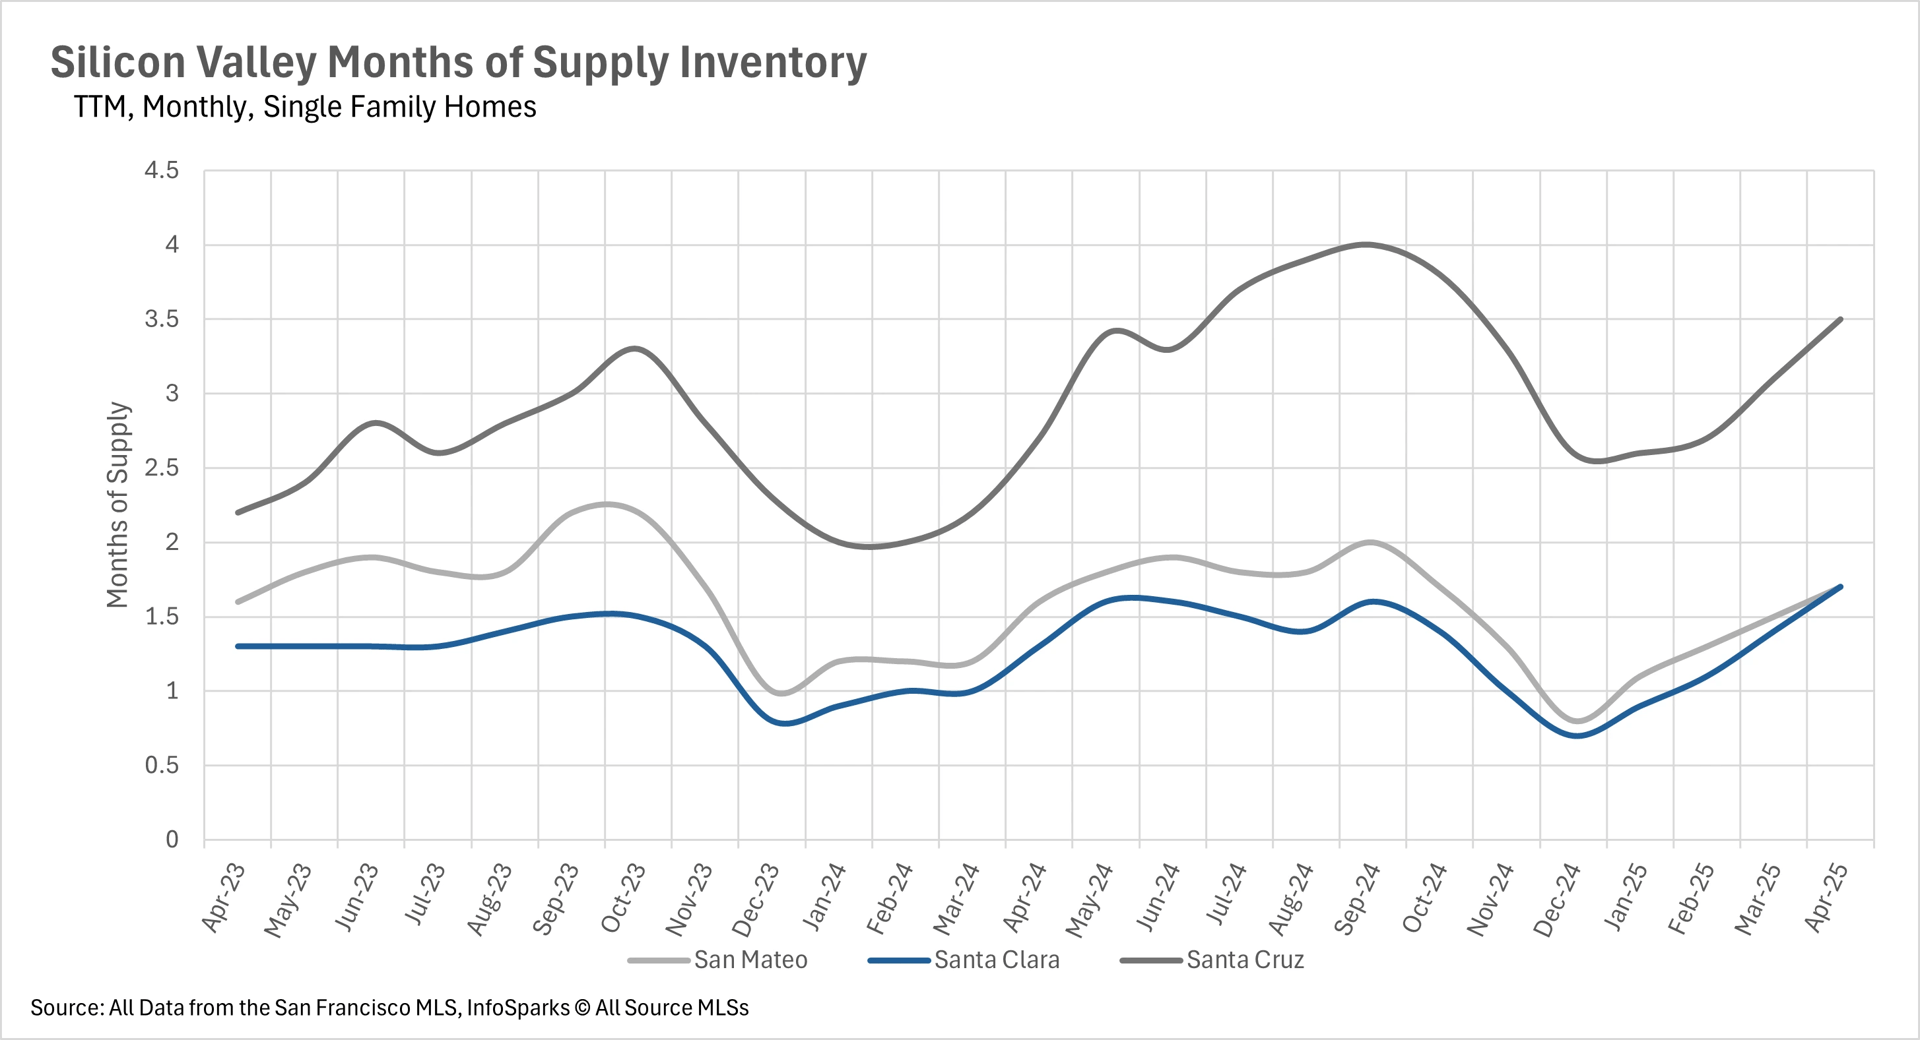
When determining whether a market is a buyers’ market or a sellers’ market, we look to the Months of Supply Inventory (MSI) metric. The state of California has historically averaged around three months of MSI, so any area with at or around three months of MSI is considered a balanced market. Any market that has lower than three months of MSI is considered a sellers’ market, whereas markets with more than three months of MSI are considered buyers’ markets.
Despite substantial increases in inventory, the single-family home market in San Mateo and Santa Clara Counties remains a seller's market, as there’s only 1.7 months of inventory on the market. However, Santa Cruz County has continued its shift toward favoring the buyers, as the number of months worth of supply has crept up to 3.5. Likewise, the condo market is a buyers' market across the board, with there being 3.2 months' worth of supply on the market in Santa Clara County, 3.5 months in San Mateo, and 5.6 months in Santa Cruz.