The Local Lowdown
Quick Take
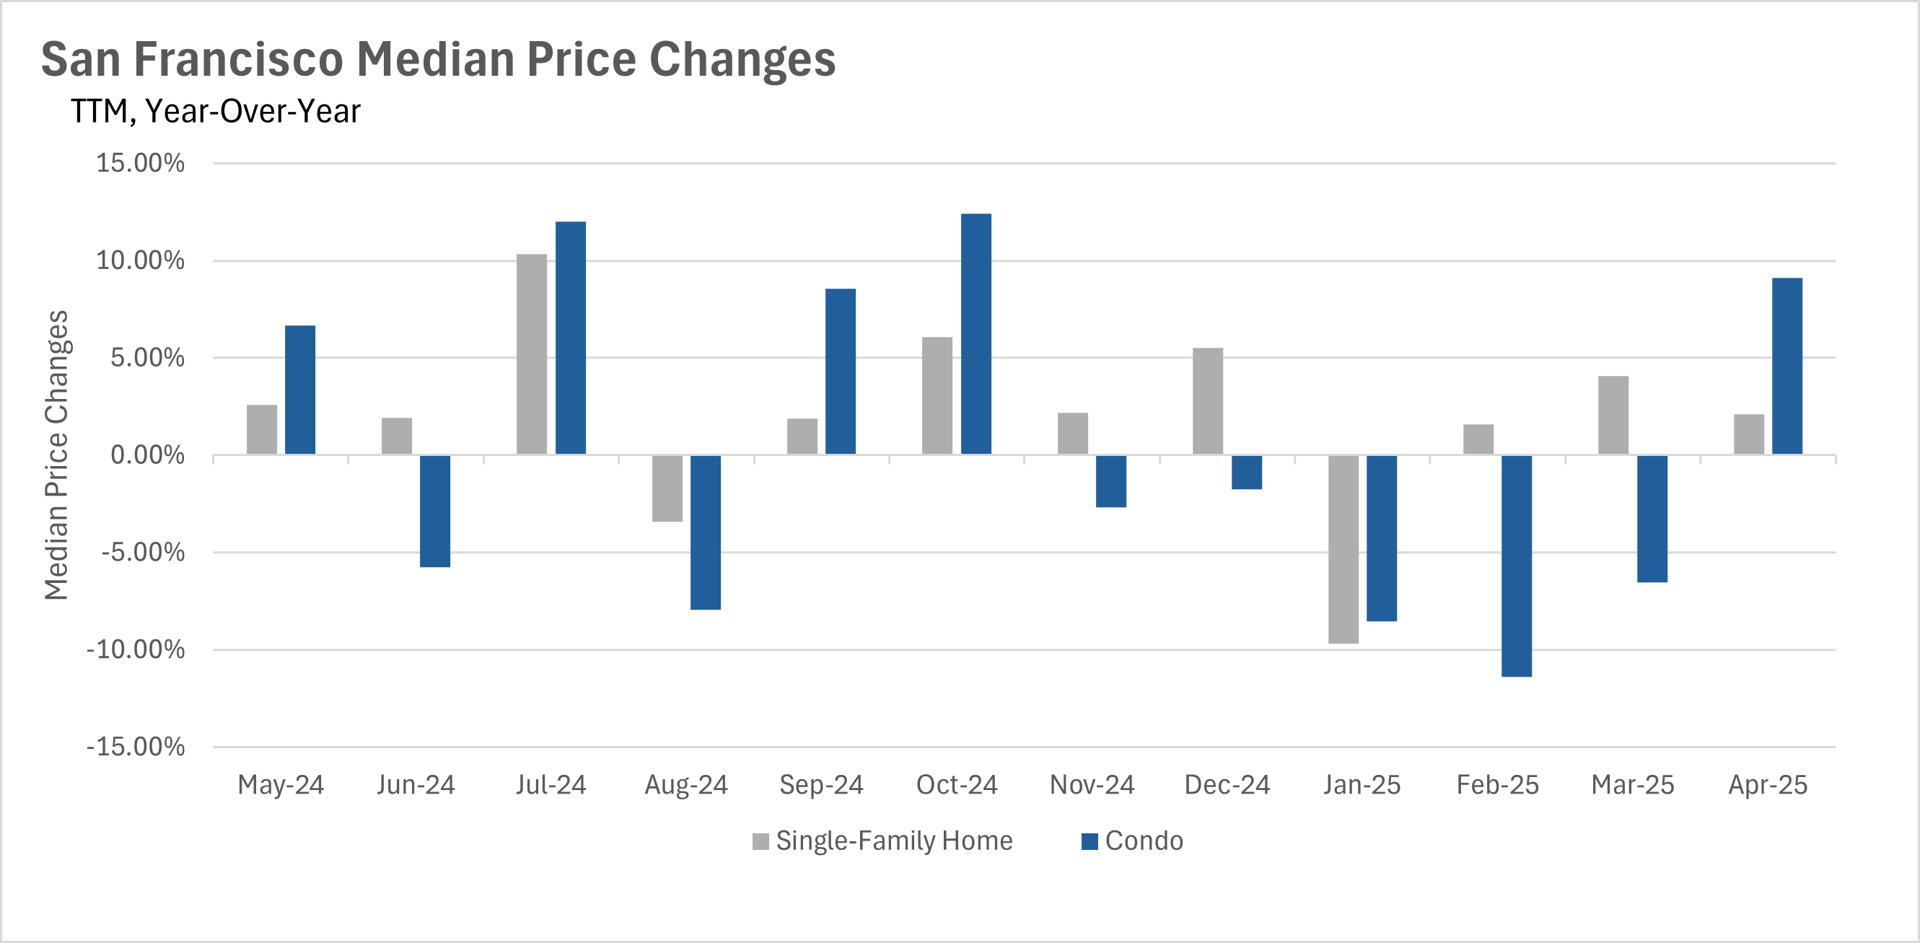
- The median condo sale price in San Francisco is rebounding, up 9.13% year-over-year in April 2025 after months of declines.
- Inventory remains tight, with single-family home listings down 6.29% and condo listings down 7.52% from last year.
- No discounts here: Single-family homes sell for 14.2% above asking price on average, while condos fetch 0.4% above list price.
Note: Charts and graphs for this report are available at the end of this section.
*National Association of REALTORS® data is released two months behind, so we estimate the most recent month's data when possible and appropriate.
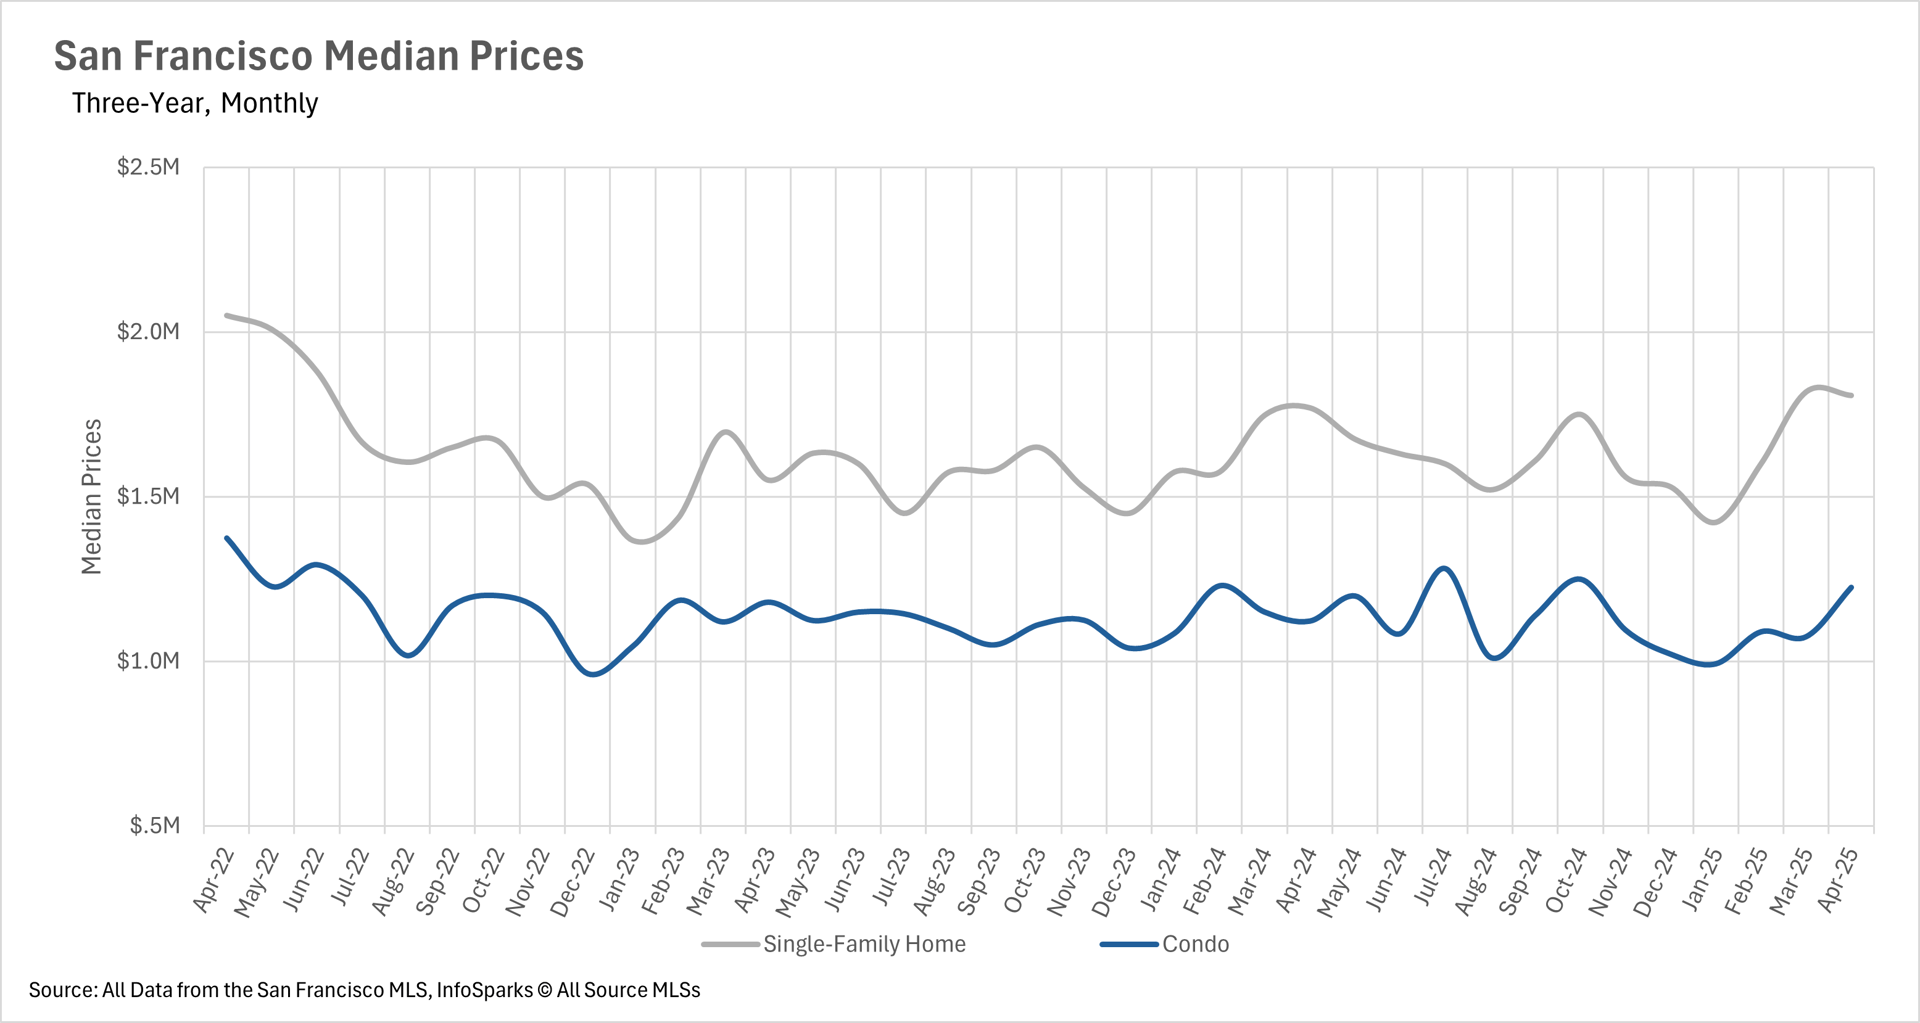
Condo Prices Rebound, Single-Family Homes Stay Steady
After five months of year-over-year declines, San Francisco condo prices are rebounding. In April 2025, the median condo sale price surged 9.13% compared to April 2024, signaling a potential turning point for the condo market. This growth makes condos an attractive option for buyers seeking urban living in neighborhoods like South Beach or Mission Bay.
Meanwhile, single-family home prices in San Francisco grew steadily, with a 2.12% year-over-year increase in April 2025. This consistent growth reflects sustained demand for family-friendly homes in areas like Noe Valley and Sunset. Curious about your property’s value in this market? Use our home valuation tool for a personalized estimate.
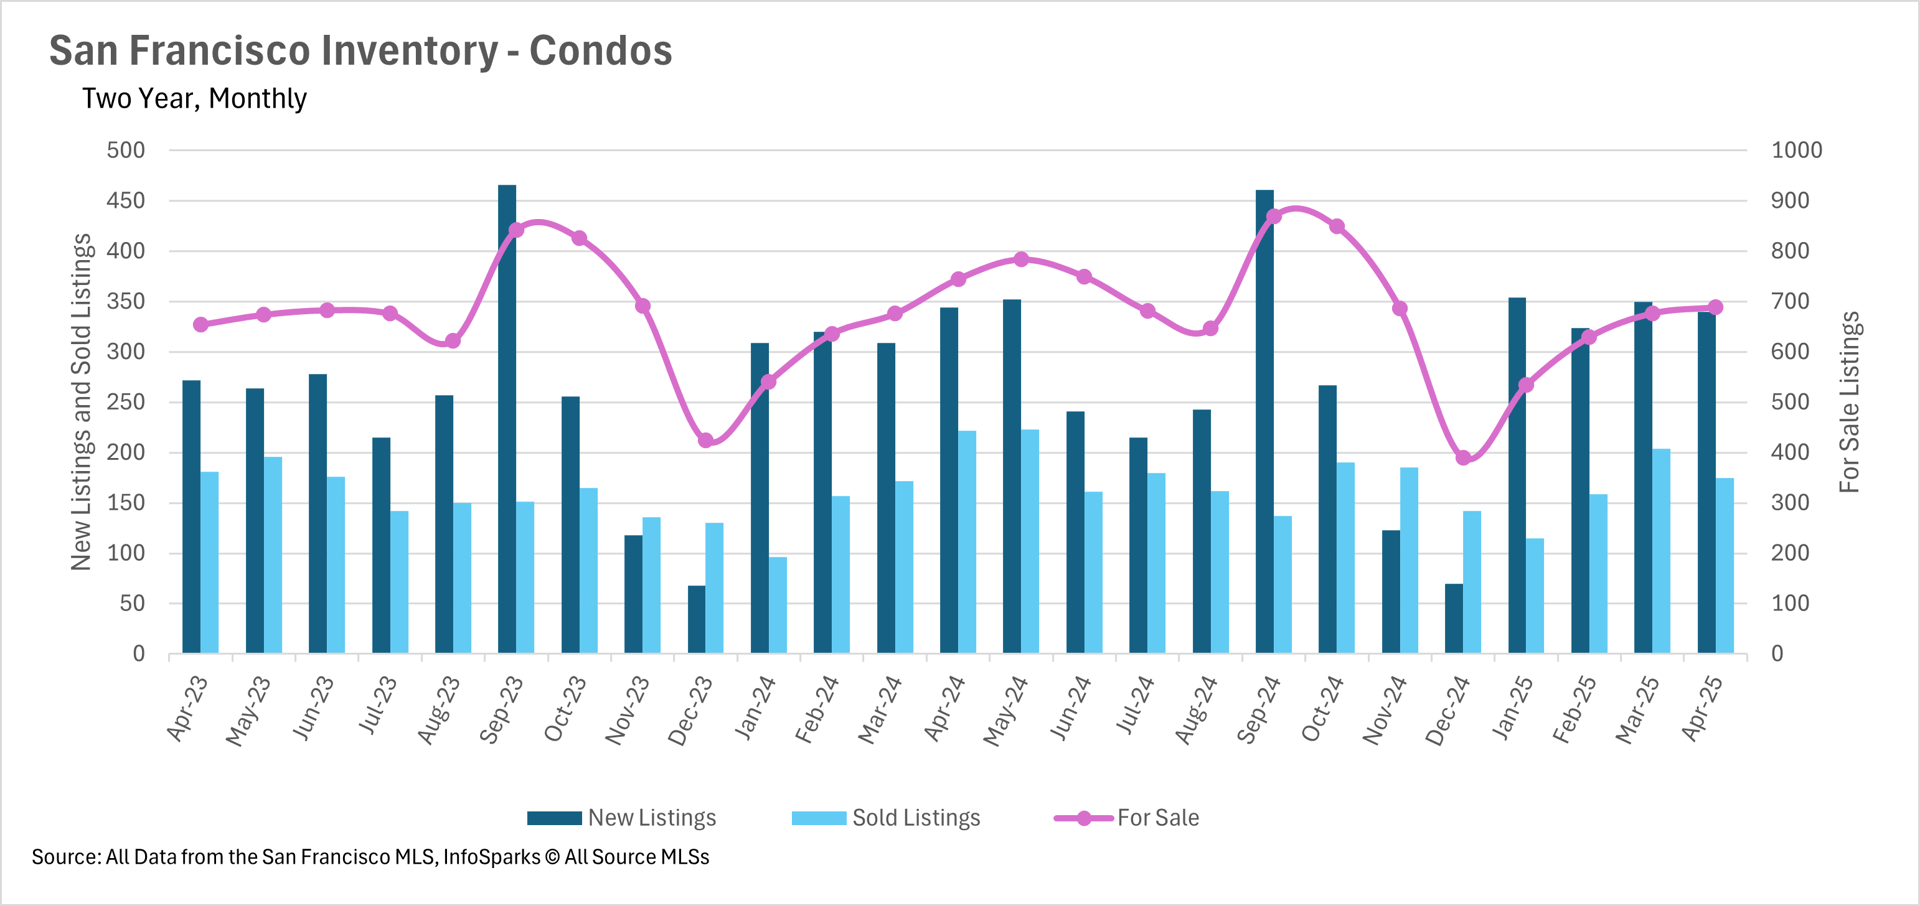
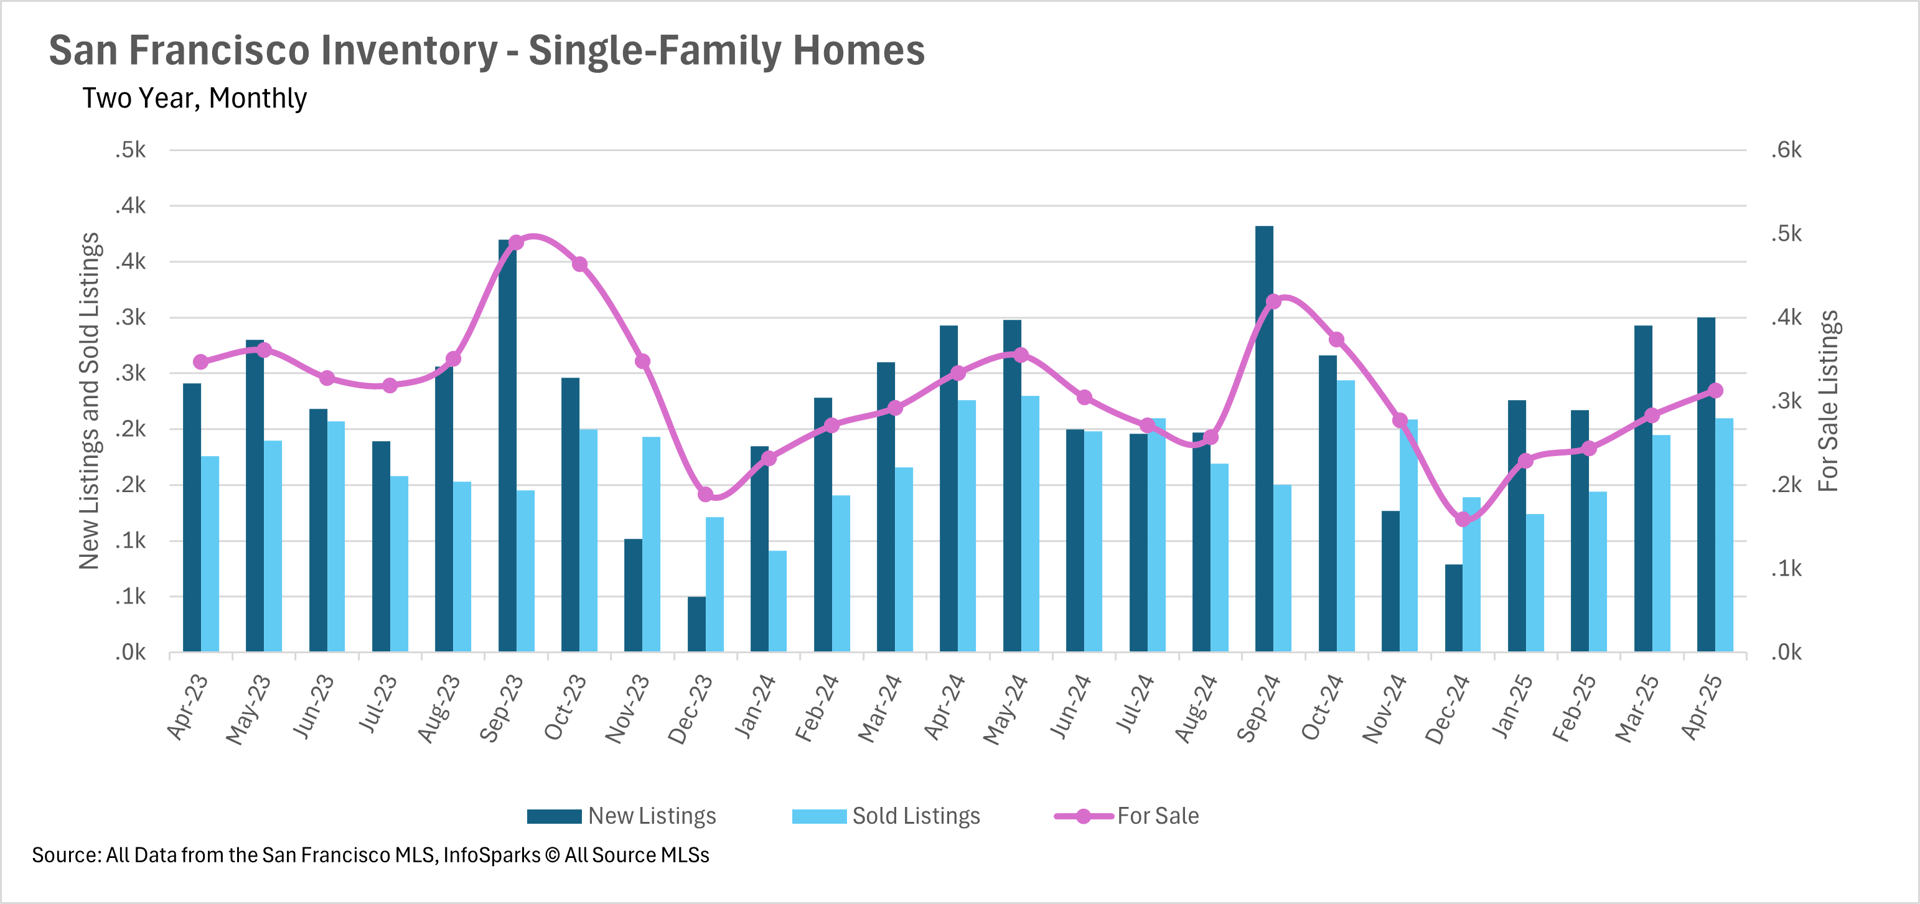
Persistent Inventory Challenges in San Francisco
Low inventory remains a hallmark of the San Francisco real estate market. In April 2025, single-family home listings dropped 6.29% year-over-year, while condo listings fell 7.52%. The condo market also saw a significant 21.17% decrease in sales volume compared to last year, one of the sharpest declines in recent months. These trends underscore the ongoing supply constraints shaping the SF housing market.
For buyers navigating this competitive landscape, preparation is key. Explore our buyer resources for strategies to succeed in a low-inventory market.
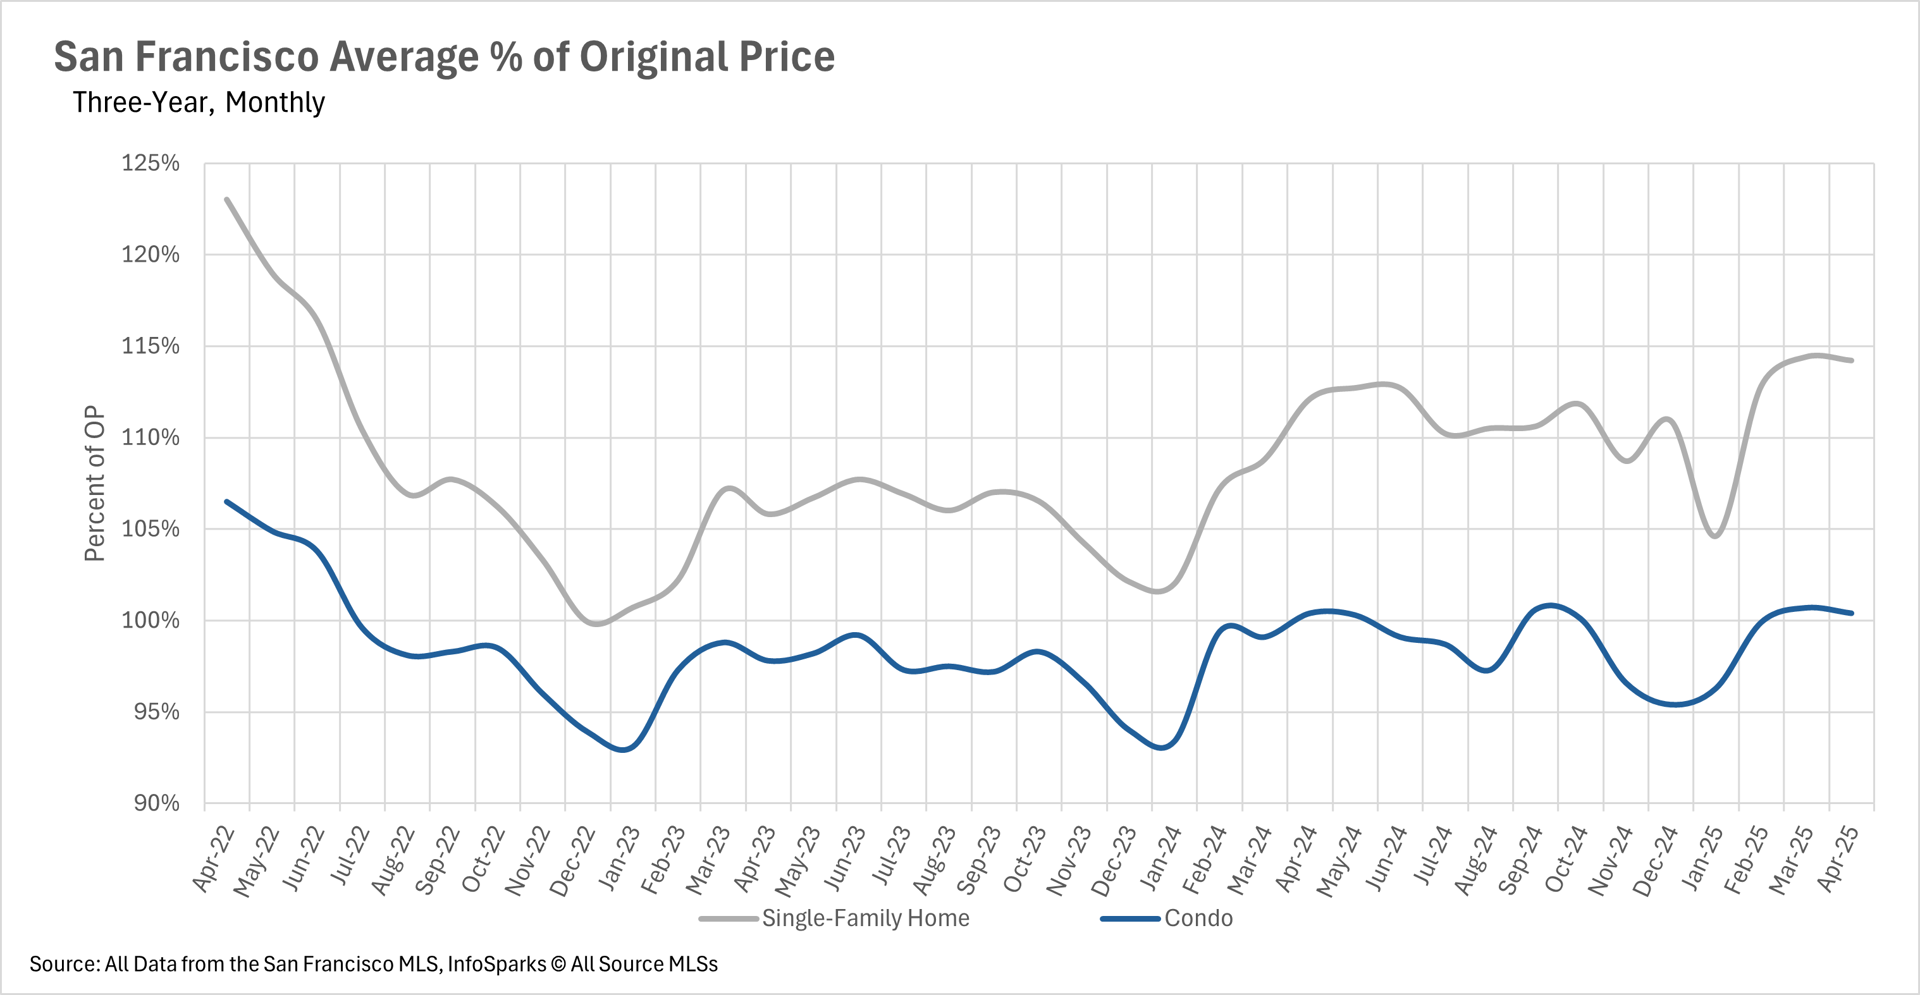
Homes Still Selling Above Asking Price
Discounts are hard to come by in the San Francisco housing market. Single-family homes are selling for 14.2% above the original asking price on average, reflecting fierce competition in neighborhoods like Parkside and Golden Gate Heights. In contrast, the condo market is less heated, with listings selling for just 0.4% above asking price, offering buyers a slightly better chance at securing a deal.
Sellers looking to capitalize on these trends can find expert guidance on our seller resources page.
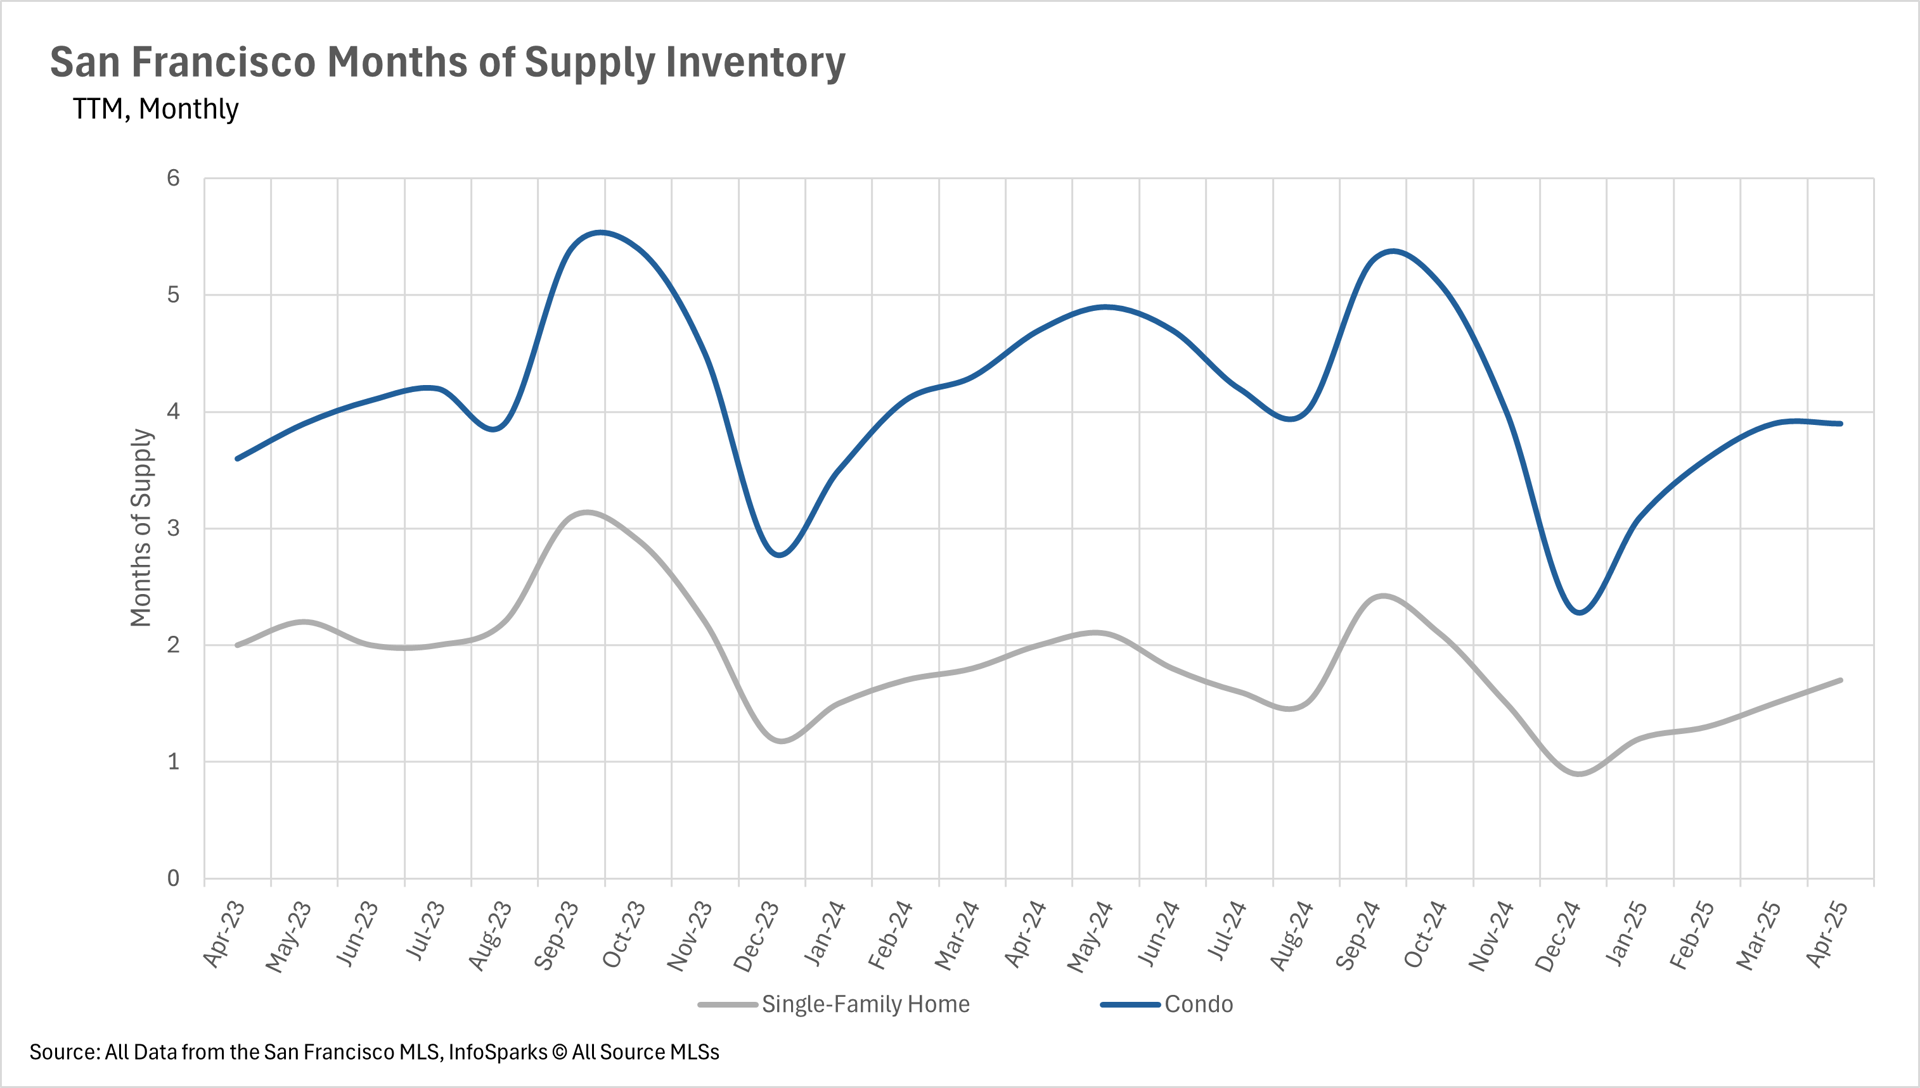
Buyers’ vs. Sellers’ Market: A Tale of Two Segments
The Months of Supply Inventory (MSI) metric determines whether a market favors buyers or sellers. In California, an MSI of around three months indicates a balanced market, while below three months signals a sellers’ market, and above three months suggests a buyers’ market.
- Single-Family Homes: With only 1.7 months of supply, the single-family home market remains a sellers’ market, driven by low inventory and high demand.
- Condos: With 3.9 months of supply, the condo market leans toward a buyers’ market, offering more options for buyers seeking urban properties.
These dynamics highlight the importance of tailored strategies for each market segment.
What’s Next for the San Francisco Housing Market?
The San Francisco real estate trends for 2025 suggest continued inventory challenges and selective price growth. The condo market’s recent rebound offers opportunities for buyers, while single-family homes remain a hot commodity for sellers. As economic factors like mortgage rates (down to 6.63% for a 30-year fixed loan in March 2025) and local housing policies evolve, staying agile is crucial.
Whether you’re buying, selling, or investing in the San Francisco housing market, our real estate team is here to help. Visit our market updates page for ongoing updates or use our home valuation tool to assess your property’s potential.