The Local Lowdown
Quick Take:
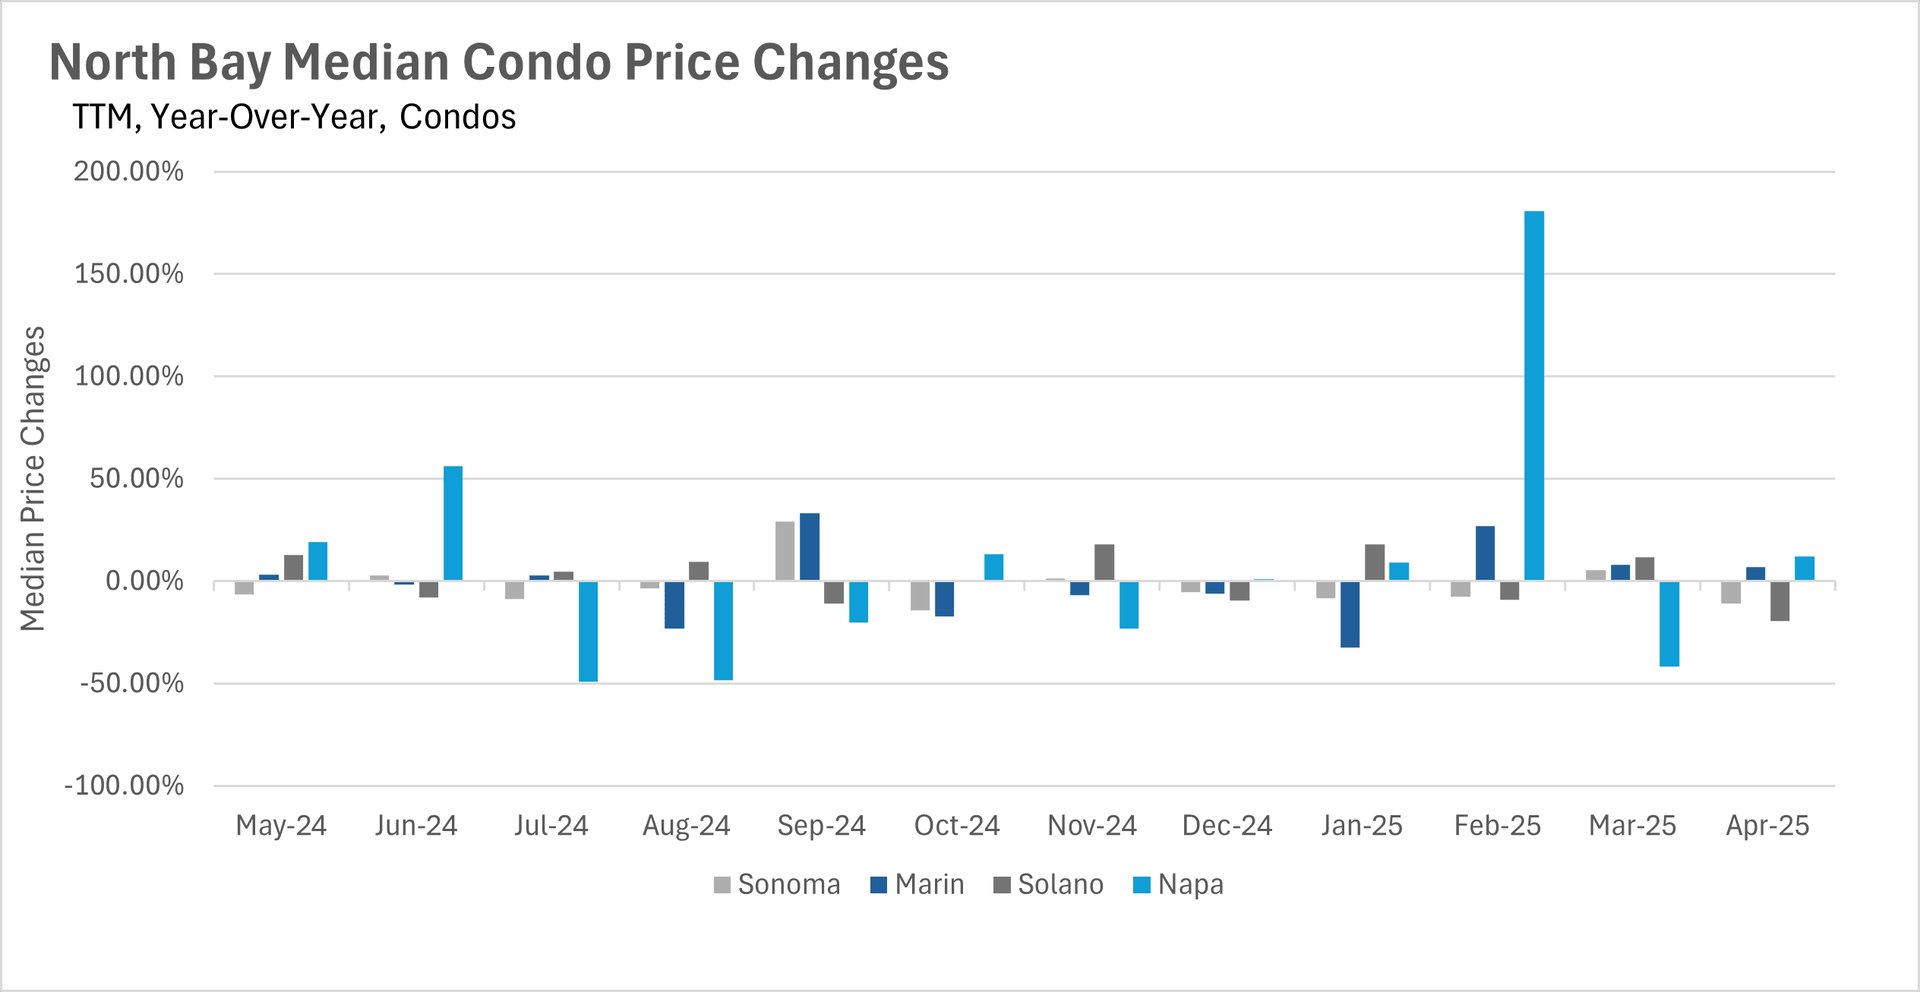
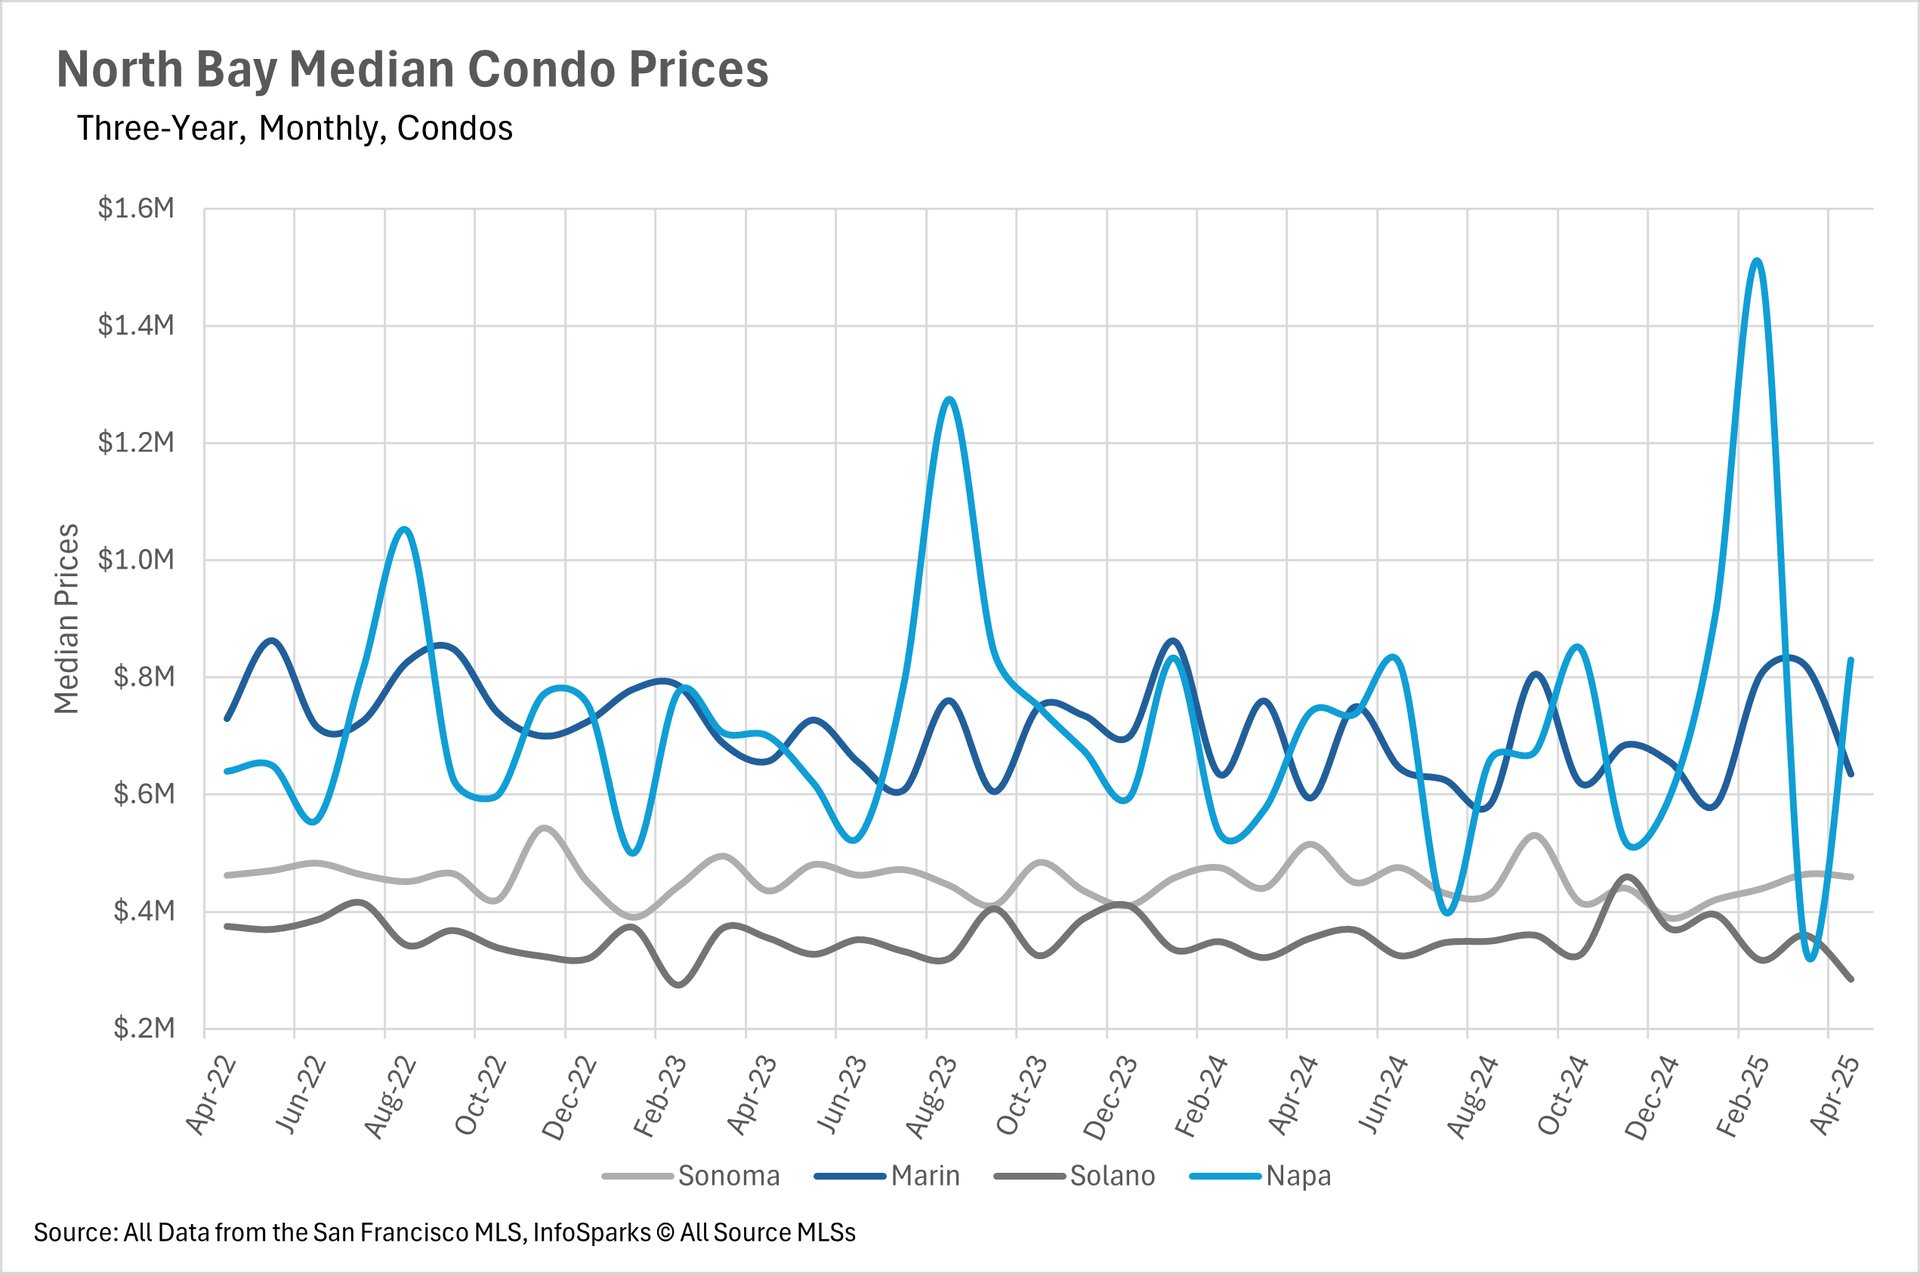
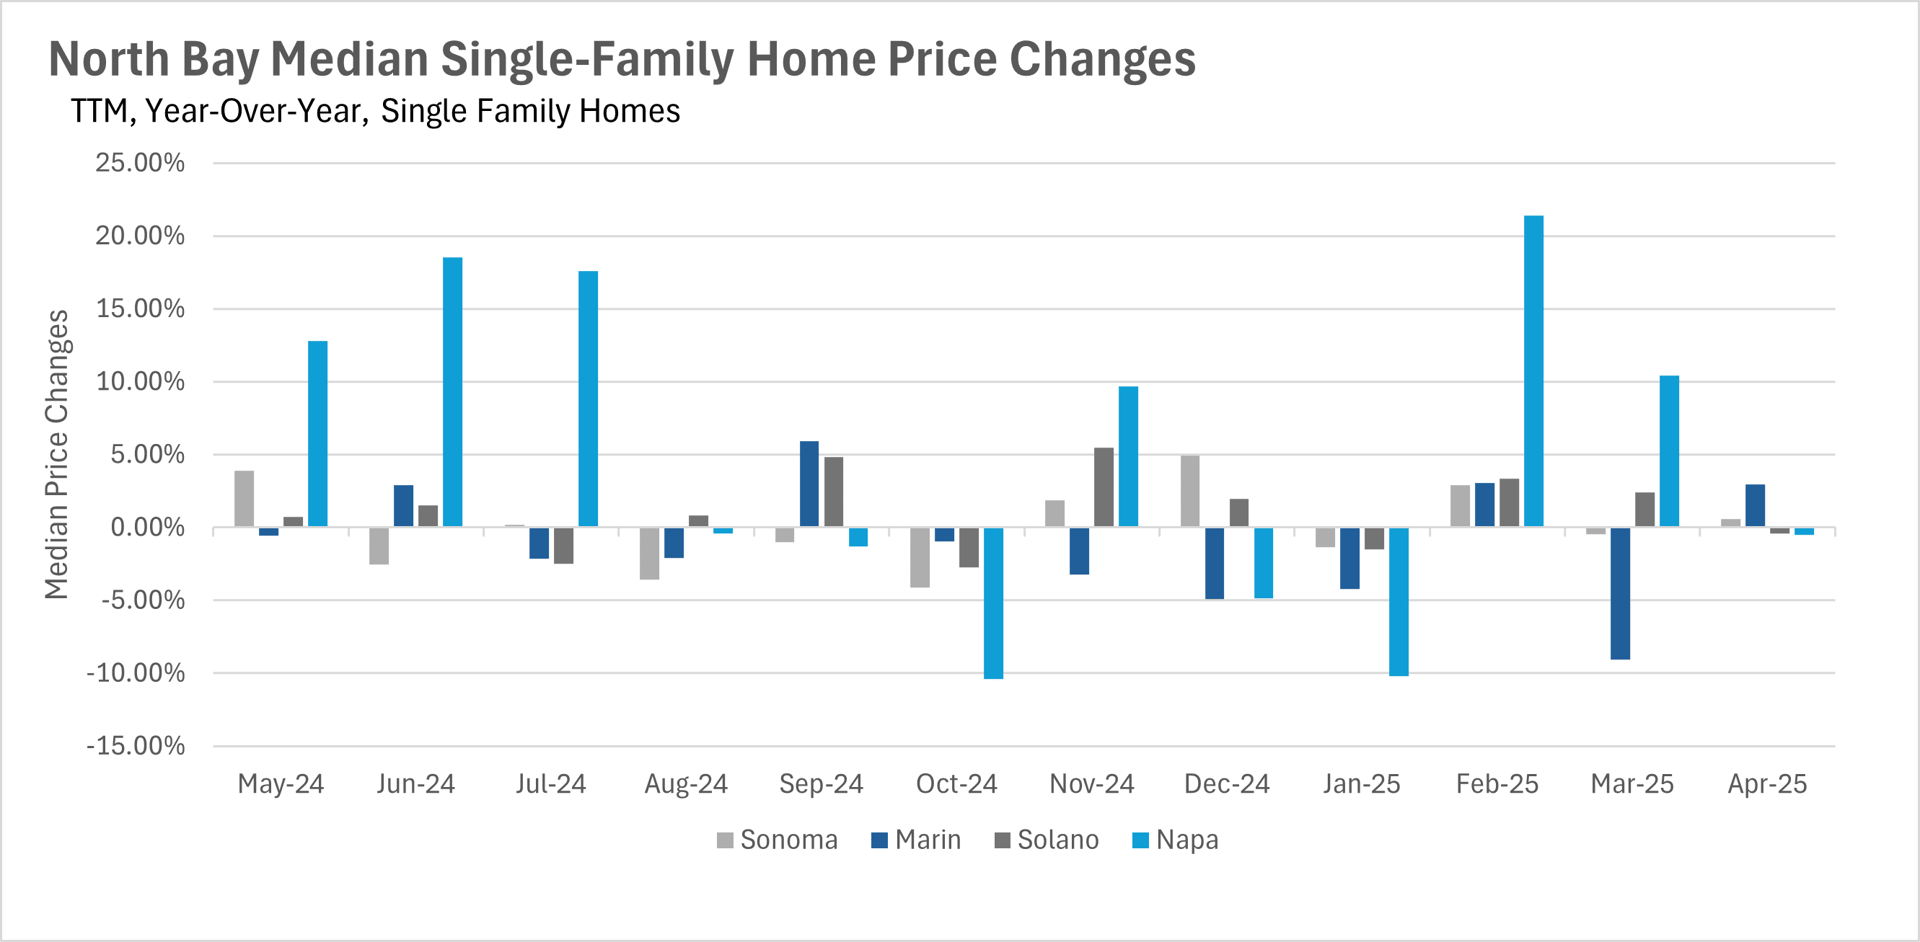
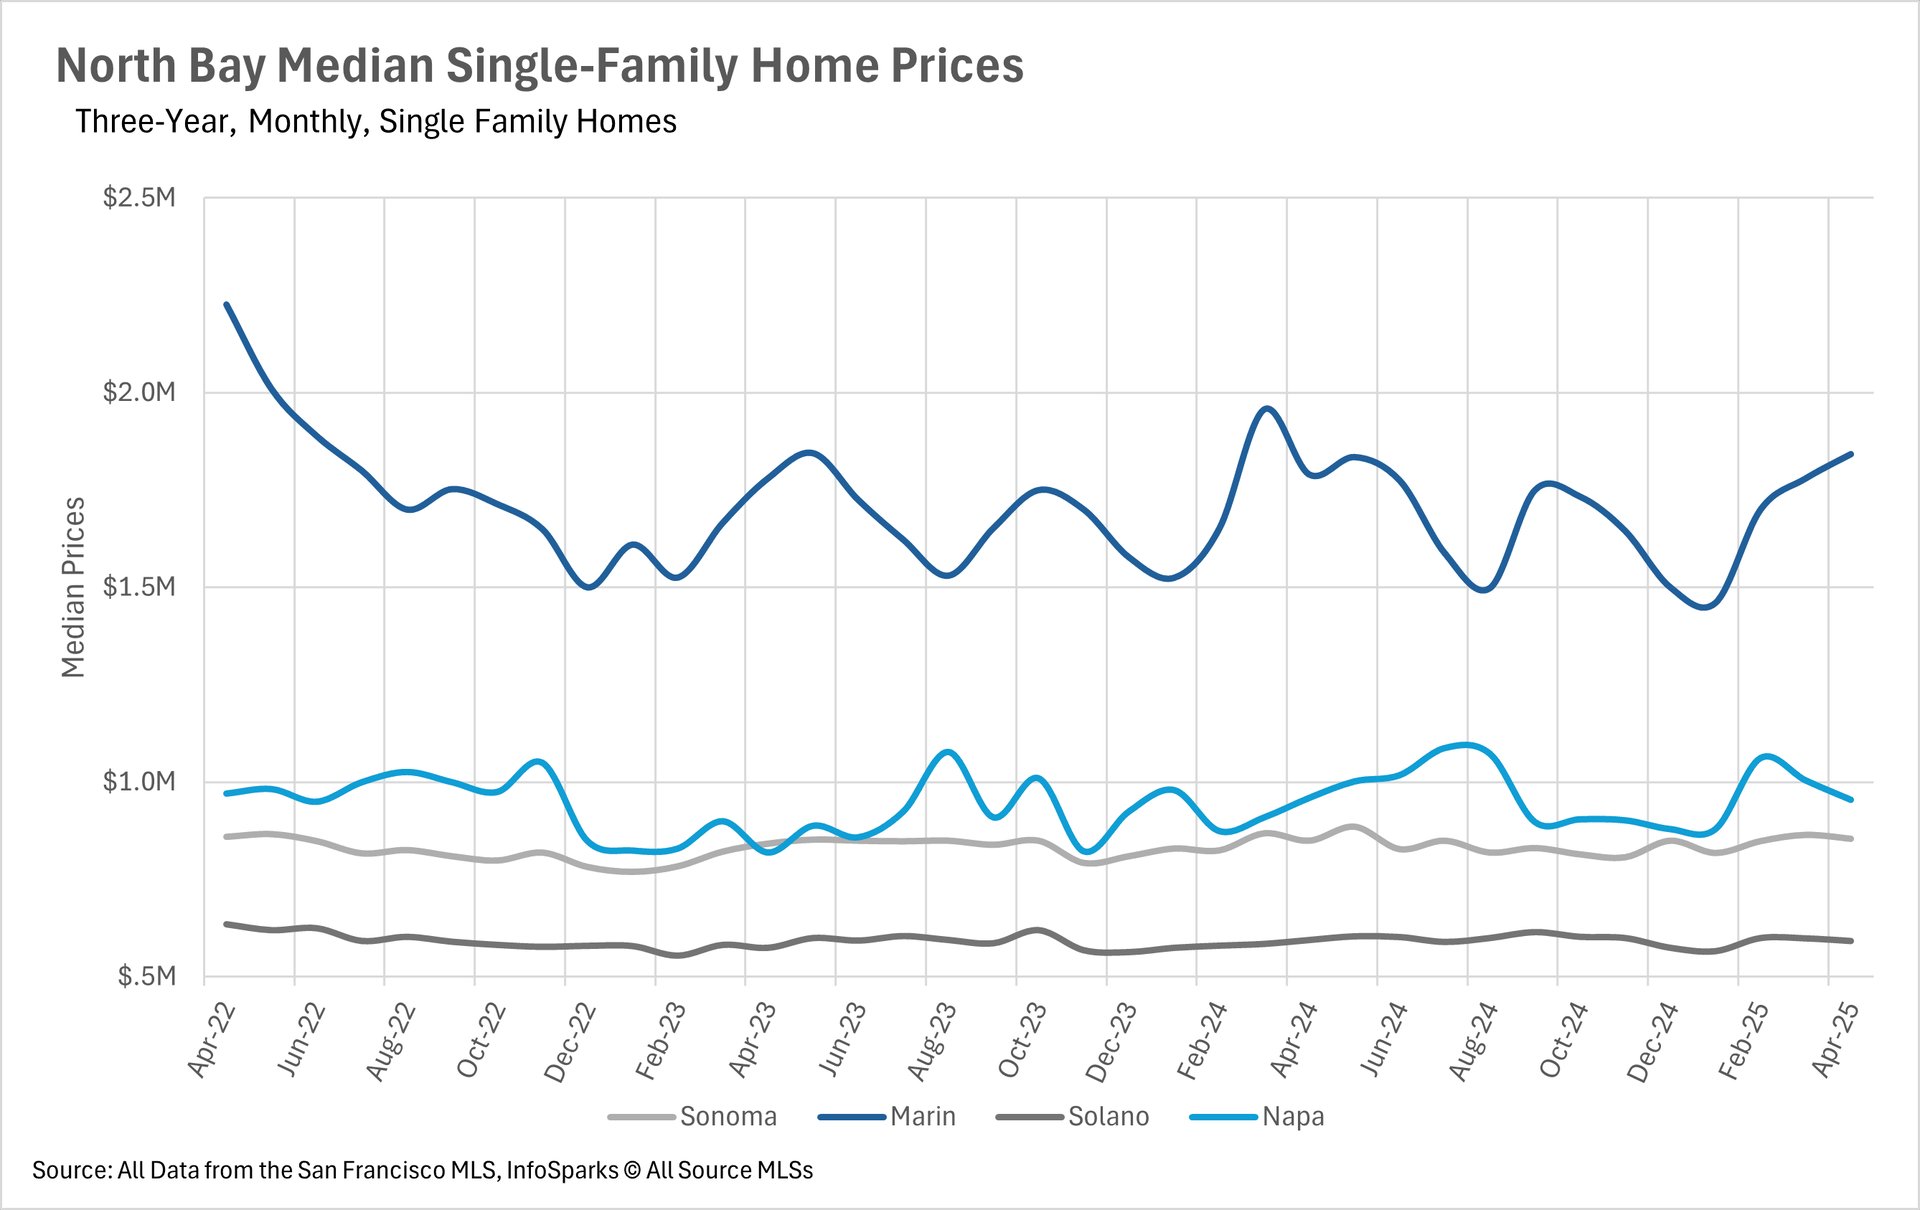
- Median sale prices have remained roughly flat on a year-over-year basis in the North Bay in the month of April.
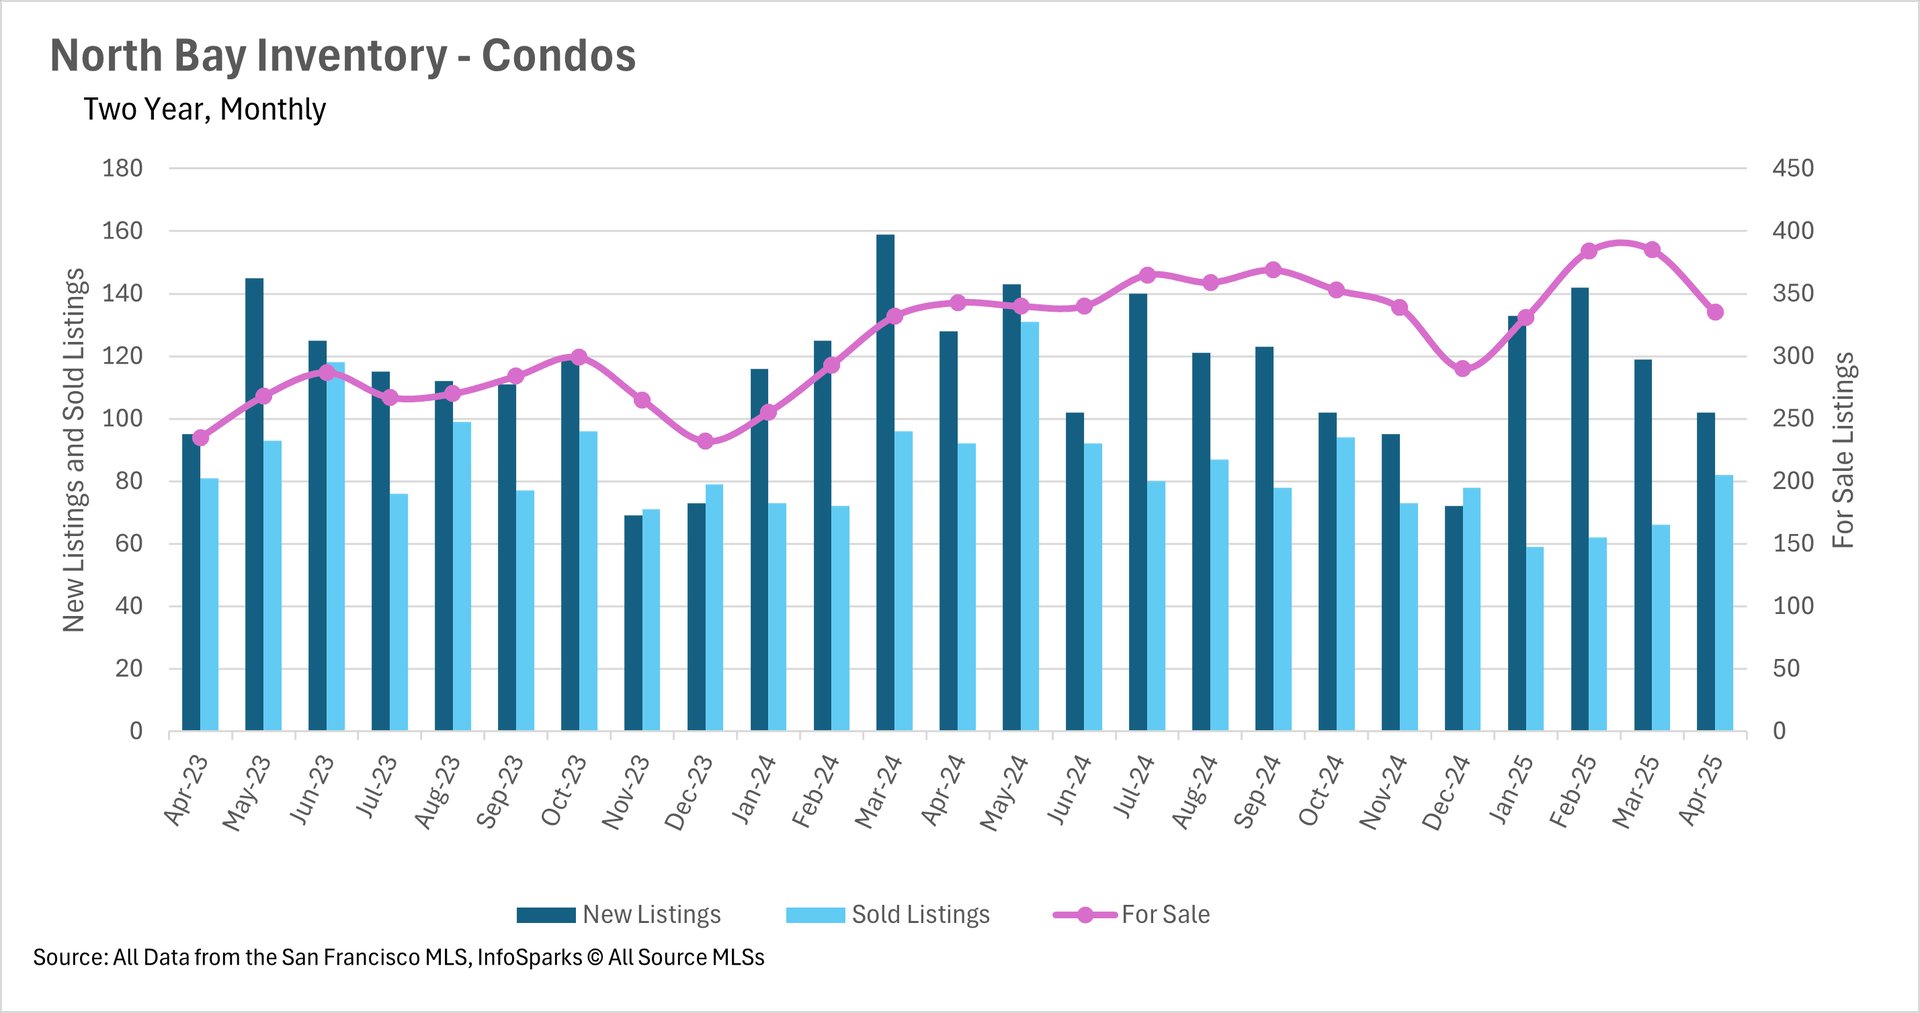
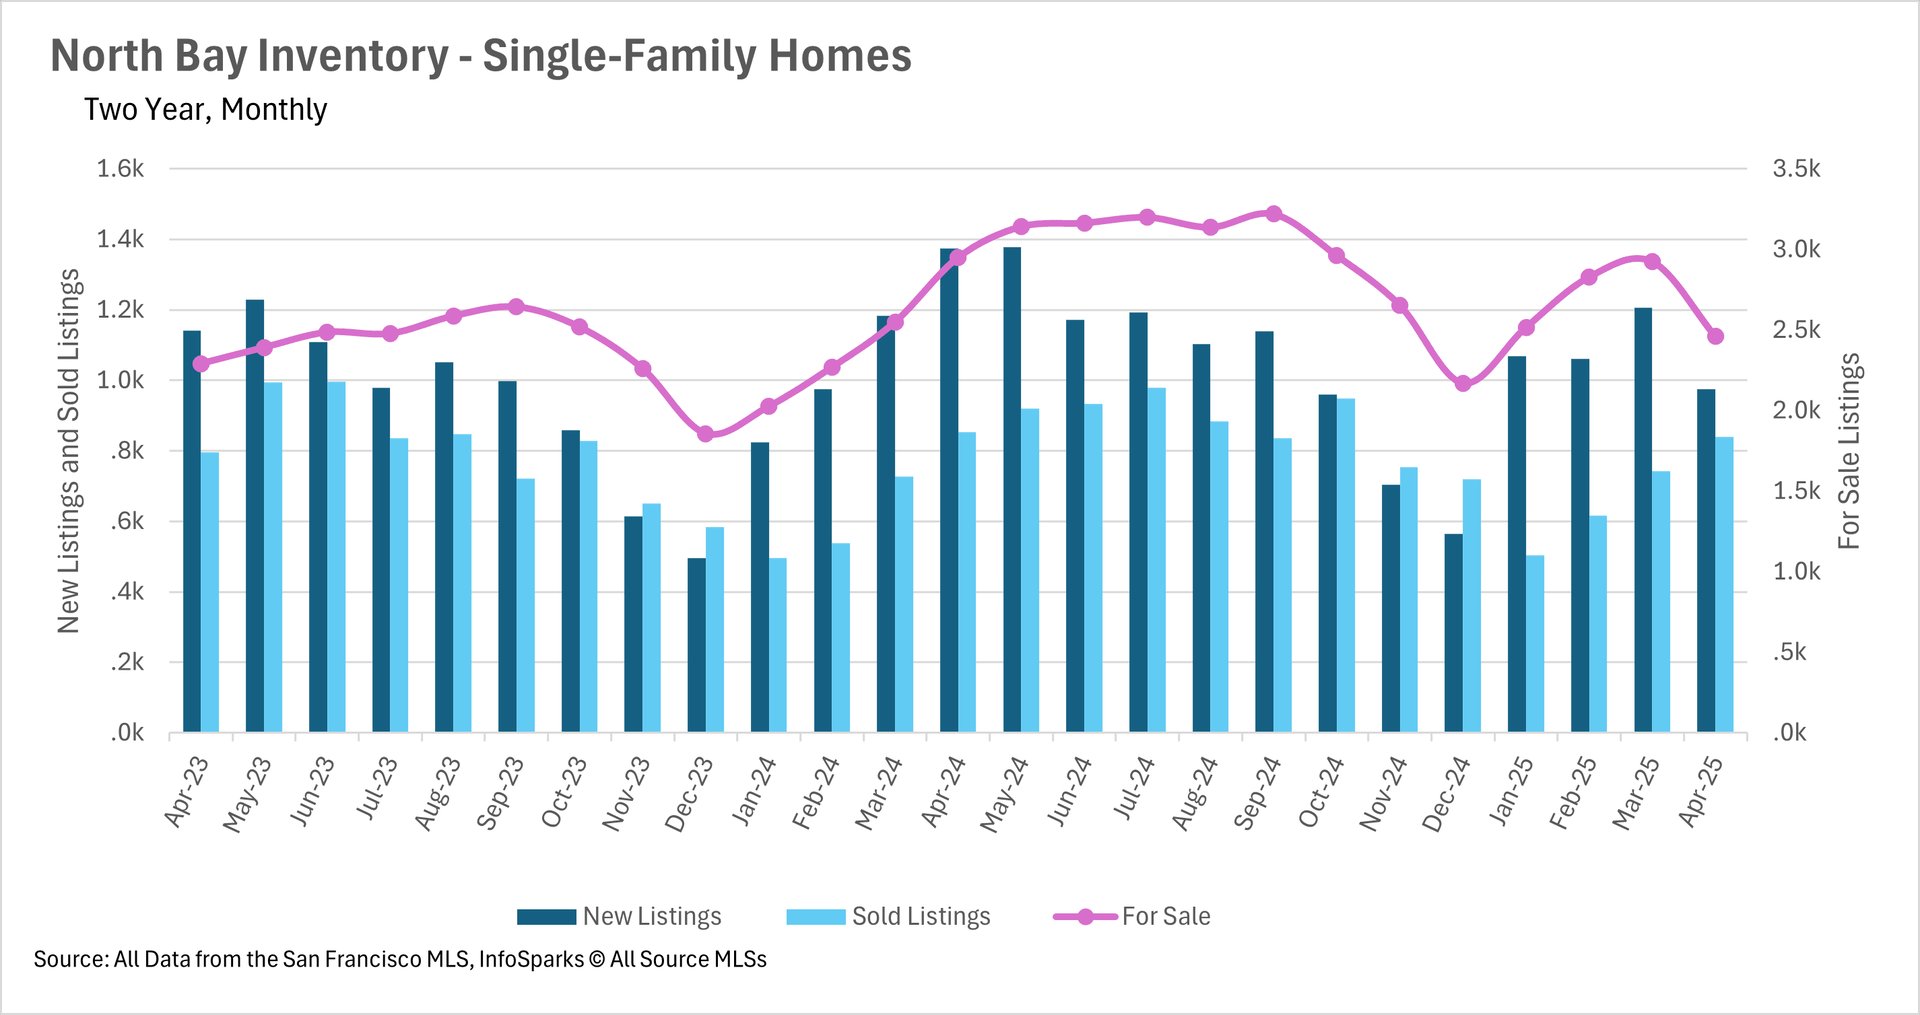
- Inventory levels continue to drop, as considerably fewer listings hit the market, when compared to both the prior month and the prior year.
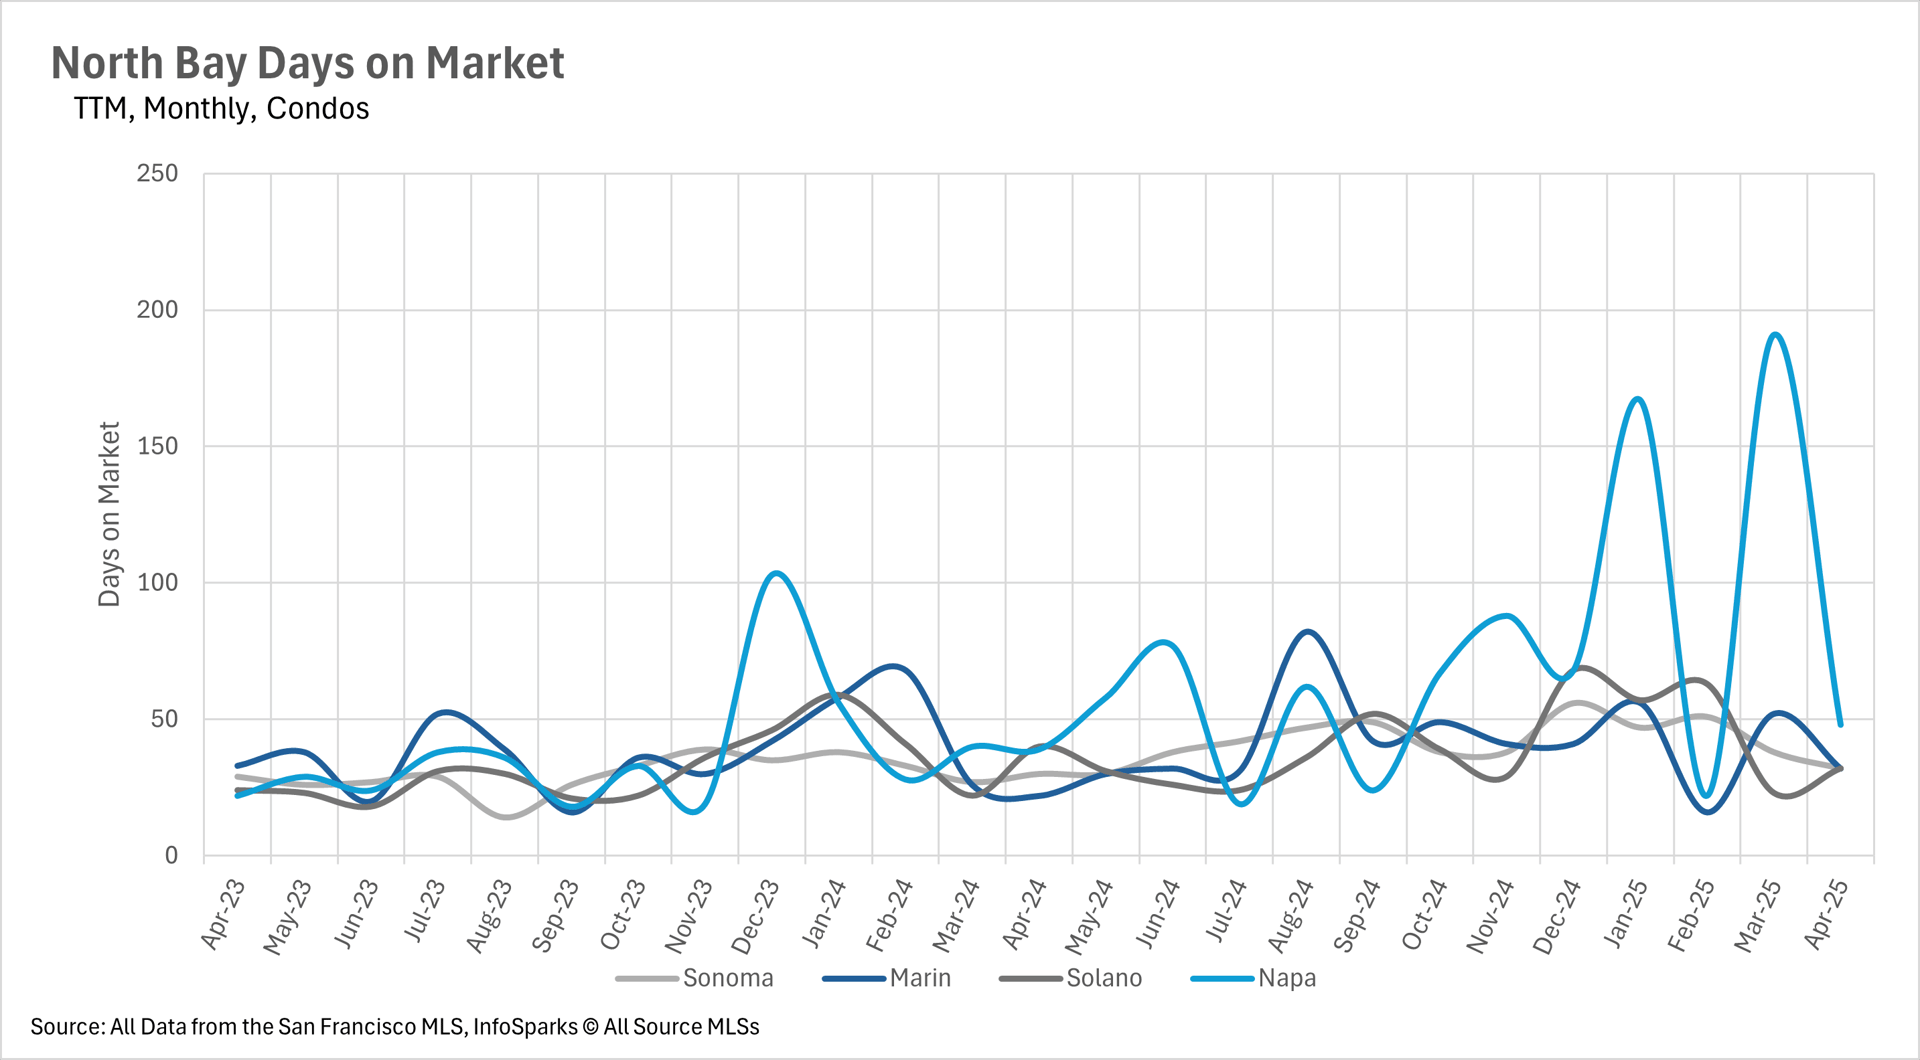
- Listings in the North Bay are spending slightly more time on the market when compared to last year.
Note: You can find the charts/graphs for the Local Lowdown at the end of this section.
Despite Fewer Listings Hitting the Market, Median Sales Prices Remain Roughly Flat
As of right now, median sale prices throughout the North Bay are mostly flat, with single-family homes in Sonoma and Marin Counties experiencing a 0.59% and 2.93% year-over-year increase. Whereas, single-family homes in Solano and Napa Counties experienced a year-over-year decrease of 0.41% and 0.52%, respectively. It’ll be important to keep an eye on the trends that we see in median sale price and its relation to the number of active listings over the course of the next few months, as we’re certainly going through some unprecedented economic events.
Inventory Levels Remain Lower Than They Were Last Year
Unfortunately, over the course of the past month, we didn’t see many new listings hitting the market, causing us to see a month-over-month drop in the total number of active listings on the market. In the month of April, we saw a 16.61% decrease in active listings on a year-over-year basis, and a 15.87% decrease on a month-over-month basis, which is quite incredible. This drop in active listings can largely be attributed to the fact that we saw nearly 30% fewer listings hitting the market in April, when compared to last year. At the same time, the number of listings that were sold stayed roughly flat, decreasing by just 1.41%. At this point in time, we’re going to need to see a large bump in new listings to get the market back on track for inventory growth.
The Median Listing Is Spending Slightly More Time on the Market Than It Did Last Year
When you hear that there are fewer listings hitting the market and fewer active listings overall, while demand remains roughly the same, you might assume that properties are being snapped up at breakneck speed. In the case of the North Bay in April, that assumption would be wrong though. The average listing is spending a few days longer on the market than it was around this time last year. However, we wouldn’t be surprised to see listings getting snapped up more quickly over the course of the next few months, if the current trends in inventory persist.
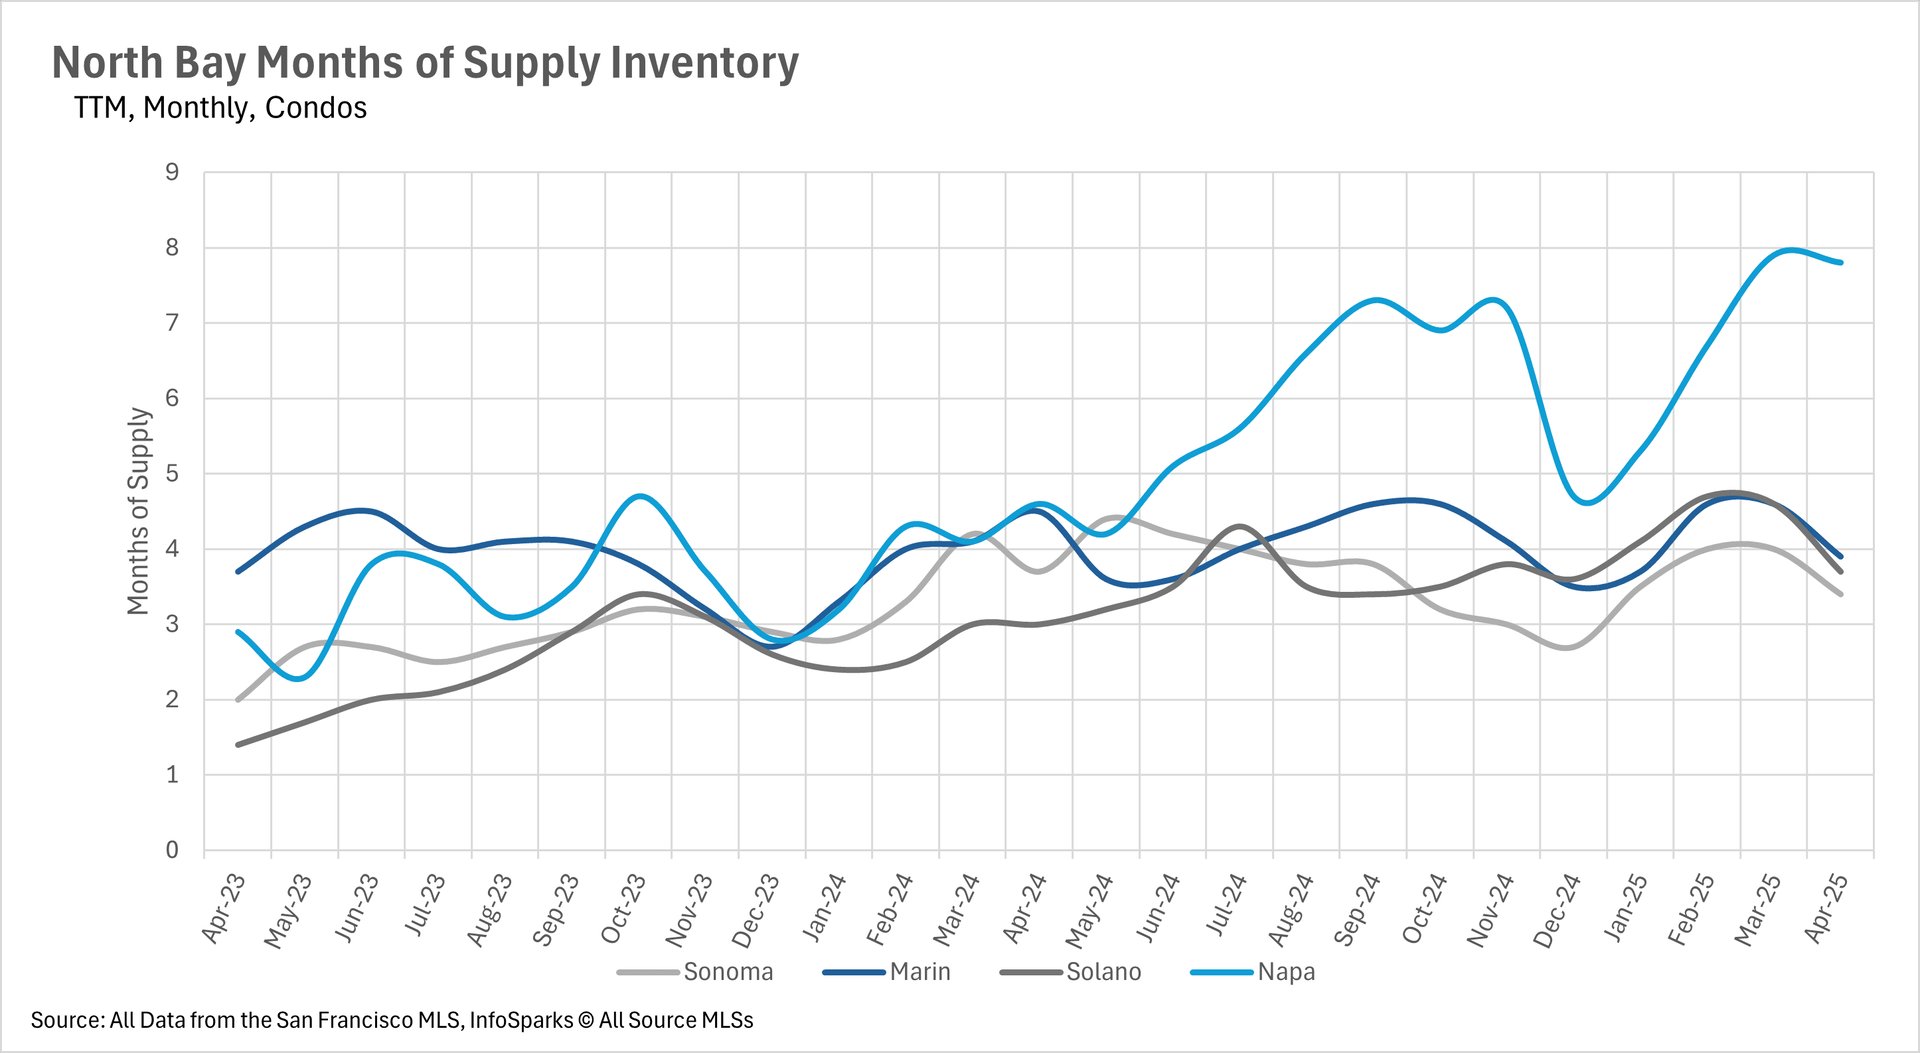
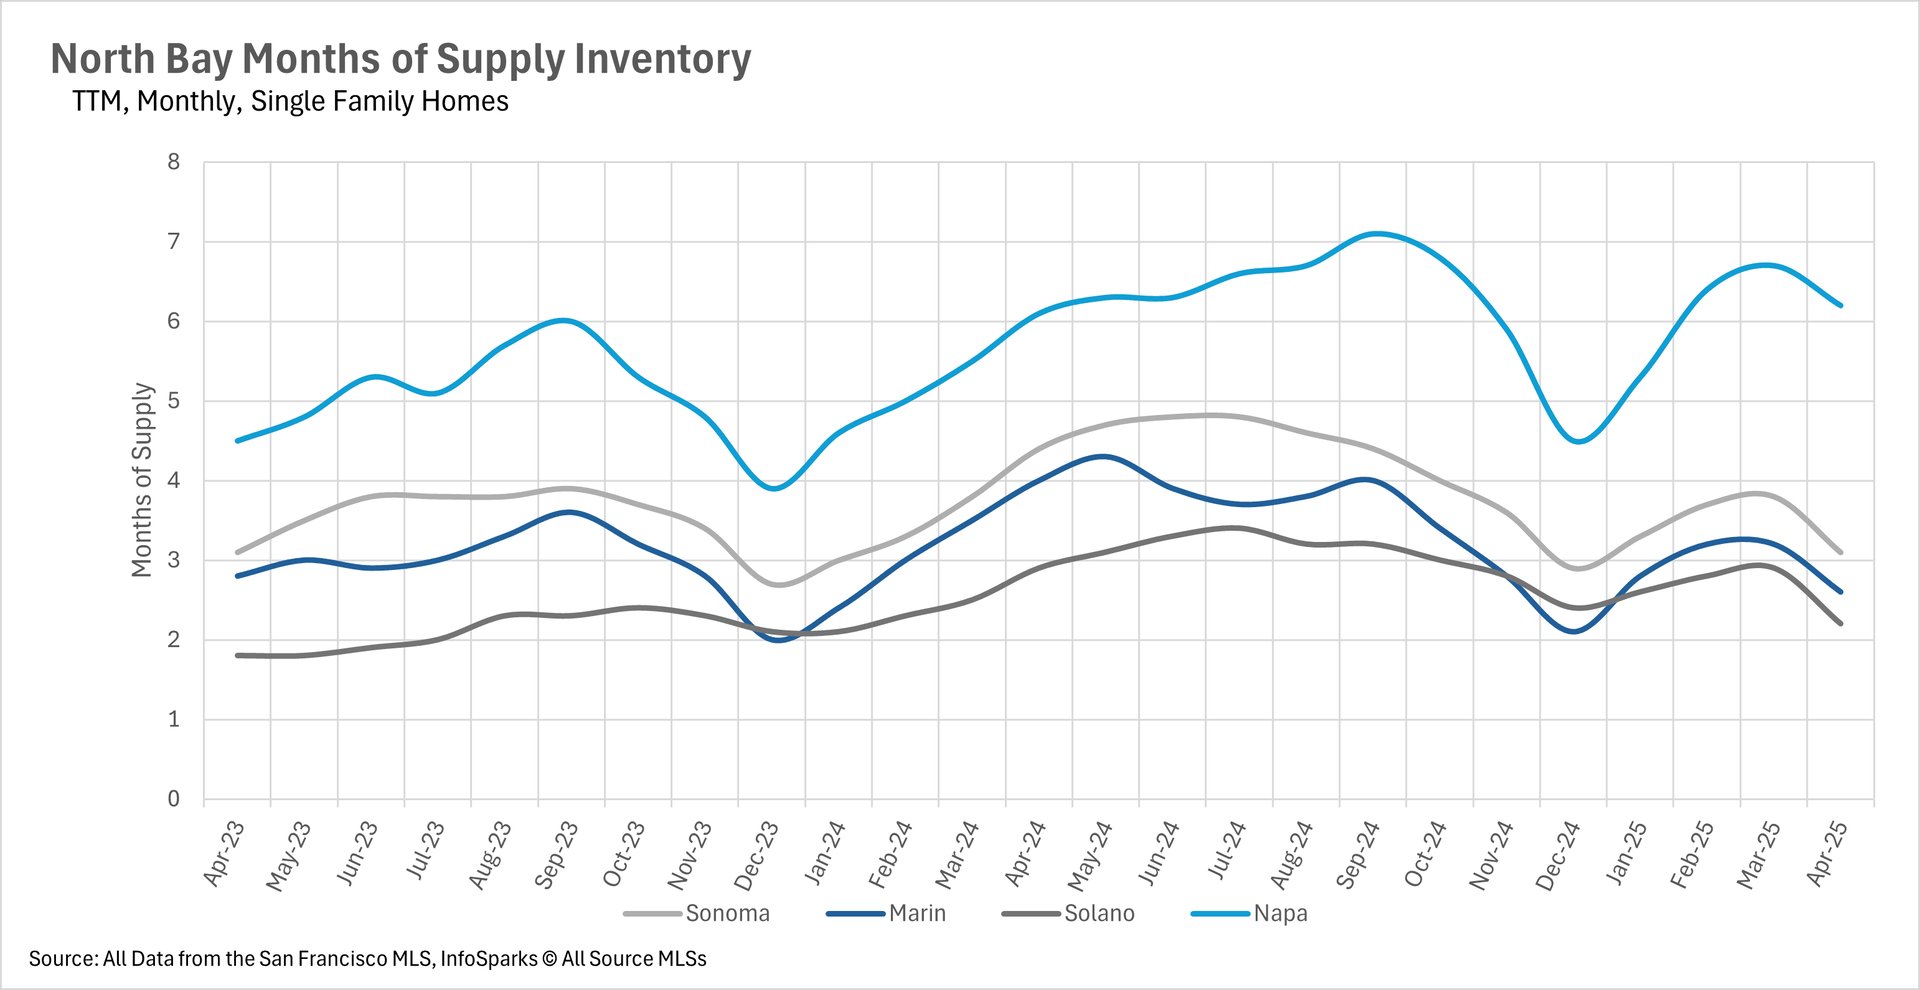
Napa Remains a Buyer's Market, Whereas Marin, Solano, and Sonoma Counties Favor the Seller
The real estate market in California has historically averaged around three months' worth of inventory on the market at a given time. This means that whenever inventory levels drop below three months' worth of supply, an area is in a seller’s market. On the flip side, if inventory levels are above three months' worth of supply, an area is in a buyers’ market.
In the month of April, we saw some considerable changes in terms of the number of months' worth of supply on the market. There were 6.2 months of supply on the market in Napa, making it a buyer's market. Whereas there were 2.6 months and 2.2 months of supply on the market in Marin and Solano Counties, respectively, making them seller's markets. Lastly, although Sonoma County saw a considerable swing in inventories, it’s fairly balanced at this point, with 3.1 months of supply on the market.