The Local Lowdown
Quick Take:
- In the month of April, we saw considerable year-over-year declines in median sale prices throughout the East Bay.
- Both single-family home and condo inventory have skyrocketed on a year-over-year basis by roughly 43%.
- Listings are sitting on the market for a few days longer than they were around this time last year.
Note: You can find the charts/graphs for the Local Lowdown at the end of this section.
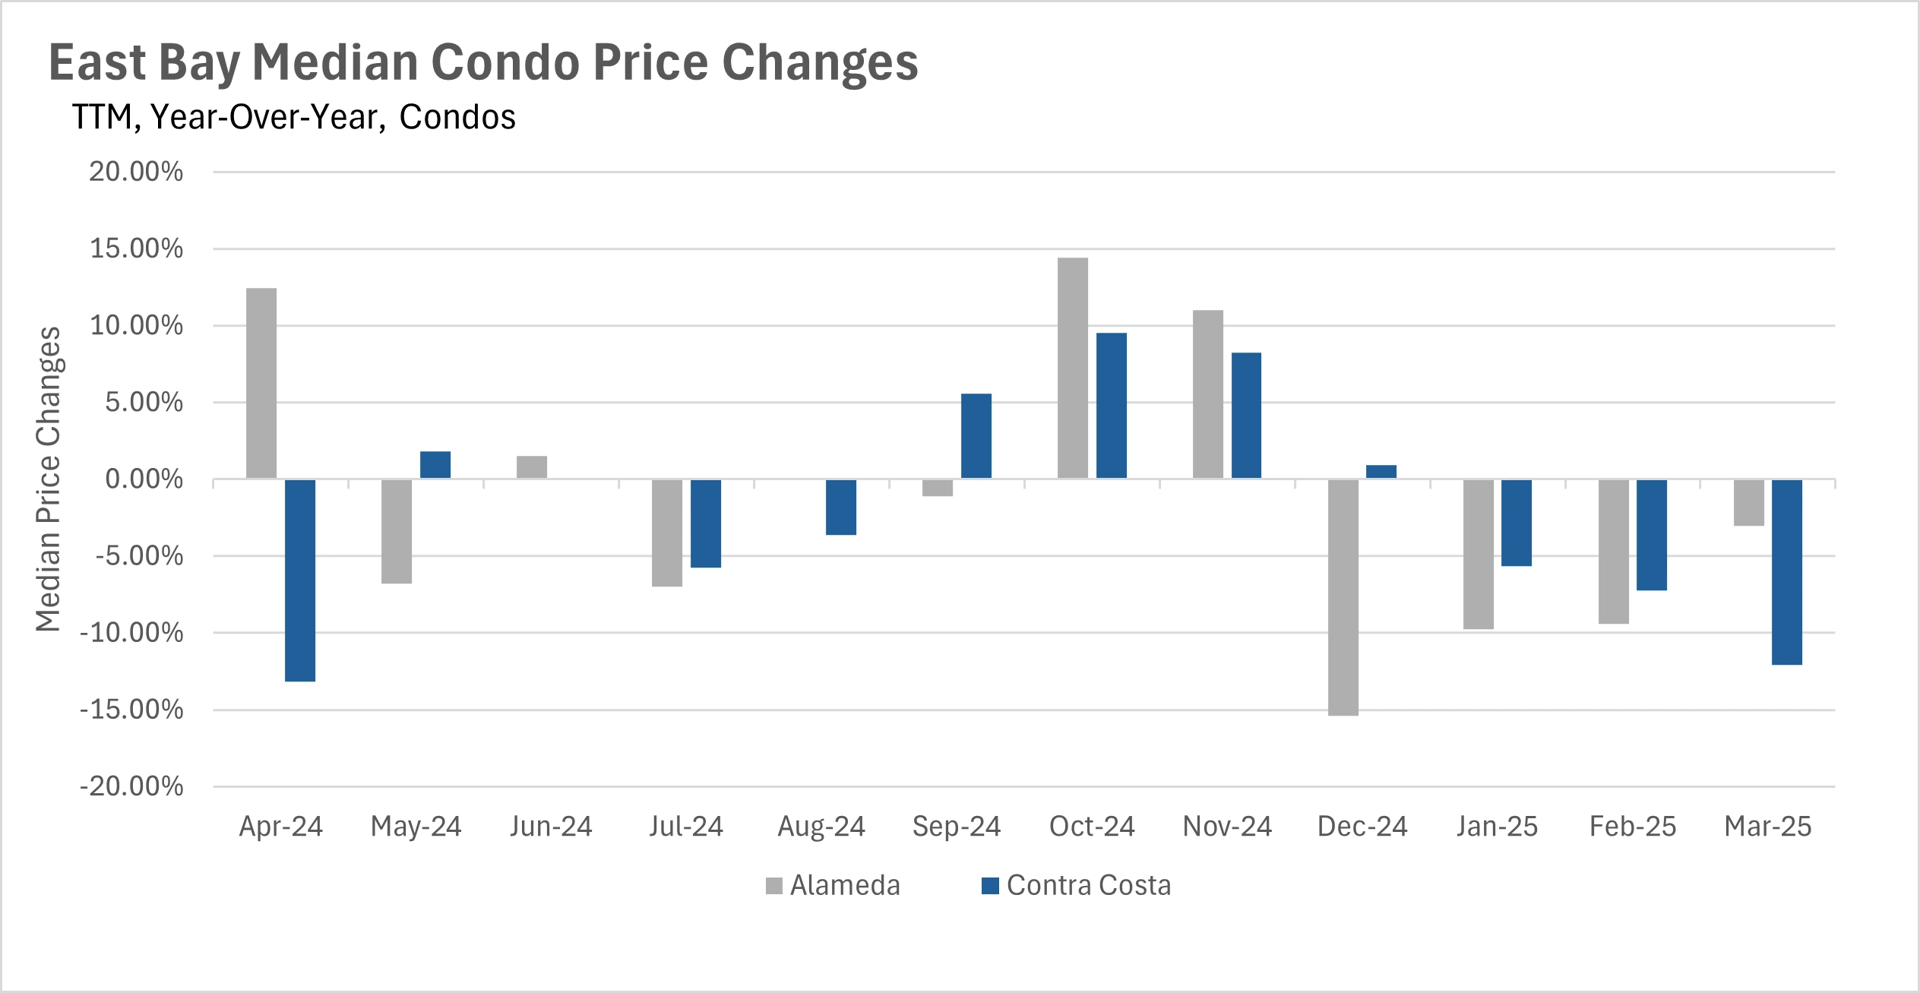
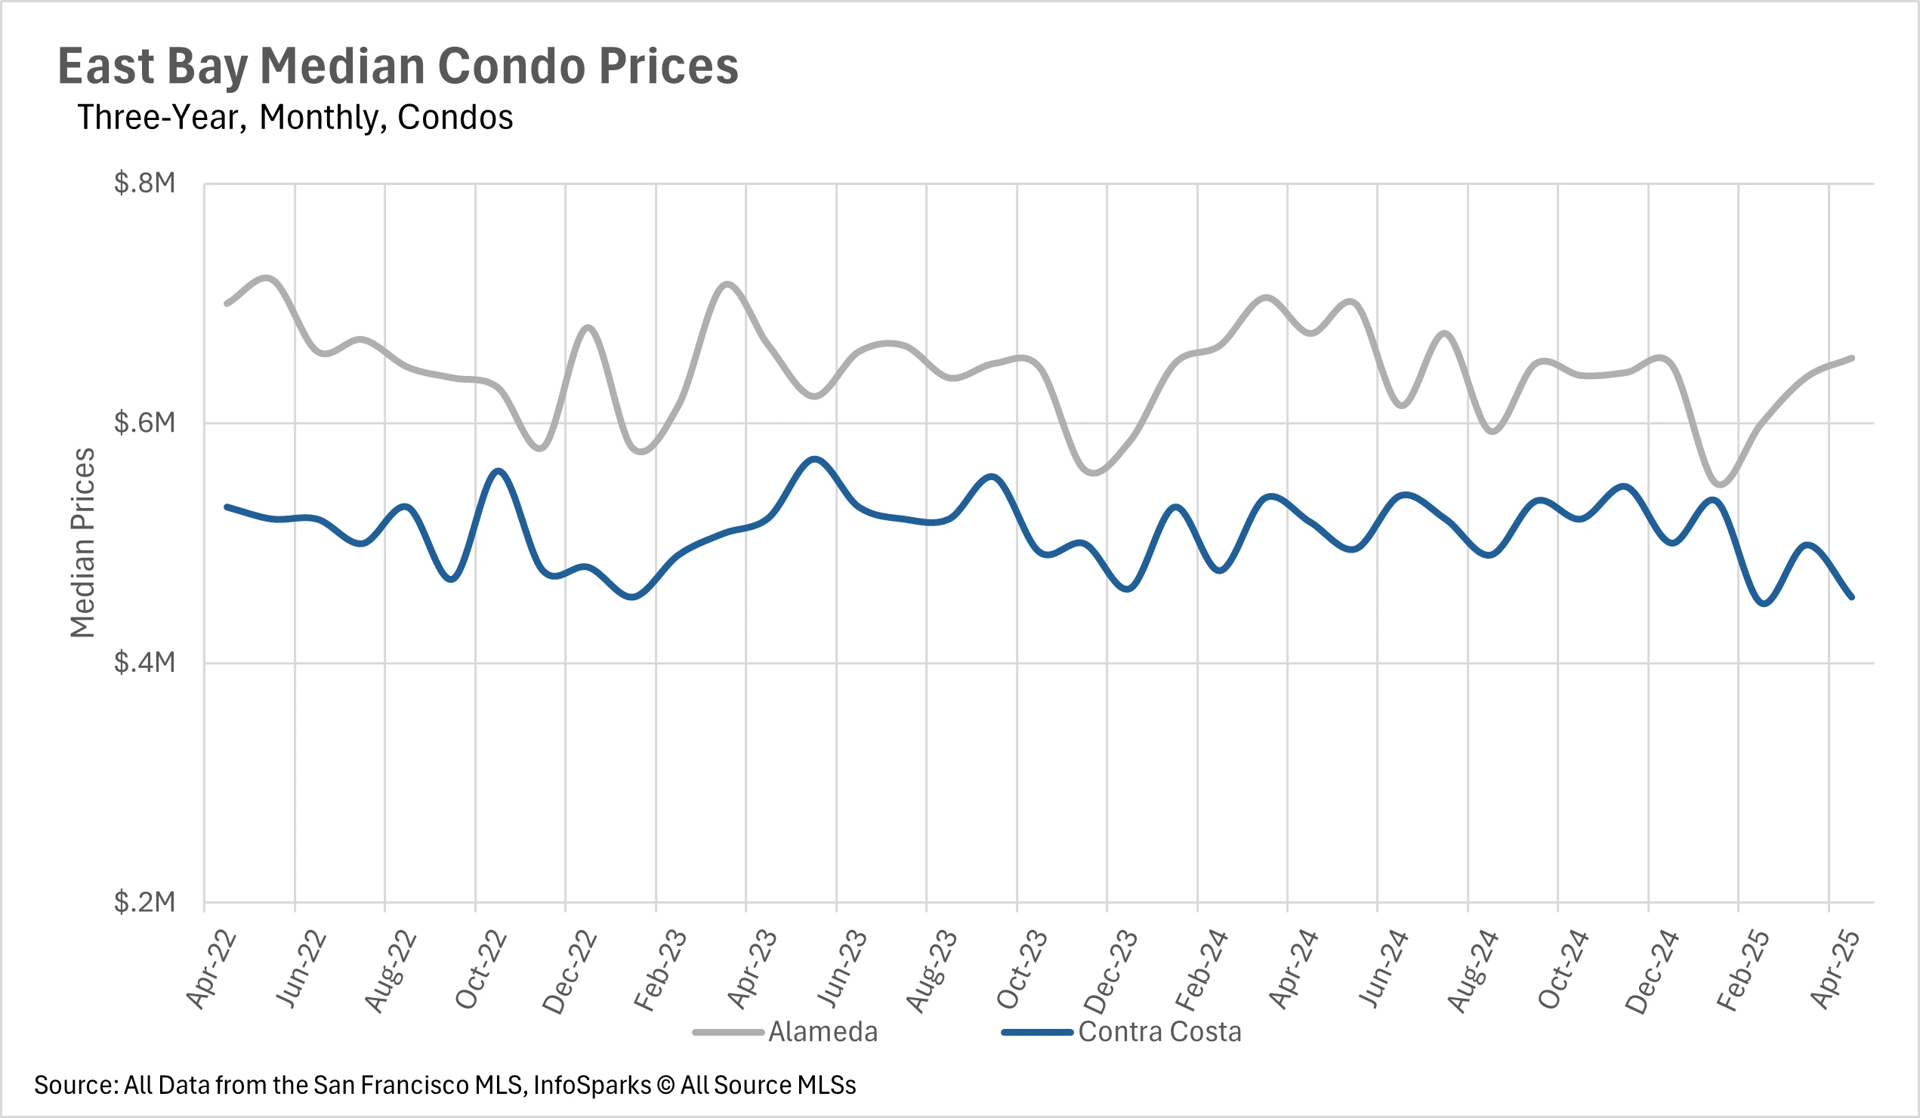
The Median Sale Price of a Condo in Contra Costa County Decreased by 12%!
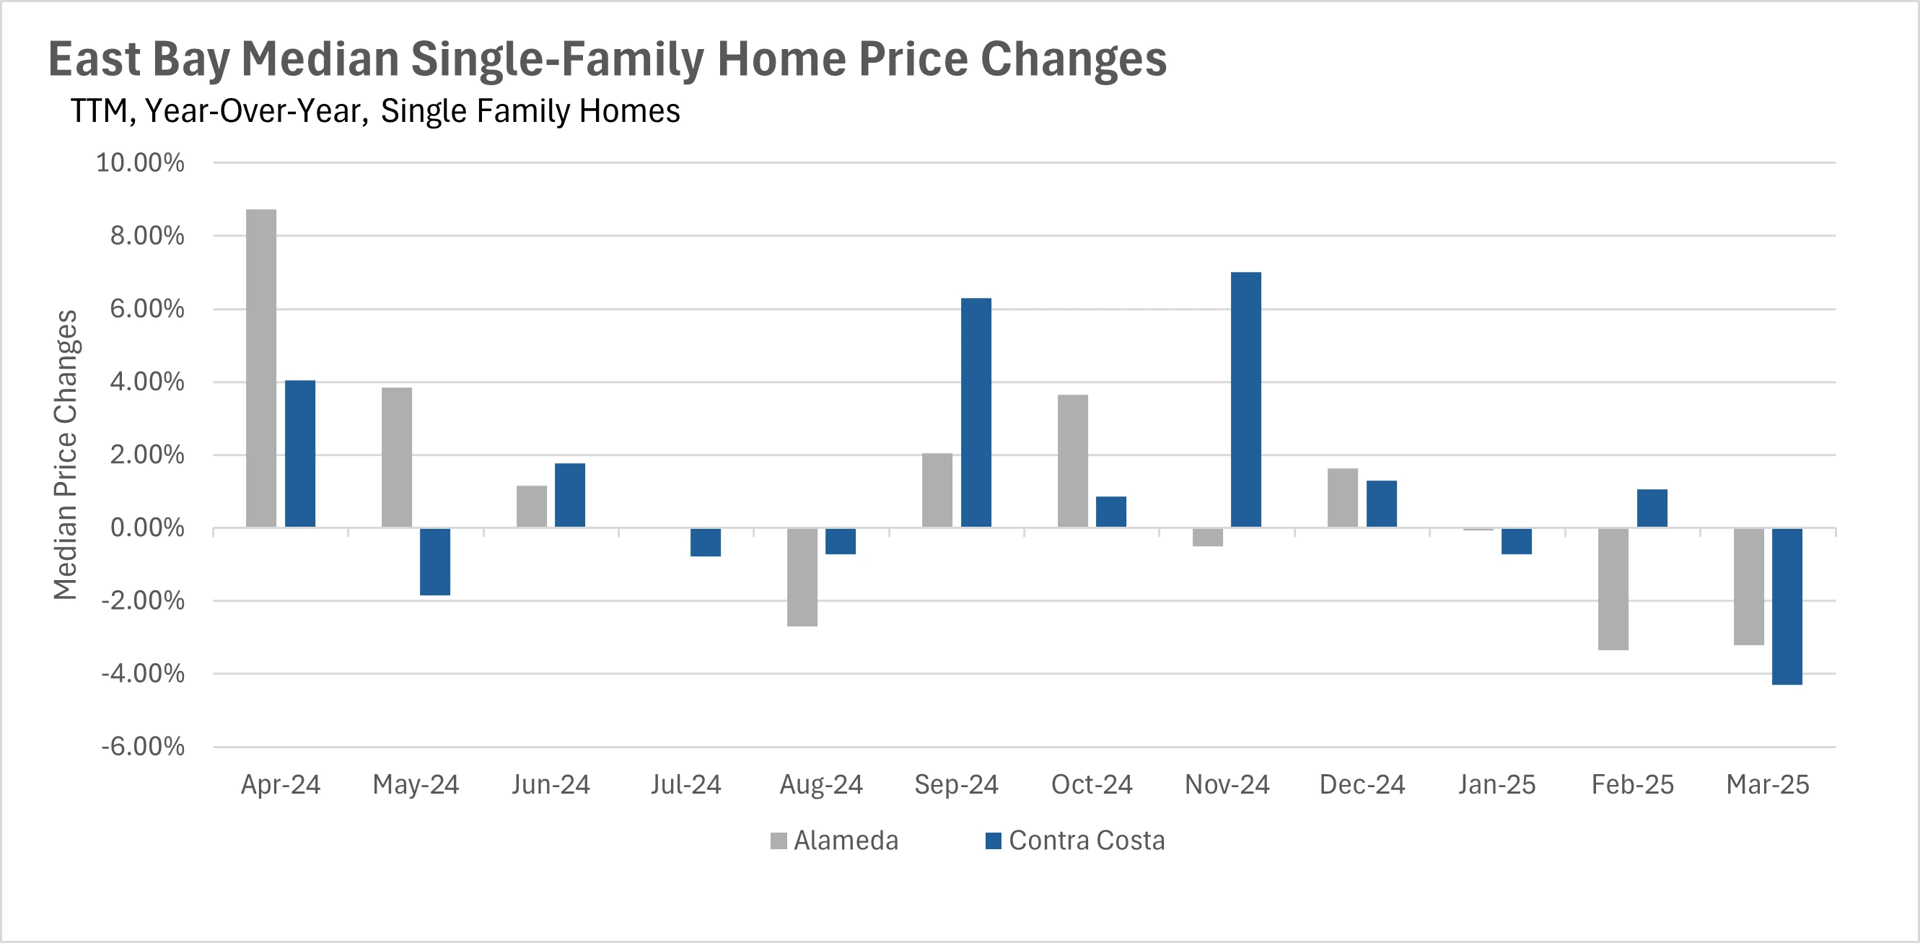
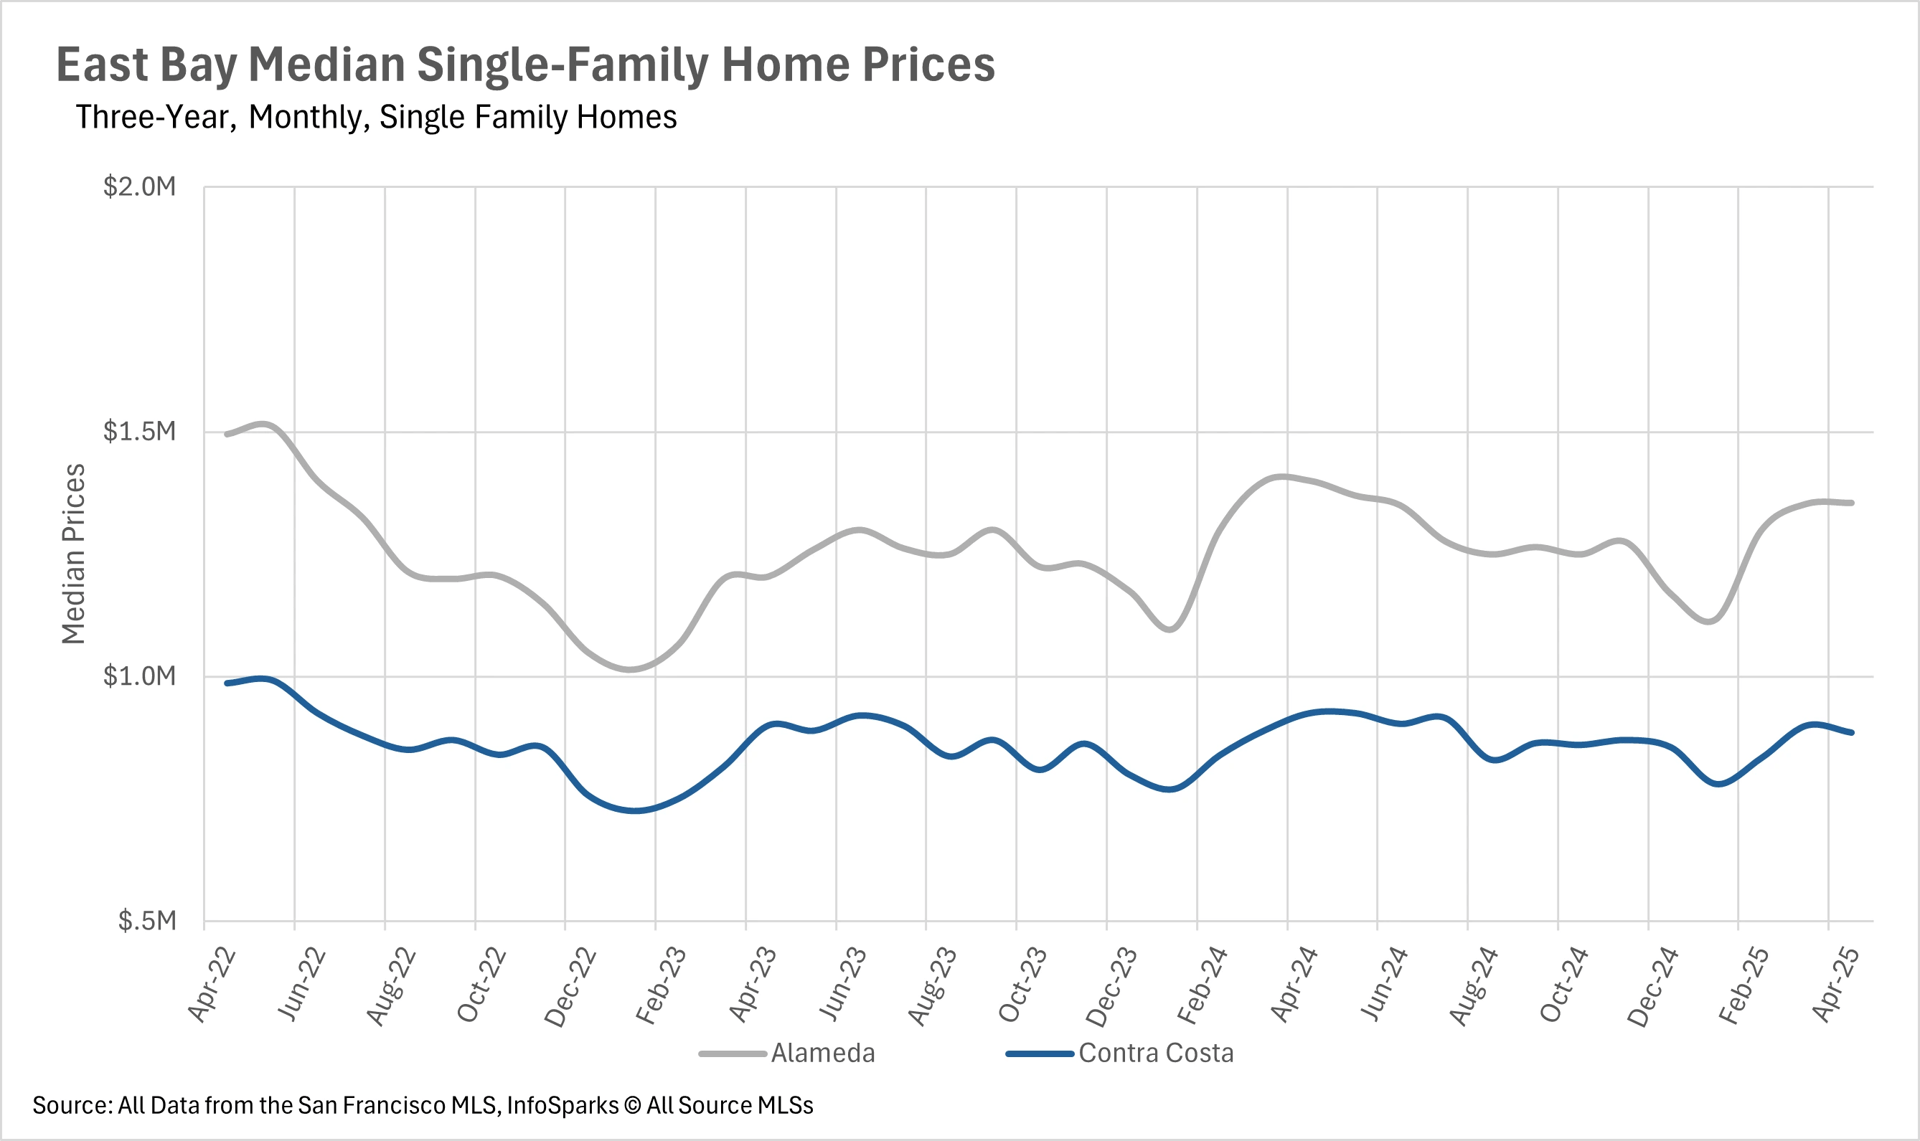
In April, we saw some pretty sharp declines in terms of median sale price throughout the East Bay, with the most prominent of which being condos in Contra Costa County. However, declines elsewhere were quite a bit more modest. The median sale price for a condo in Alameda County decreased by 3.04% on a year-over-year basis. Single-family home prices also dropped, with the median home selling for 3.21% and 4.31% less than this time last year in Alameda County and Contra Costa County, respectively.
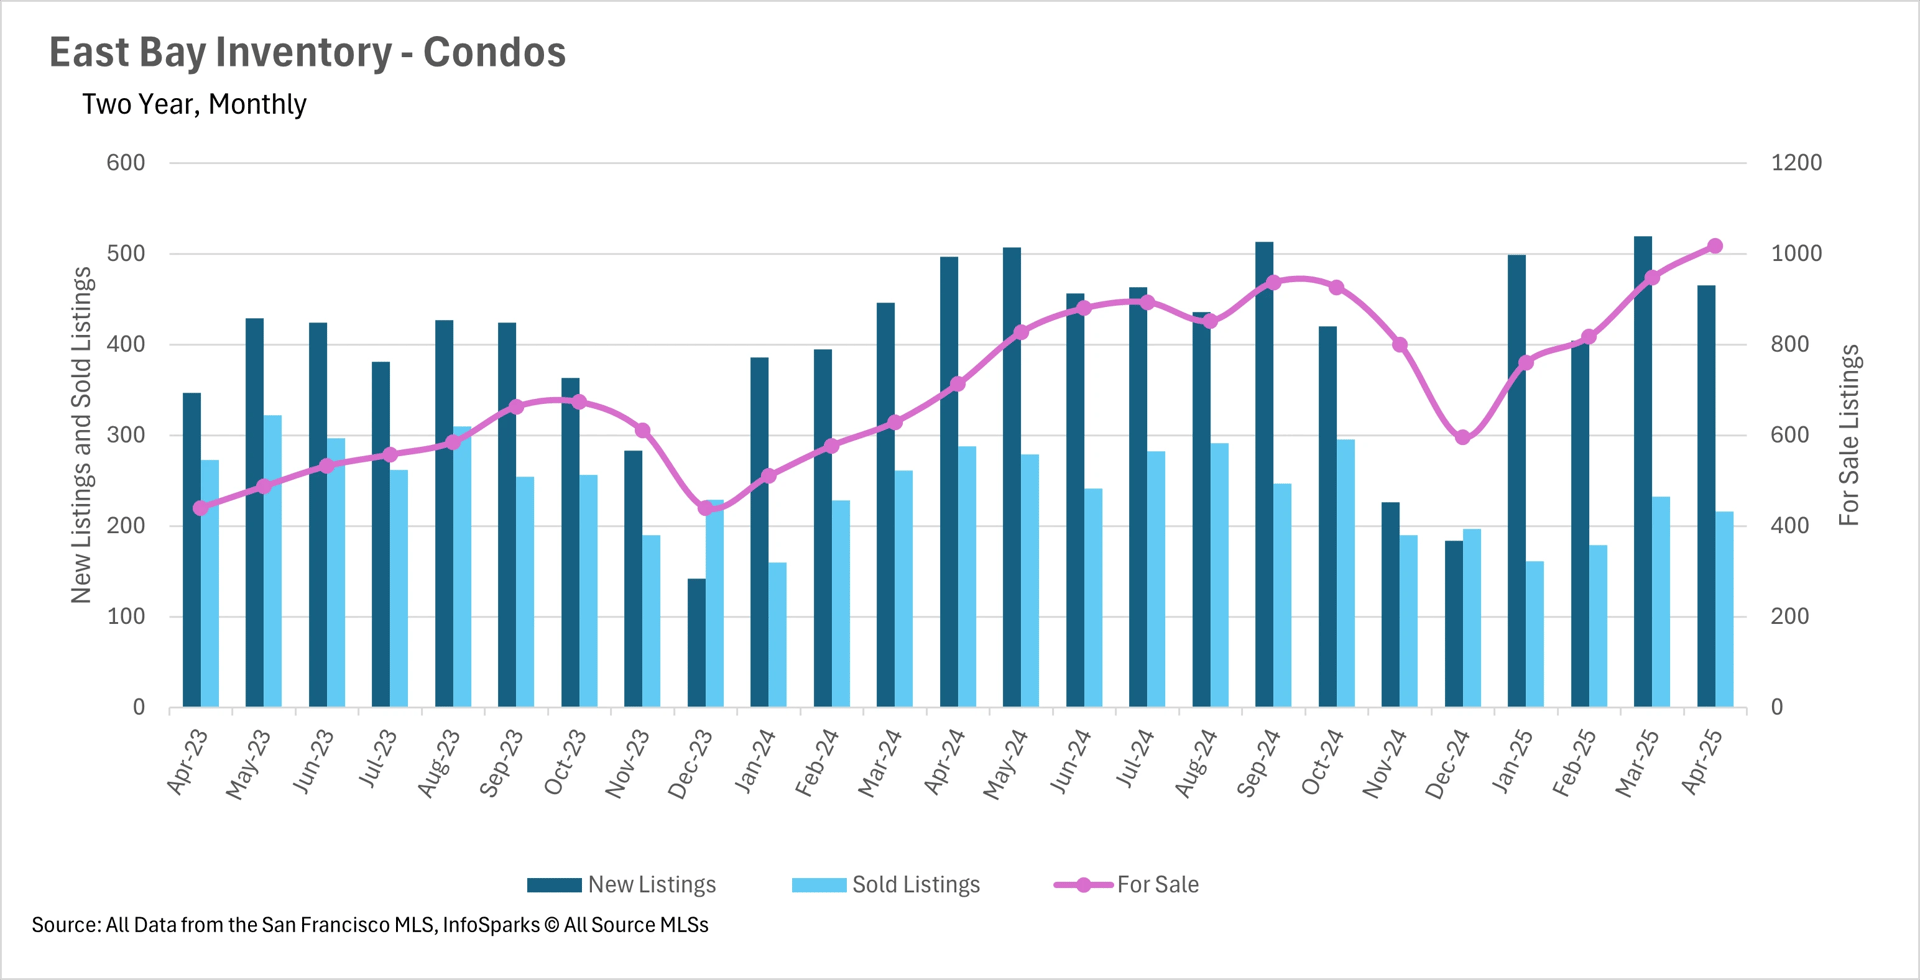
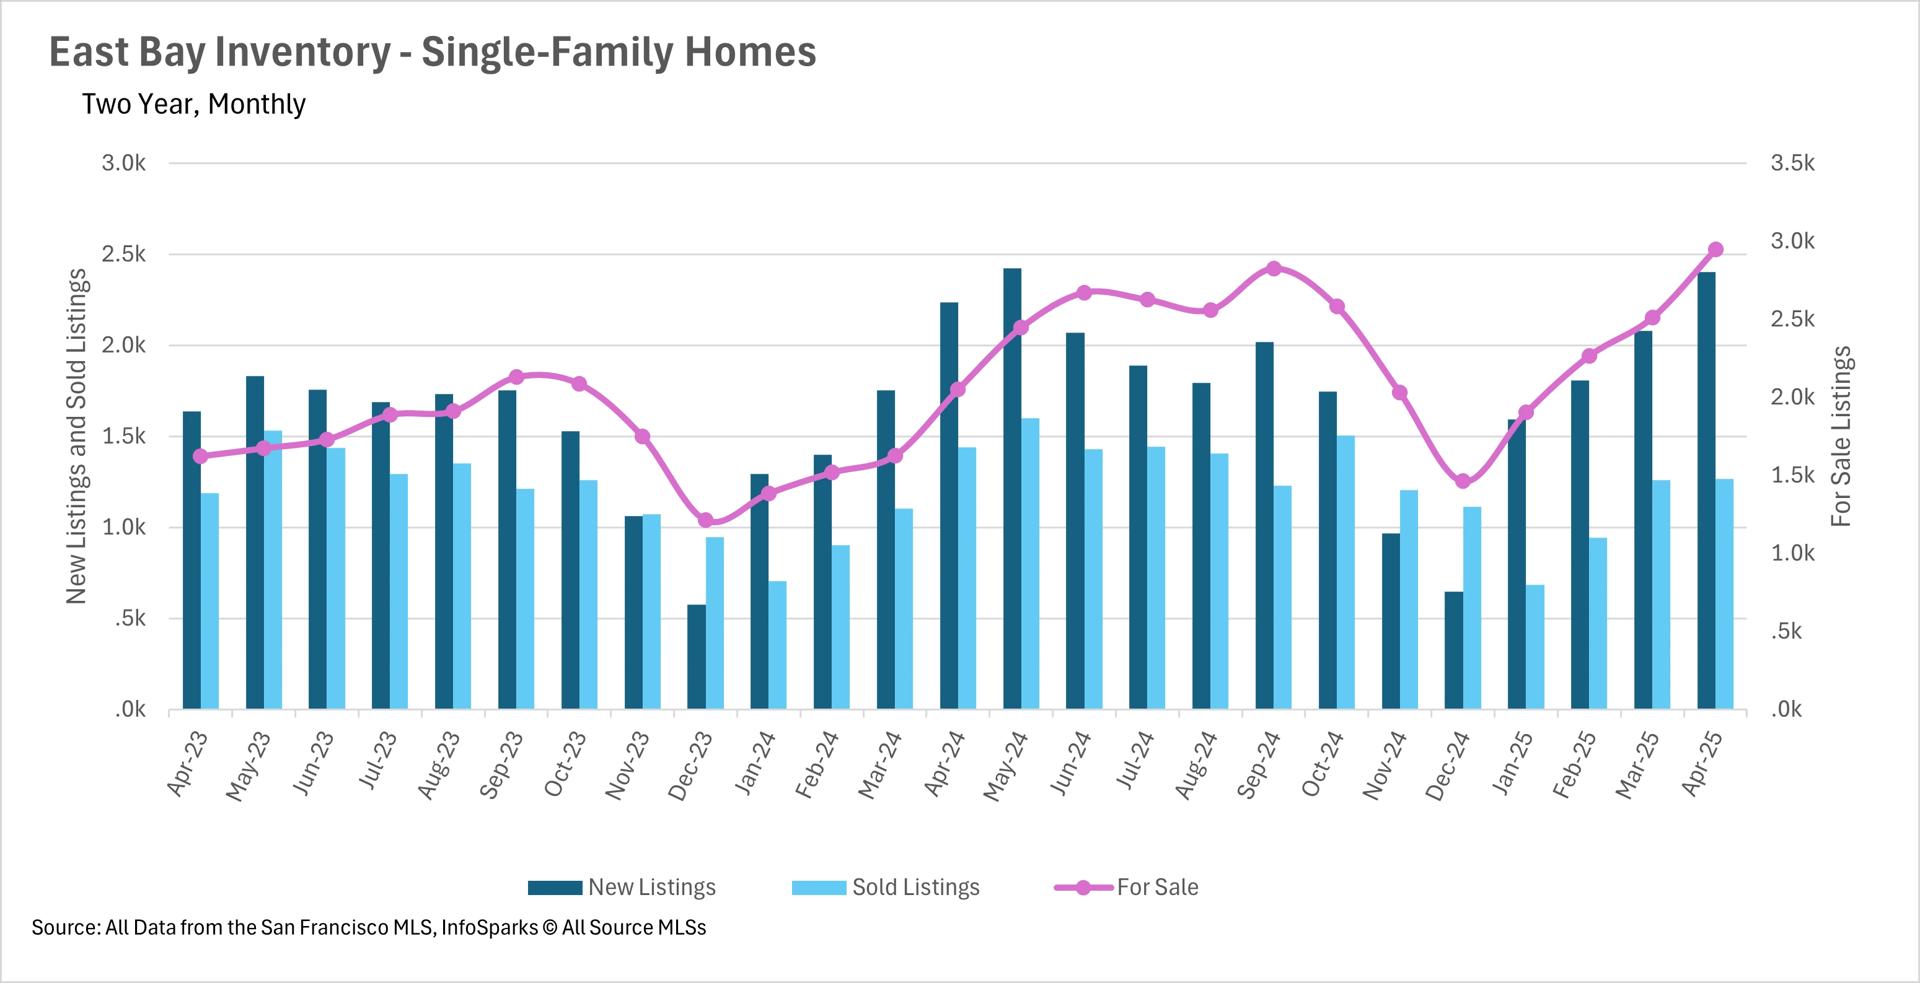
Inventories Are at the Highest Level We’ve Seen in the Past Two Years
In the month of April, we saw a massive amount of inventory added, without many listings being sold. There was a 7.47% increase in new single-family homes hitting the market, whereas there were 12.21% fewer single-family homes sold. When you couple this with the inventory trends that we’ve been seeing over the past few months, that leaves us with 43.69% more active single-family home listings than this time last year!
We saw similar trends in the condo market as well. While there were fewer new listings added when compared to this time last year, there was an even steeper drop in sold listings. This has led to a year-over-year increase in condo inventories of 42.78%!
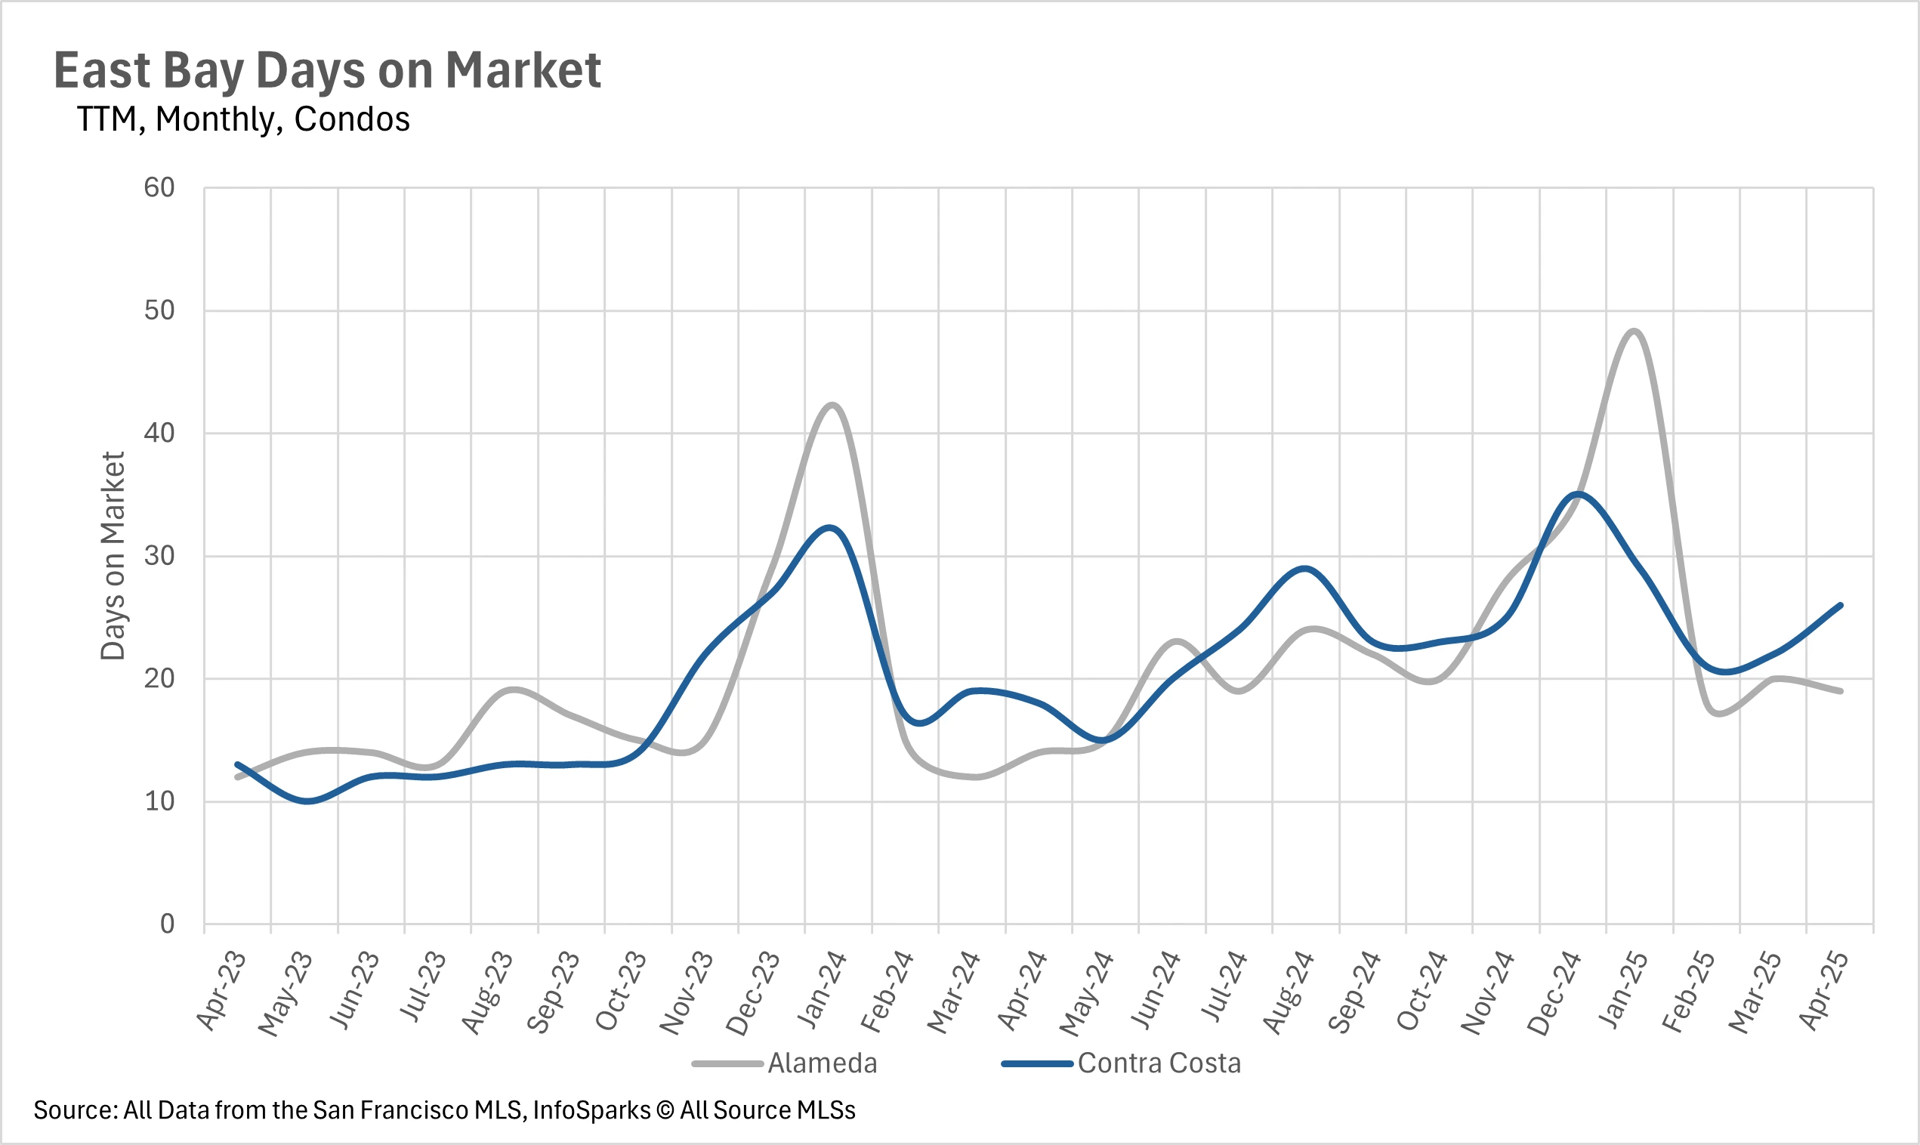
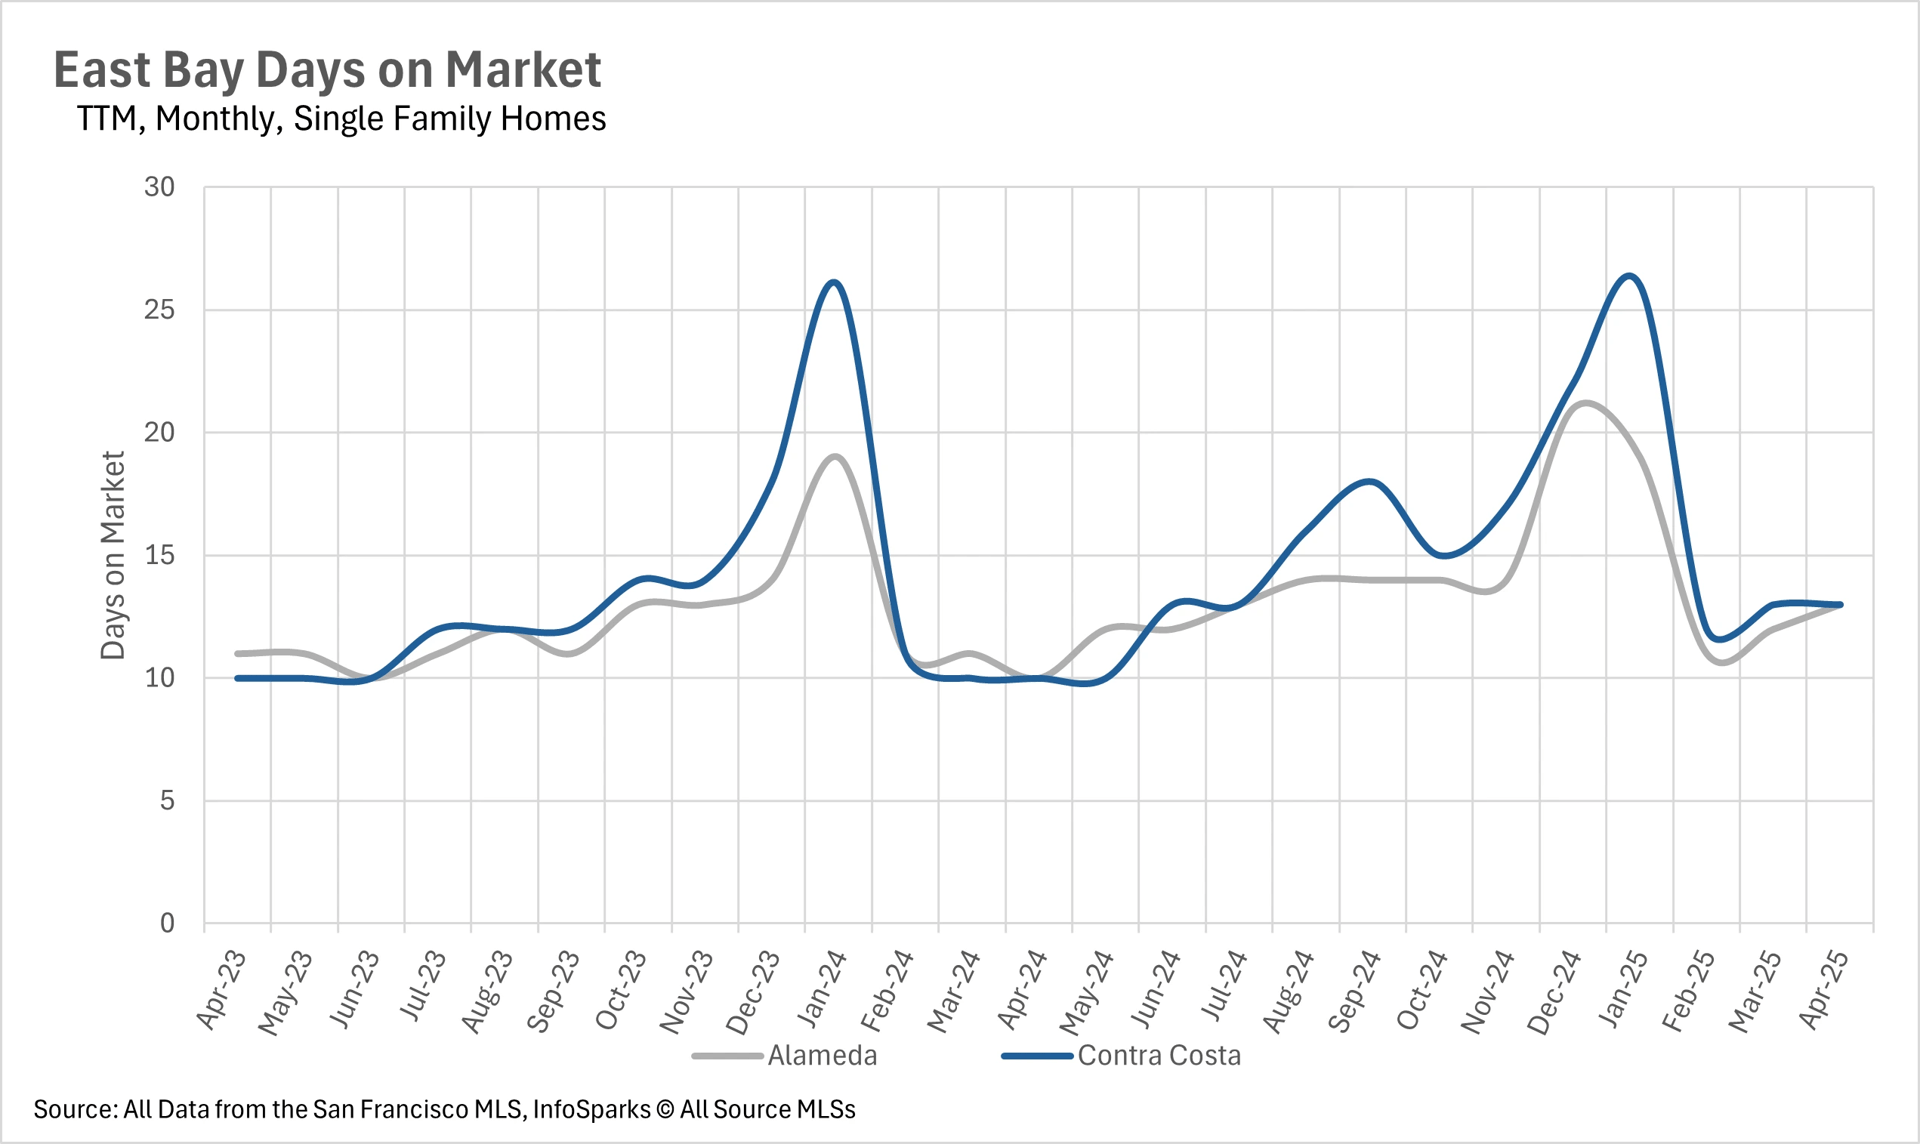
Despite Inventory Issues, Listings Are Still Moving Quite Quickly
When you hear that inventories are building and prices are falling, you might assume that listings are sitting on the market for considerable periods of time. Although listings are certainly sitting on the market for longer, the average single-family home in the East Bay is still only on the market for 13 days. Condos have always sat on the market for longer than single-family homes, but they’re still moving relatively quickly, with the average condo in Alameda County lasting only 19 days, while the average condo in Contra Costa County lasts 26 days.
The East Bay Single-Family Home Market Remains a Seller’s Market - For Now
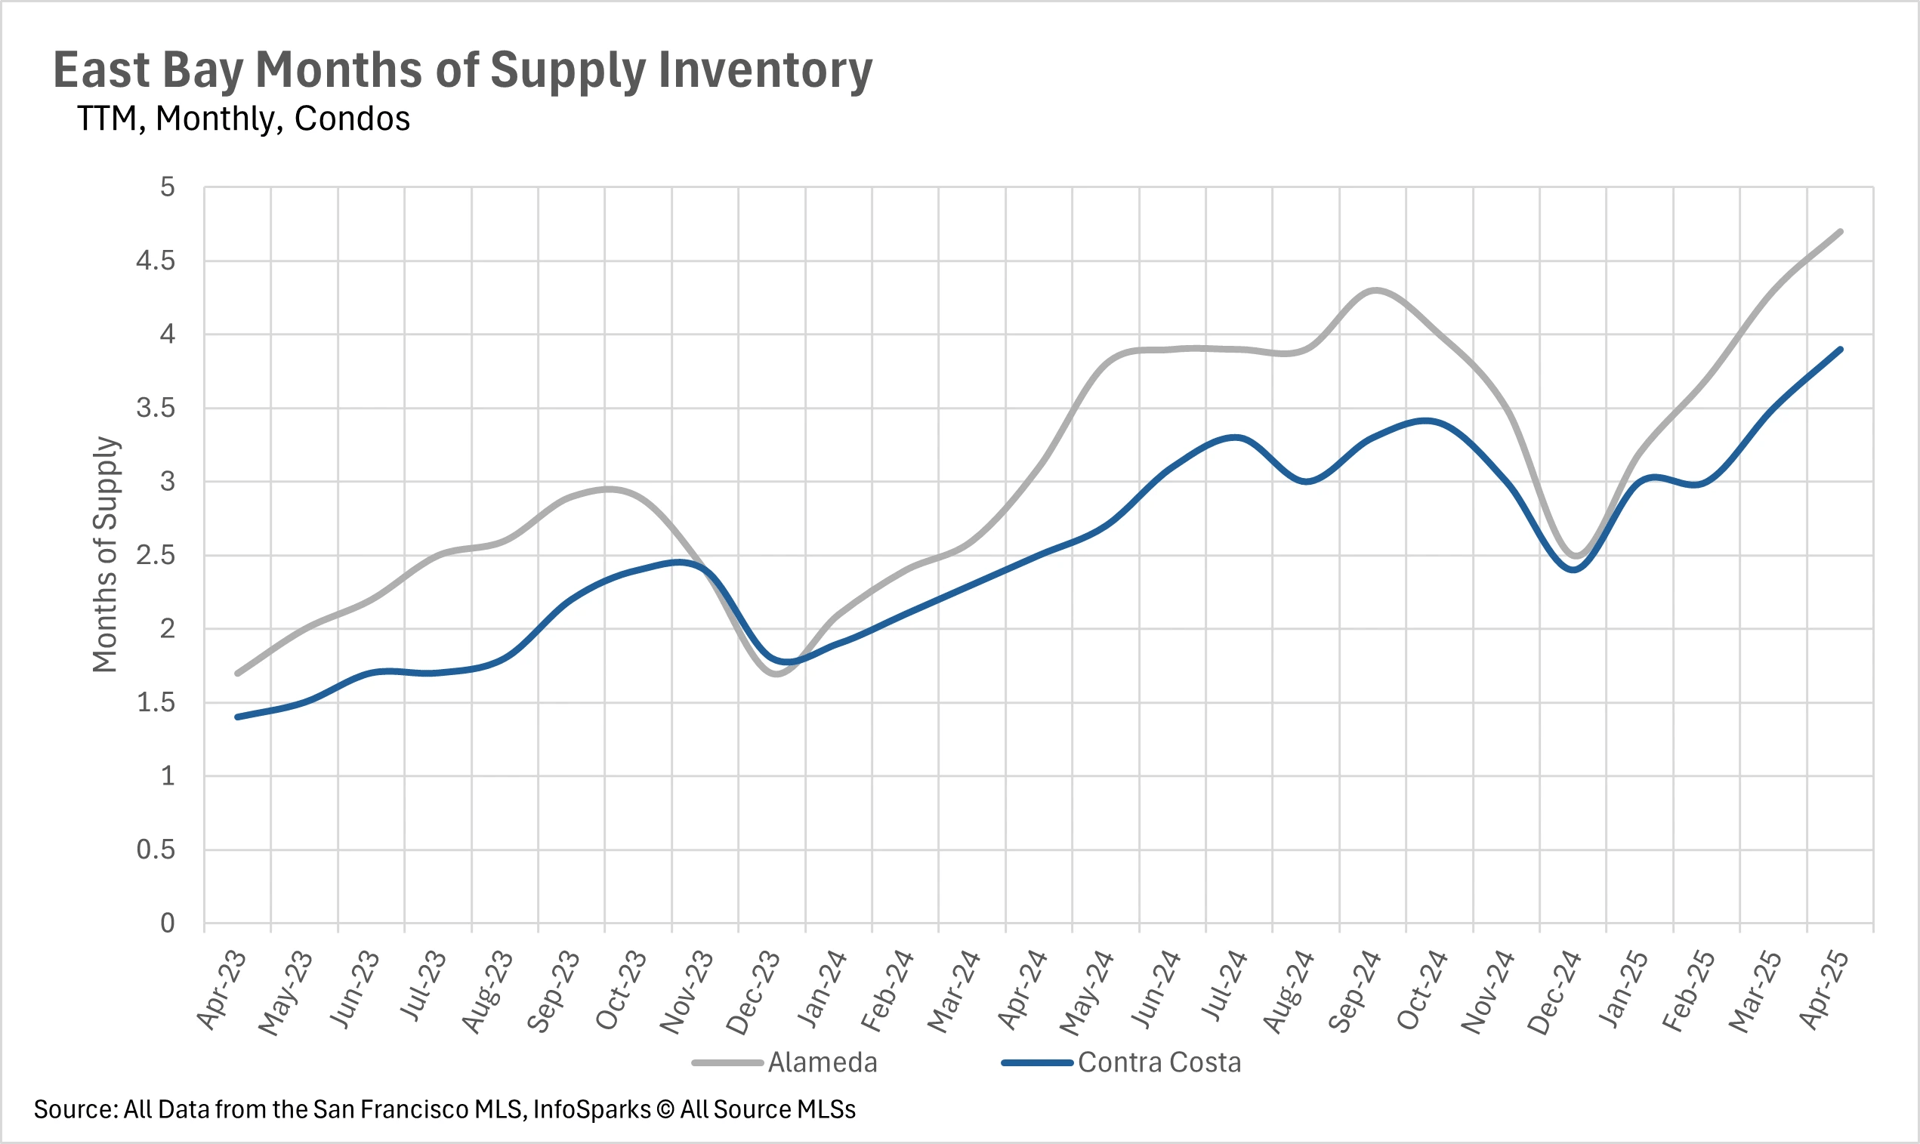
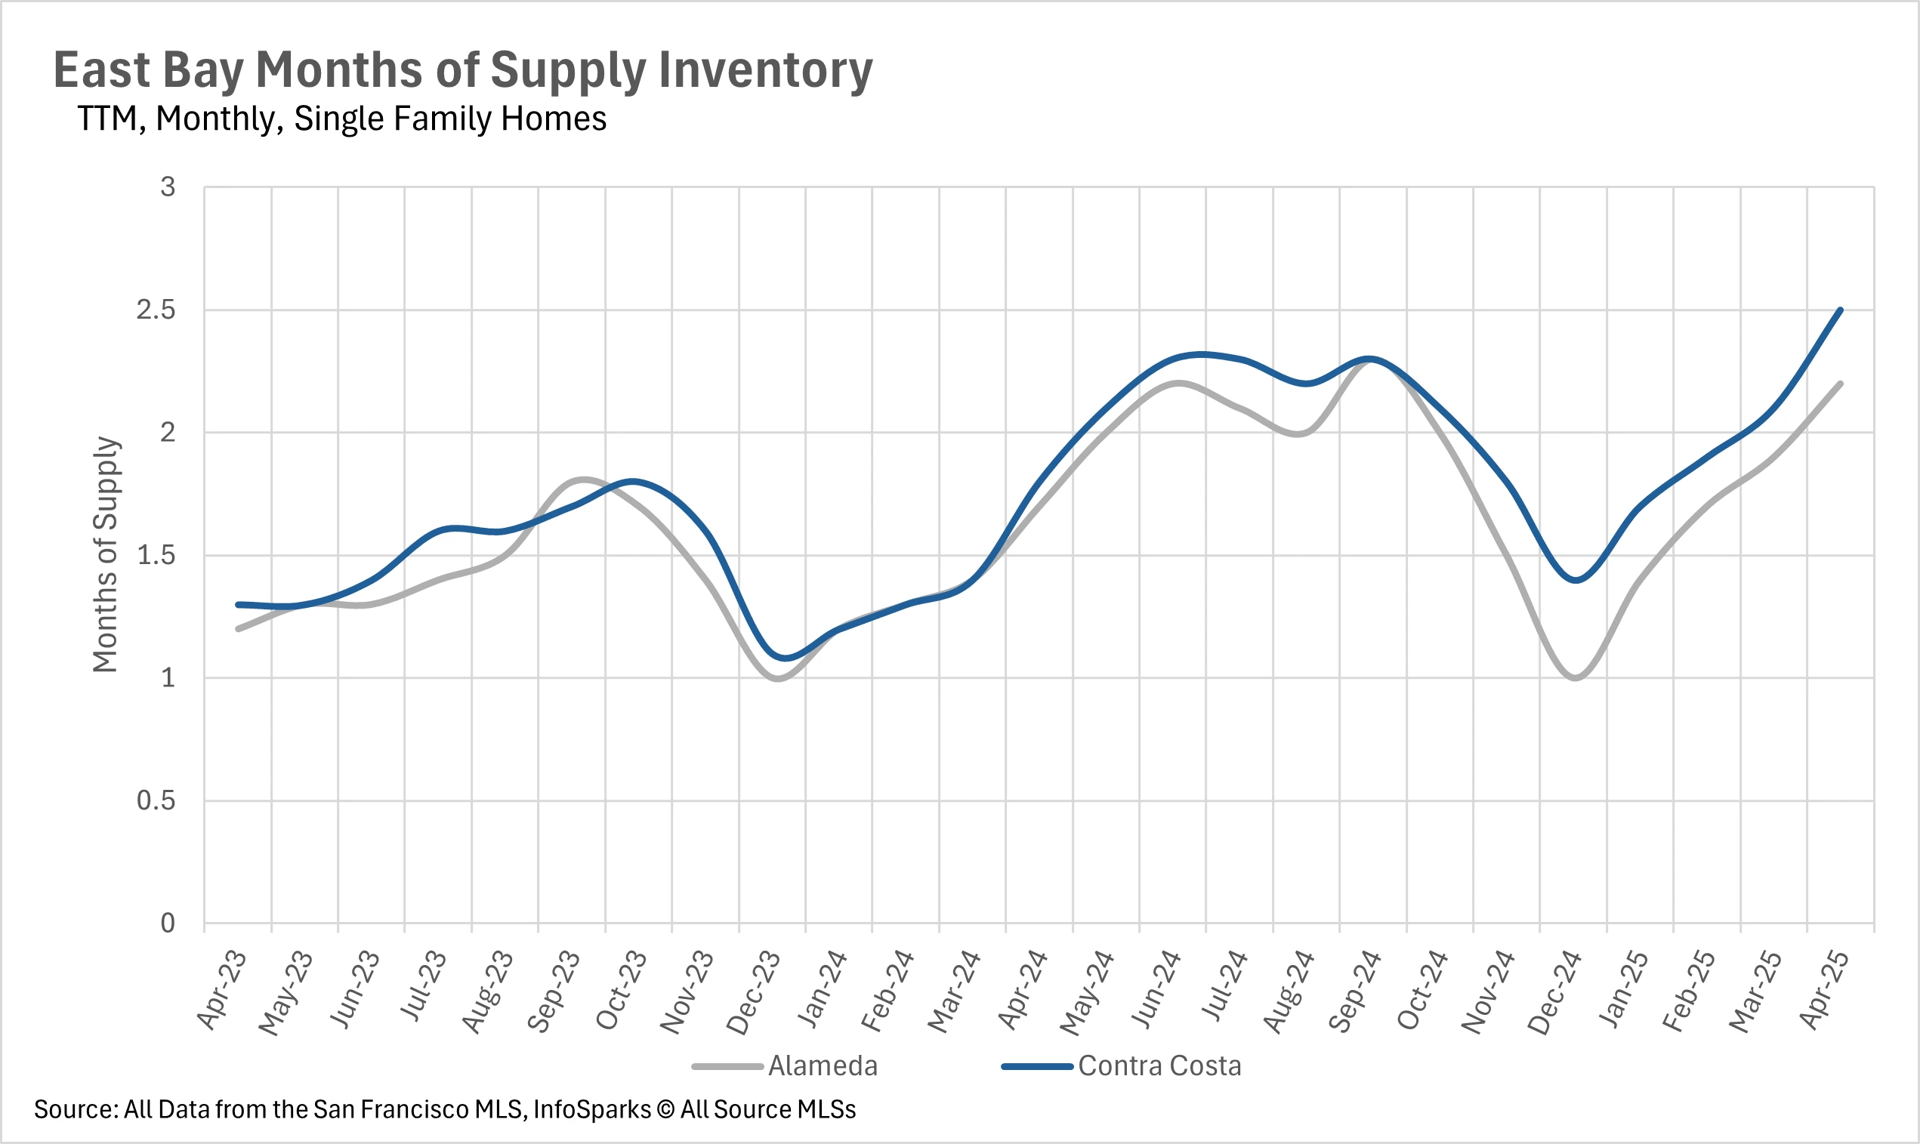
When determining whether a market is a buyers’ market or a sellers’ market, we look to the Months of Supply Inventory (MSI) metric. The state of California has historically averaged around three months of MSI, so any area with at or around three months of MSI is considered a balanced market. Any market that has lower than three months of MSI is considered a seller’s market, whereas markets with more than three months of MSI are considered buyers’ markets.
Since inventories have been building in the East Bay, while demand has been stagnant, this means that the number of months worth of inventory on the market is steadily increasing. Typically in the East Bay, we see inventories build throughout the summer, and with 2.2 and 2.5 months' worth of single-family supply on the market in Alameda and Contra Costa Counties, respectively, we could see these markets flip to buyer's markets.
Looking to the condo market, with 4.7 and 3.9 months of supply on the market in Alameda and Contra Costa Counties, buyers retain most of the bargaining power, making it a great time to be a condo buyer in the East Bay!