View on valley from Mount Diablo, California, USA

May 2025 Bay Area Market Report

The Local Lowdown

Quick Take:

  • Bay Area real estate markets show mixed trends in April, with some areas seeing price declines while others maintain growth.
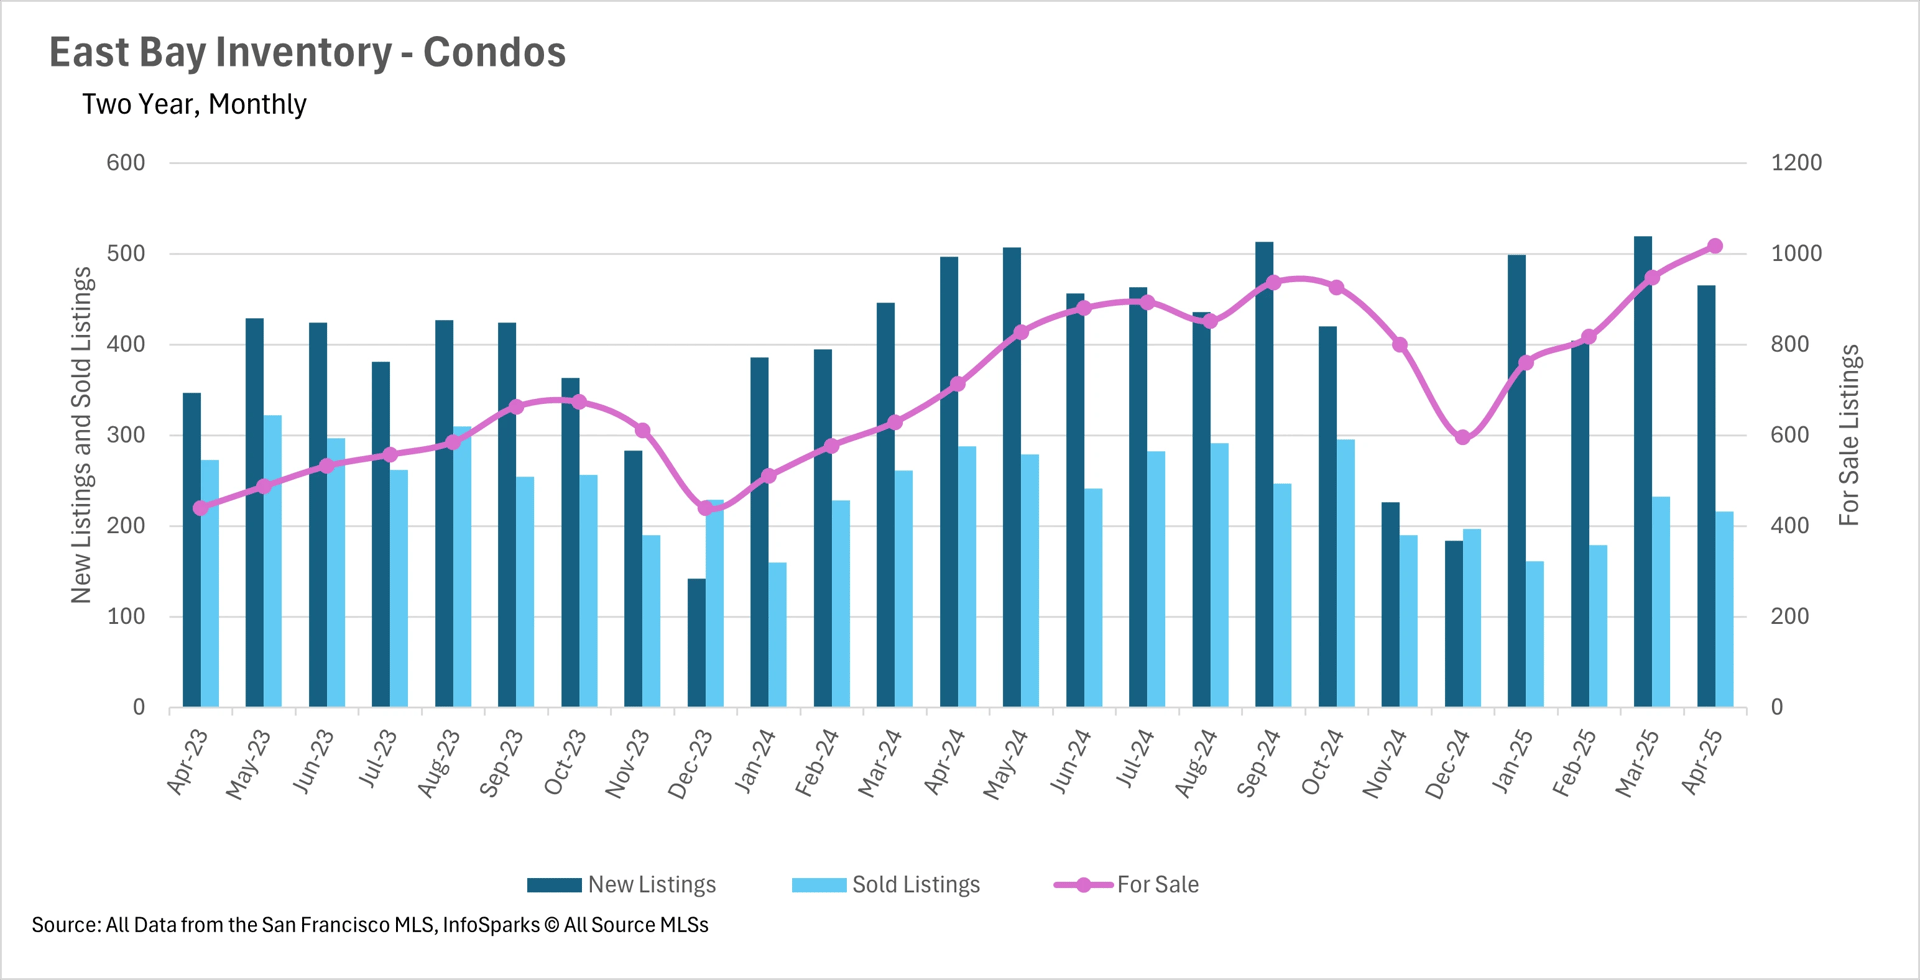
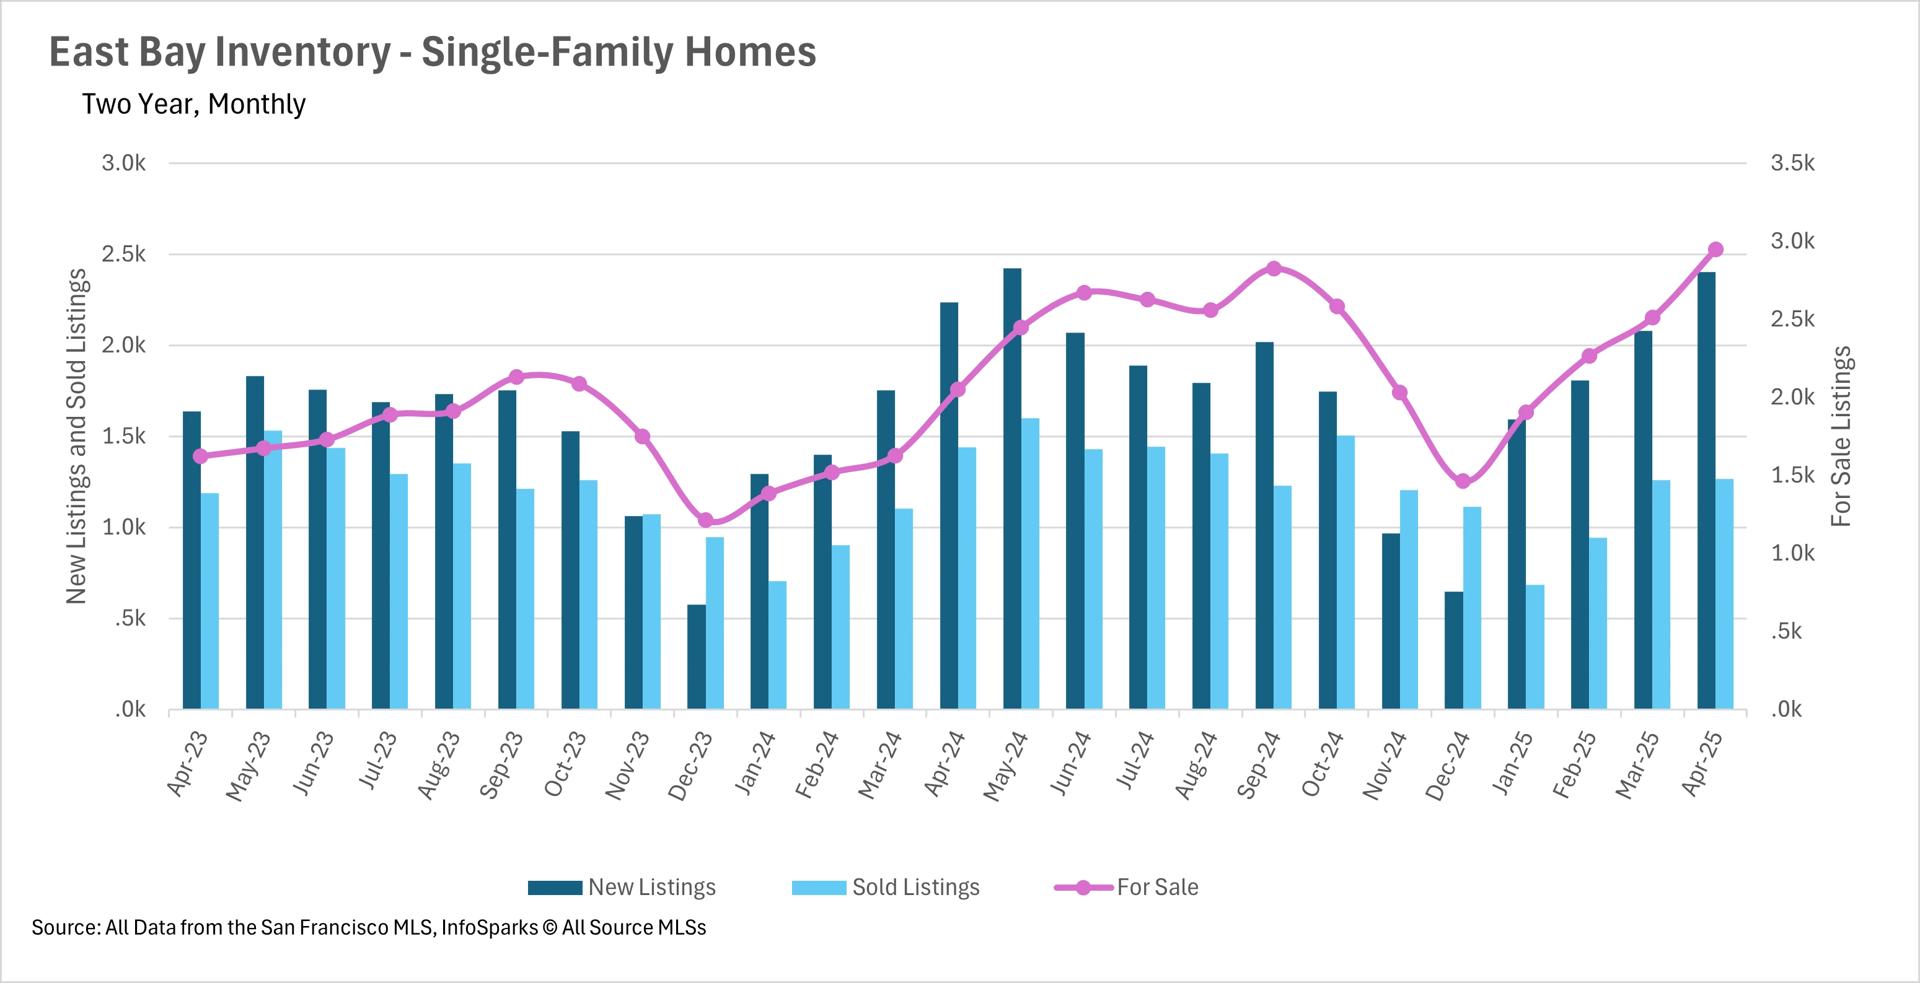
  • Inventory dynamics vary dramatically by region, with East Bay seeing substantial increases (~43%) while San Francisco continues to struggle with persistent shortages.
  • The single-family home market remains largely a seller's market across most Bay Area regions, while the condo market generally favors buyers with higher months of supply.
  • Despite varying inventory levels, homes are still selling relatively quickly throughout the Bay Area, with particularly fast movement in Silicon Valley (8-15 days).

Note: You can find the charts/graphs for the Local Lowdown at the end of this section.

Price Trends Vary Significantly Across Bay Area Regions

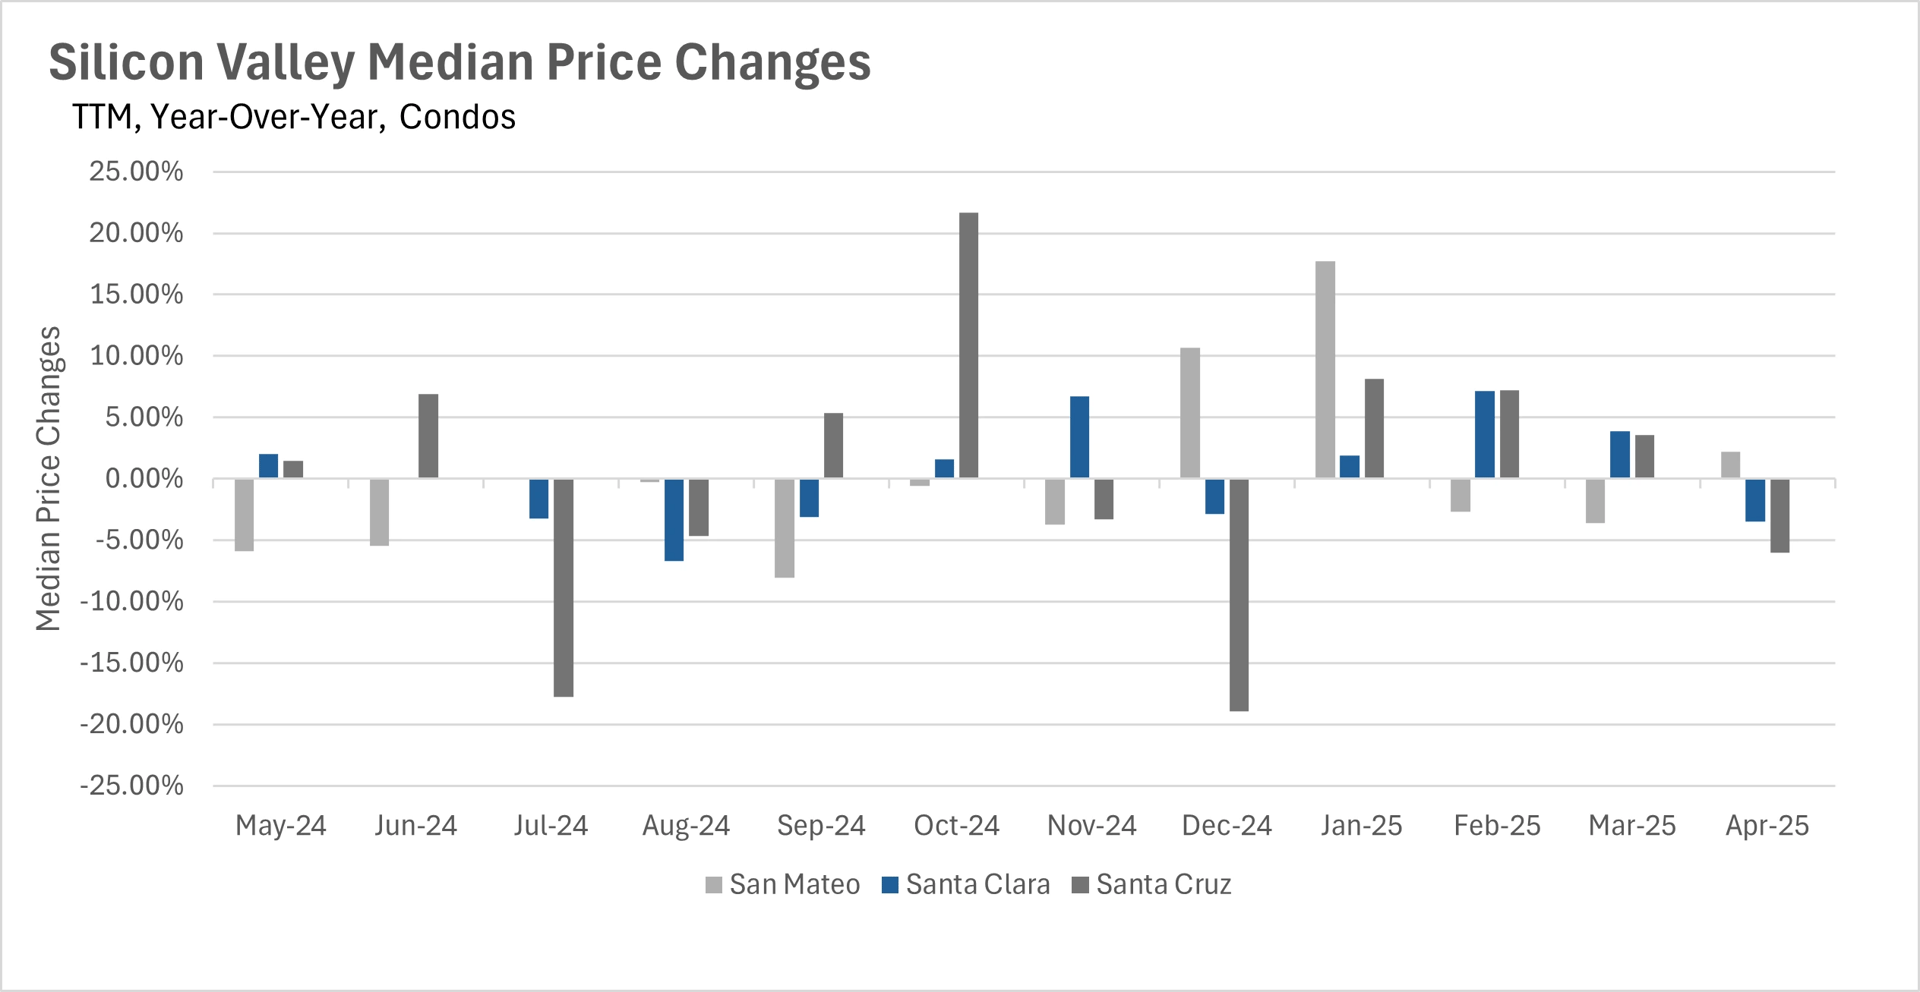
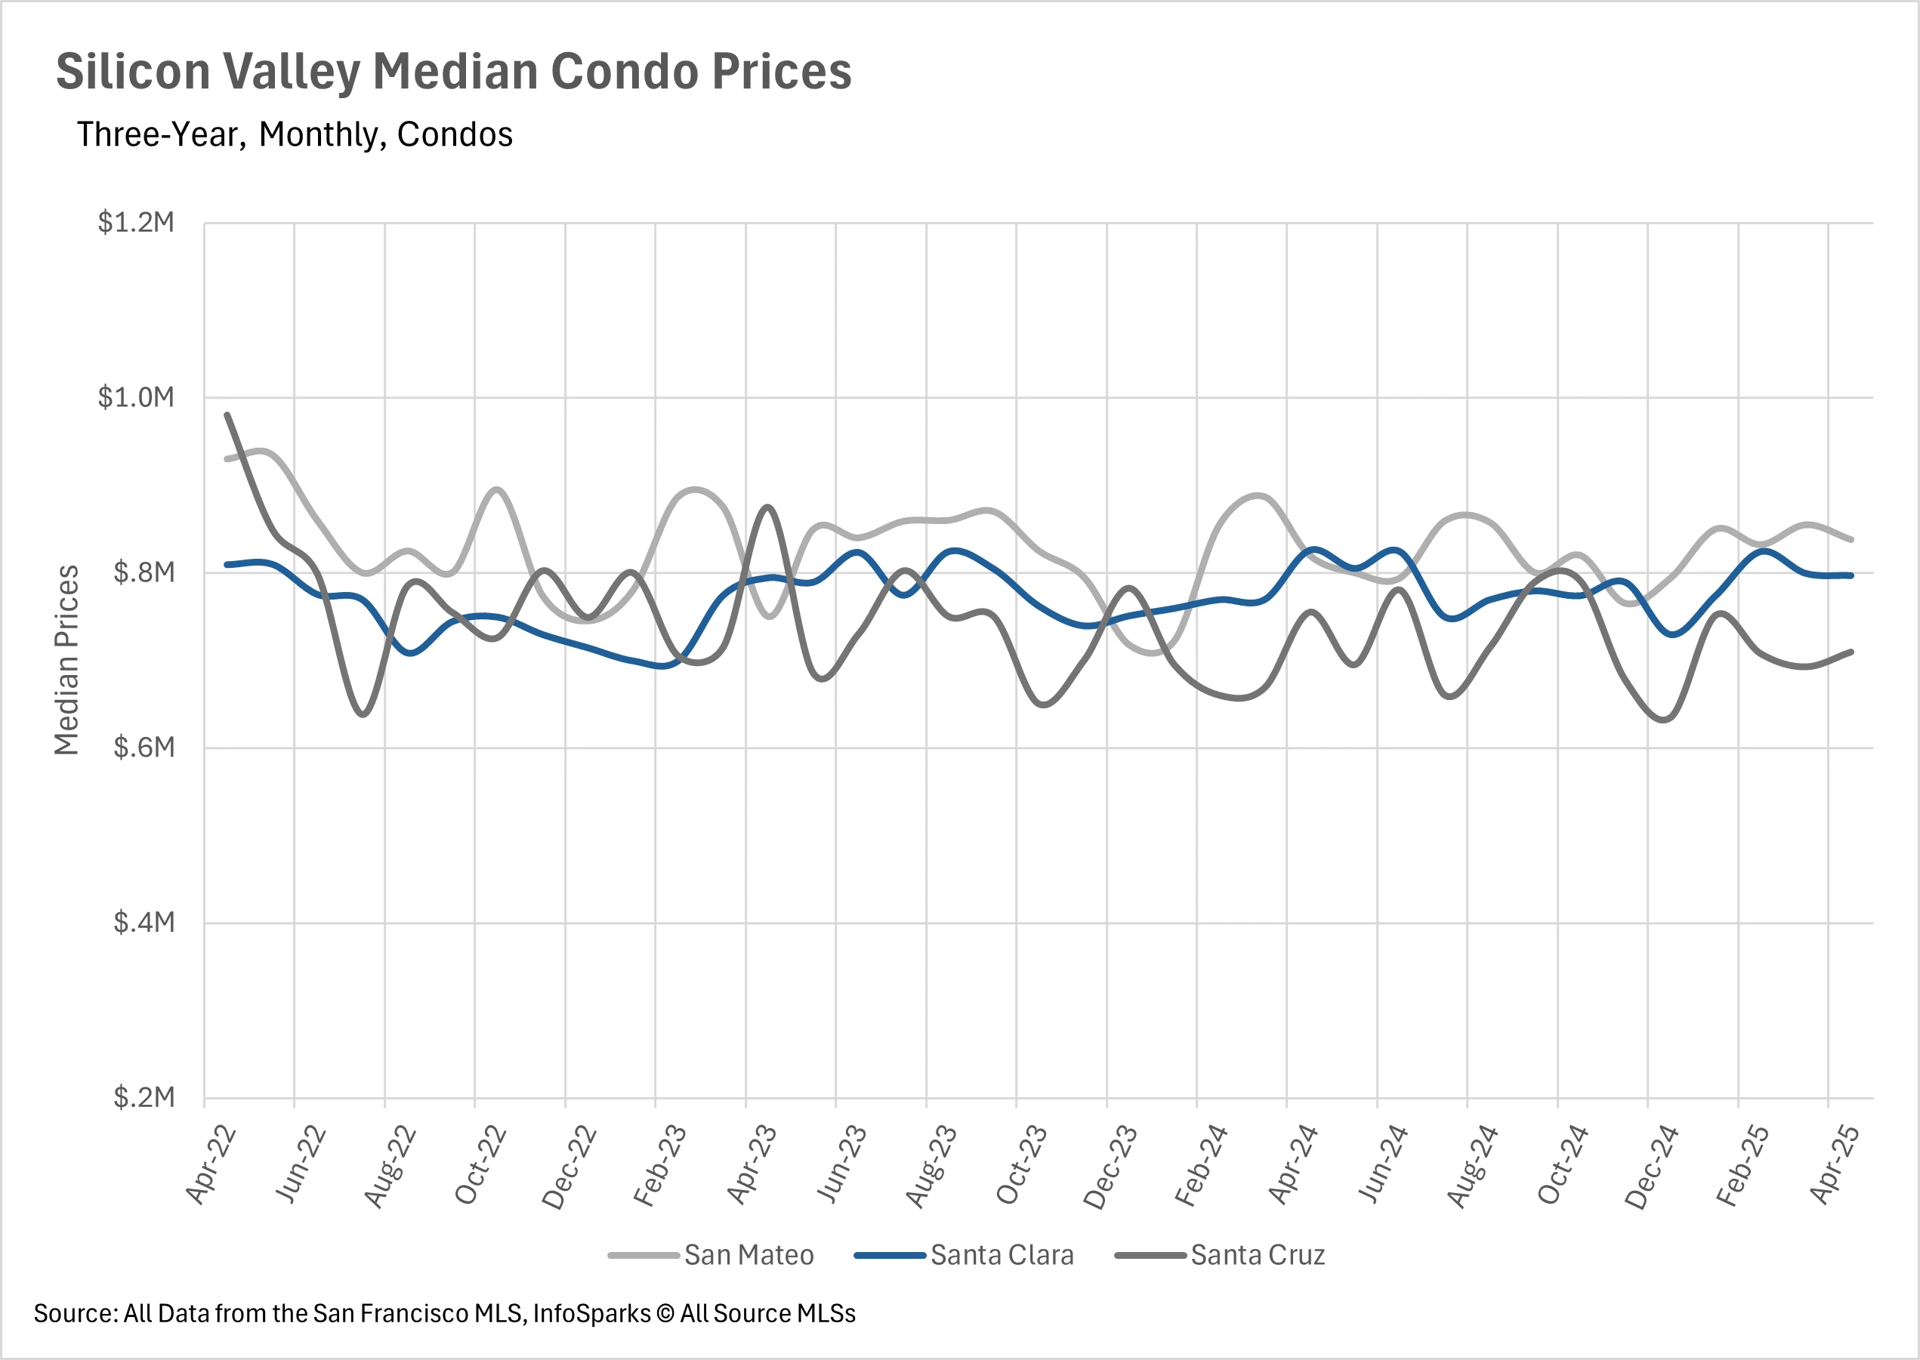
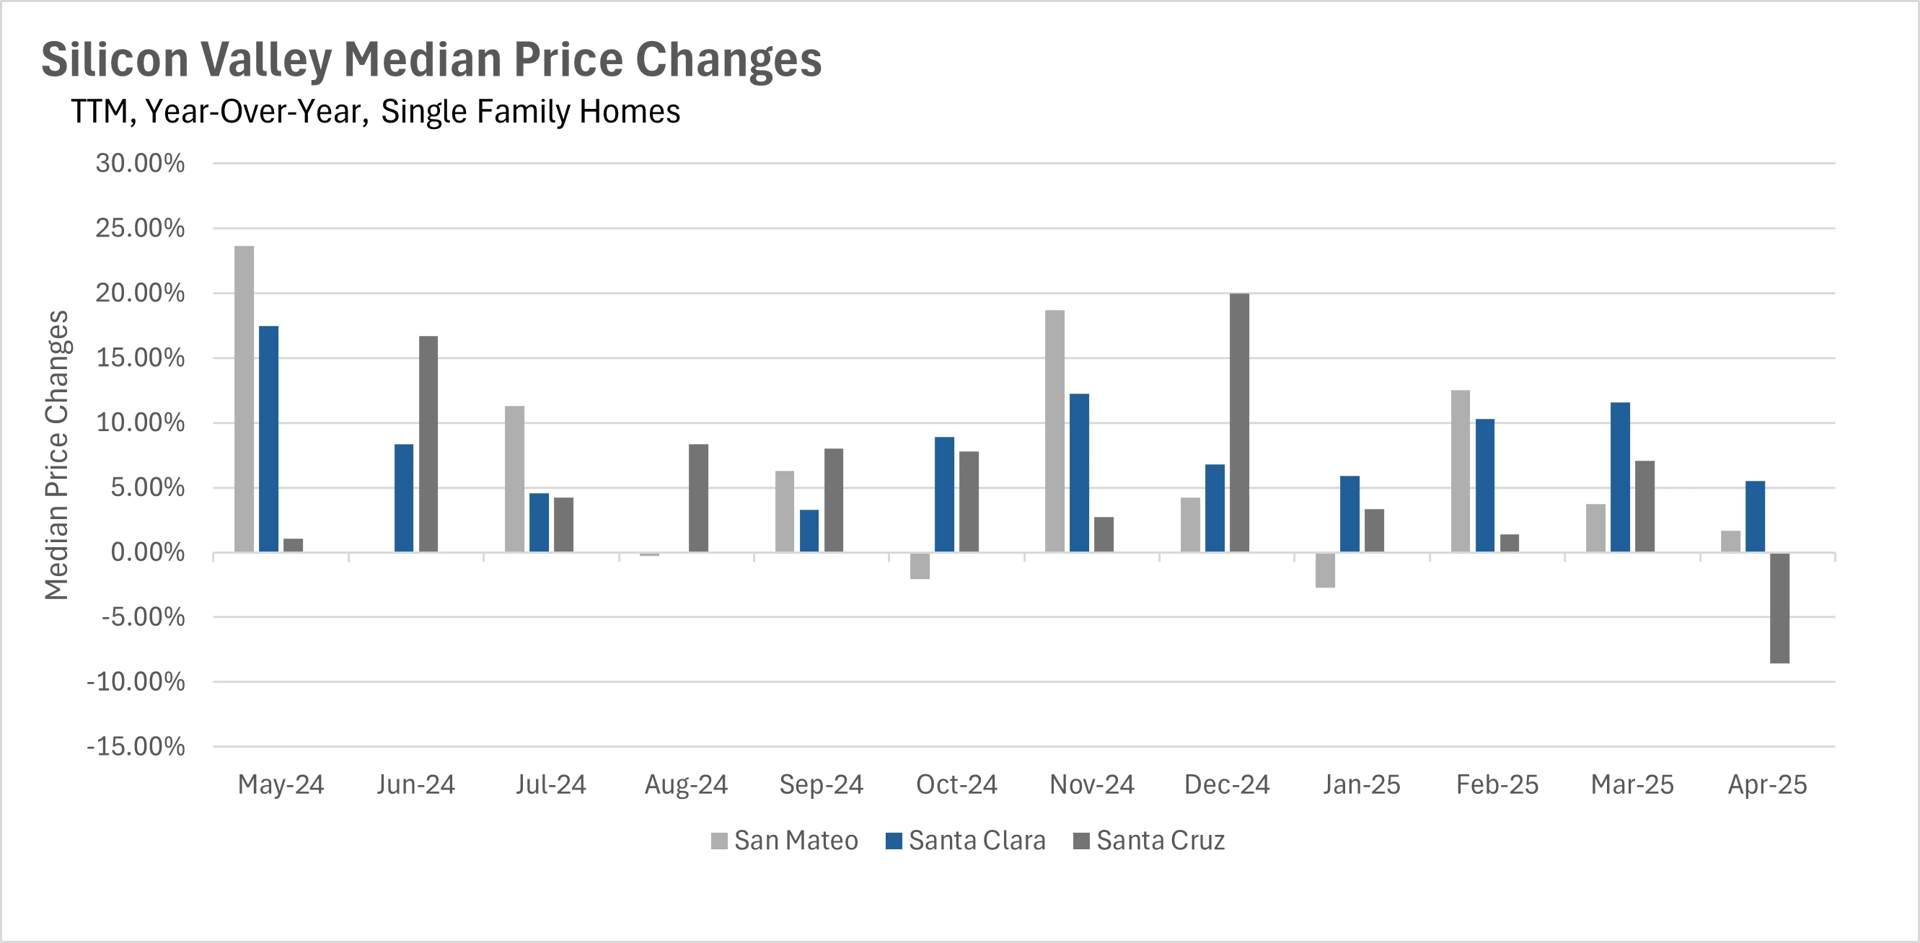
April showed considerable variation in price trends across the Bay Area. Silicon Valley presented a mixed picture, with Santa Cruz County breaking its year-long winning streak as median sale prices fell 8.57% year-over-year, while San Mateo and Santa Clara Counties continued positive growth at 1.69% and 5.50% respectively.

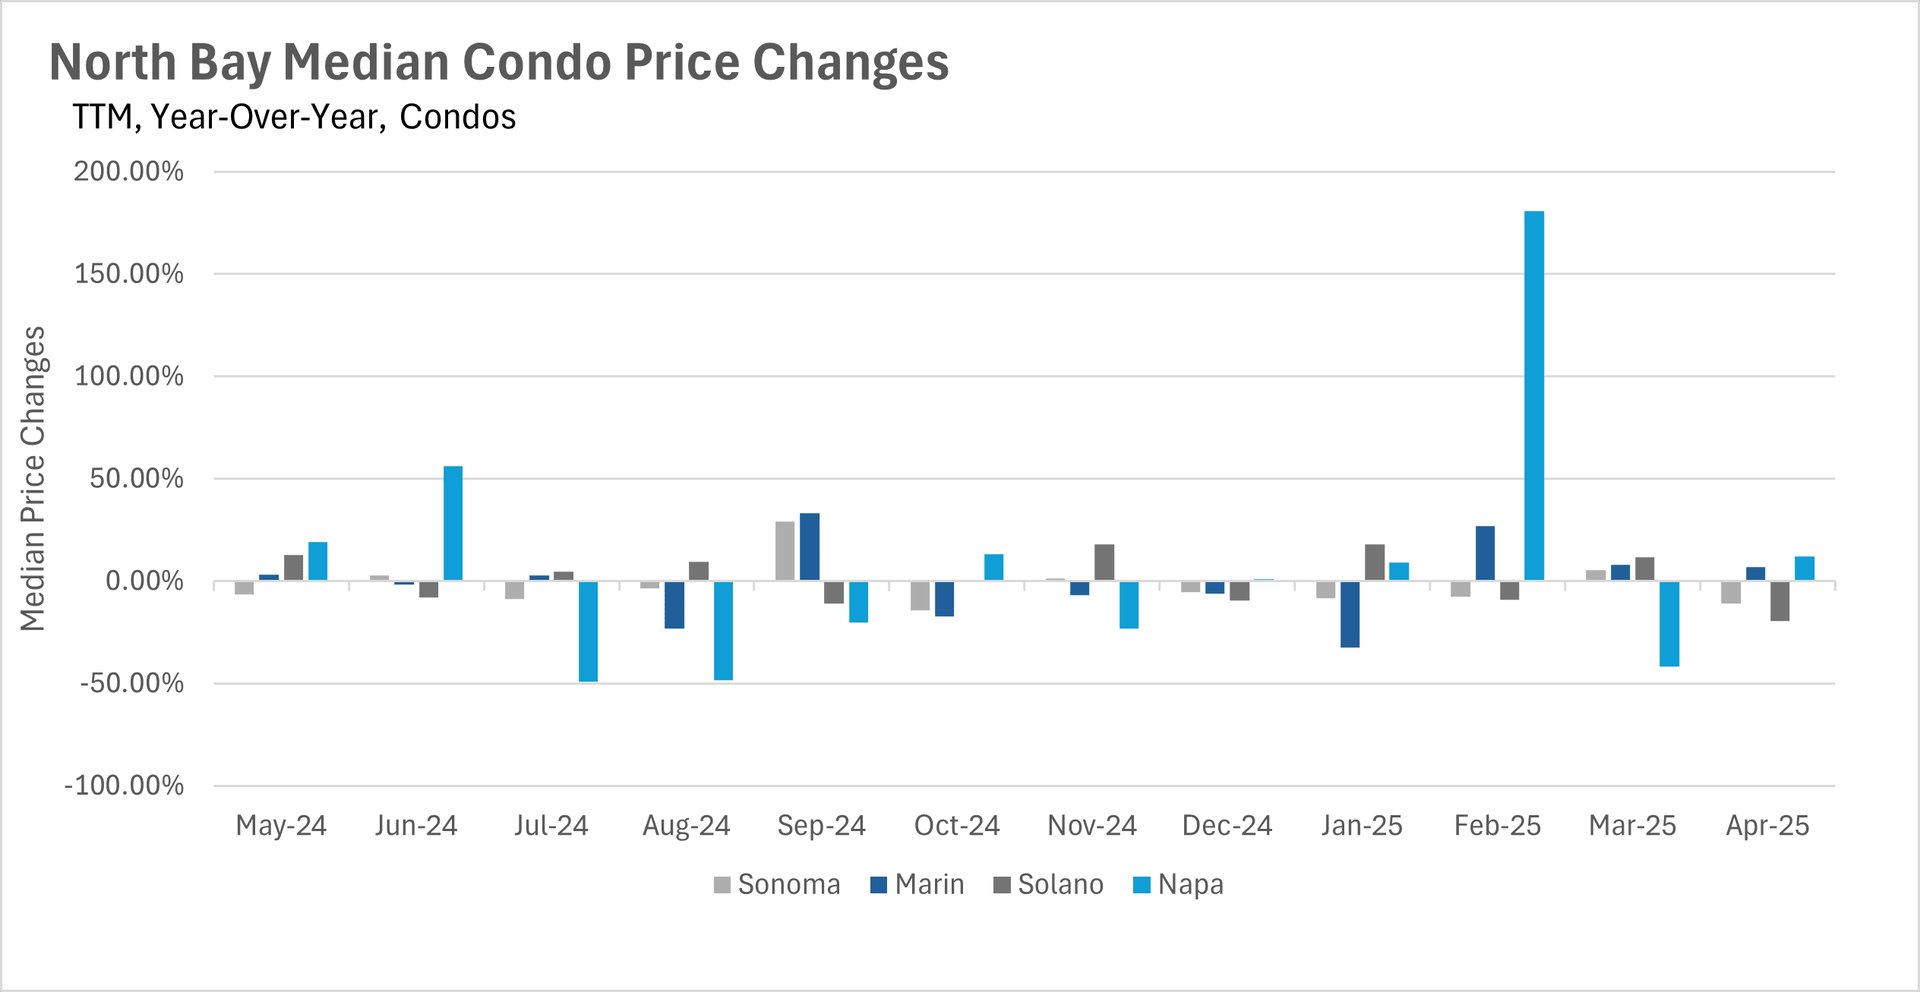
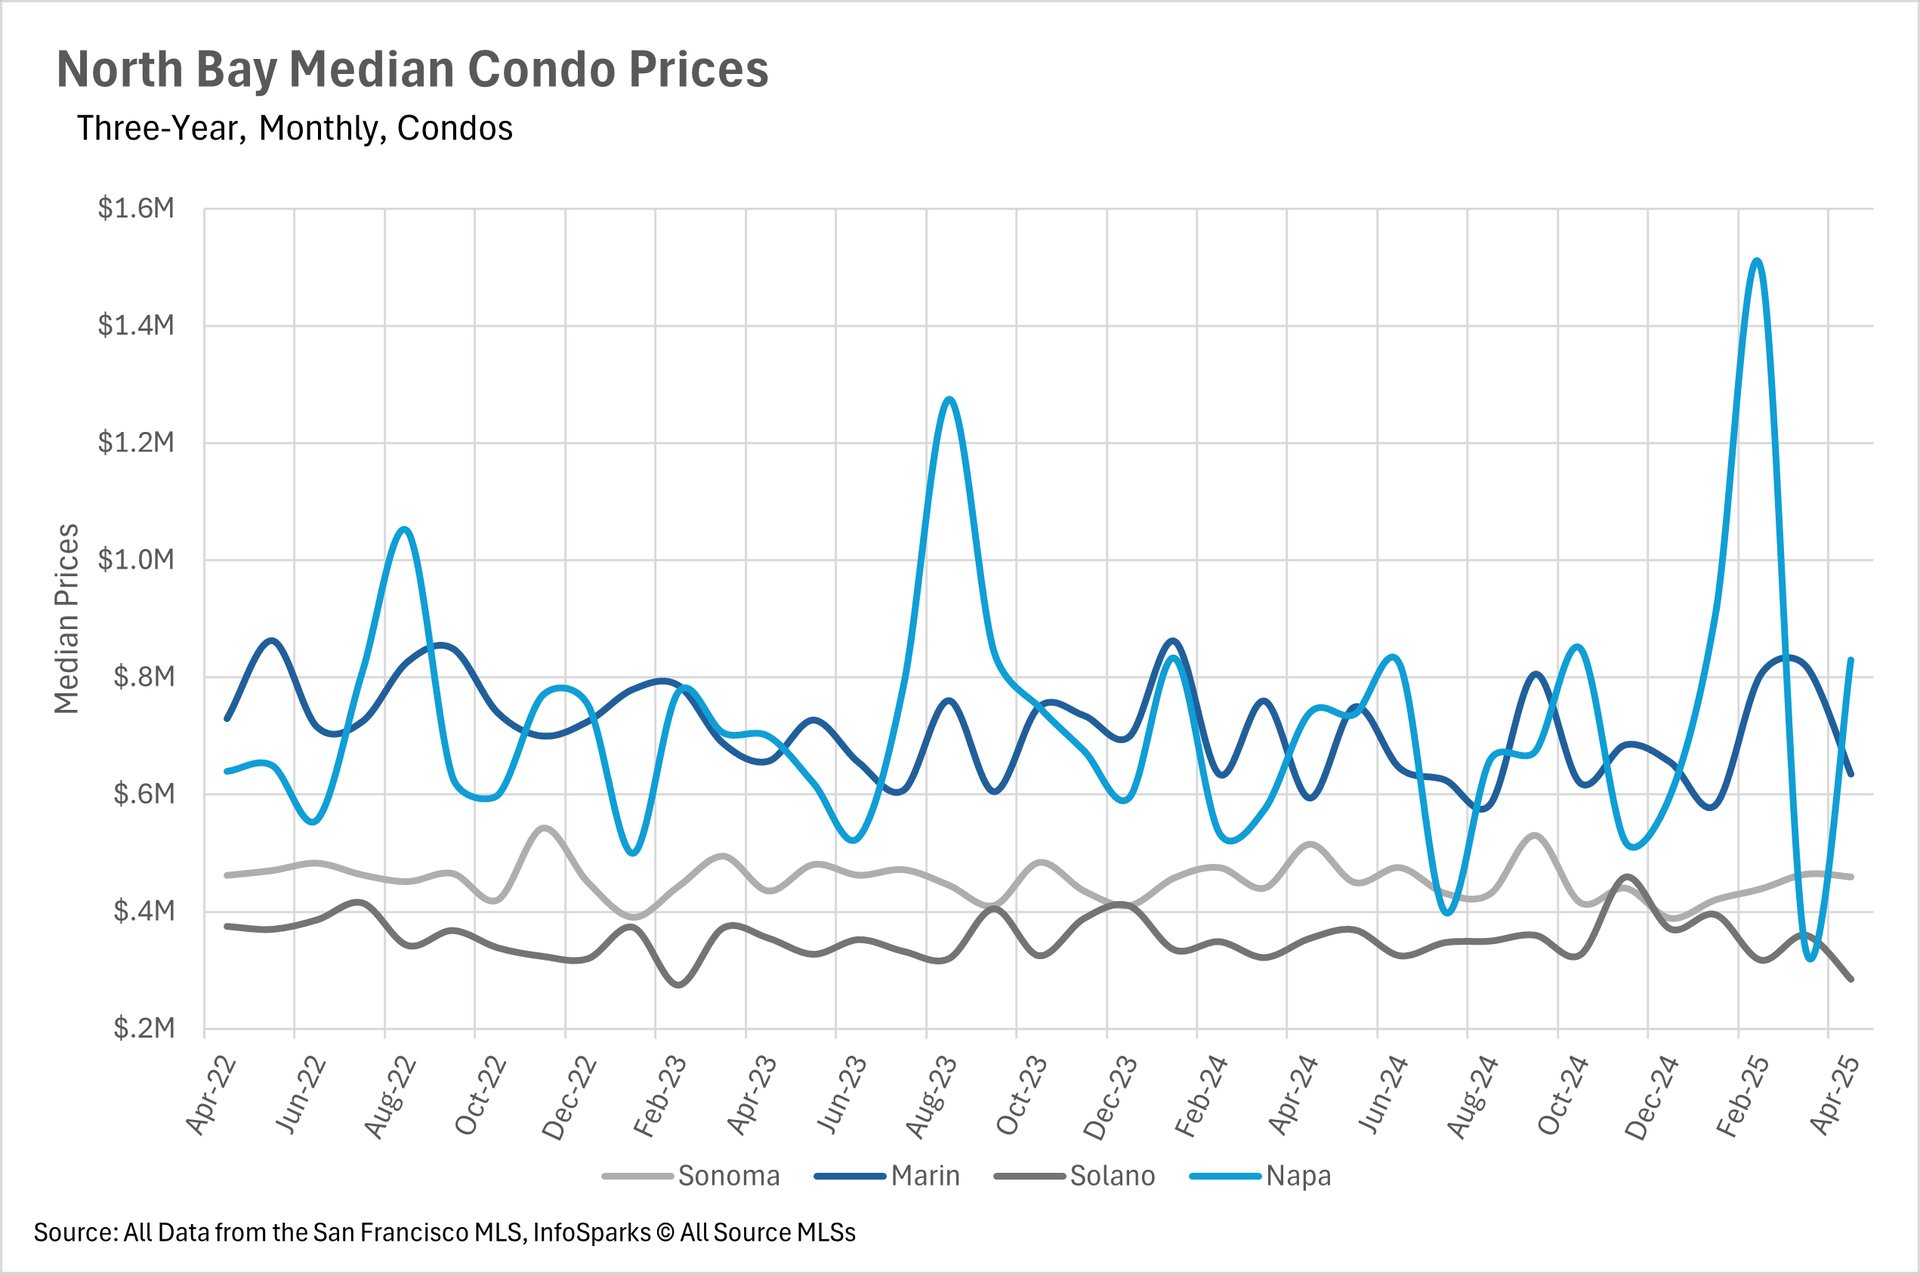
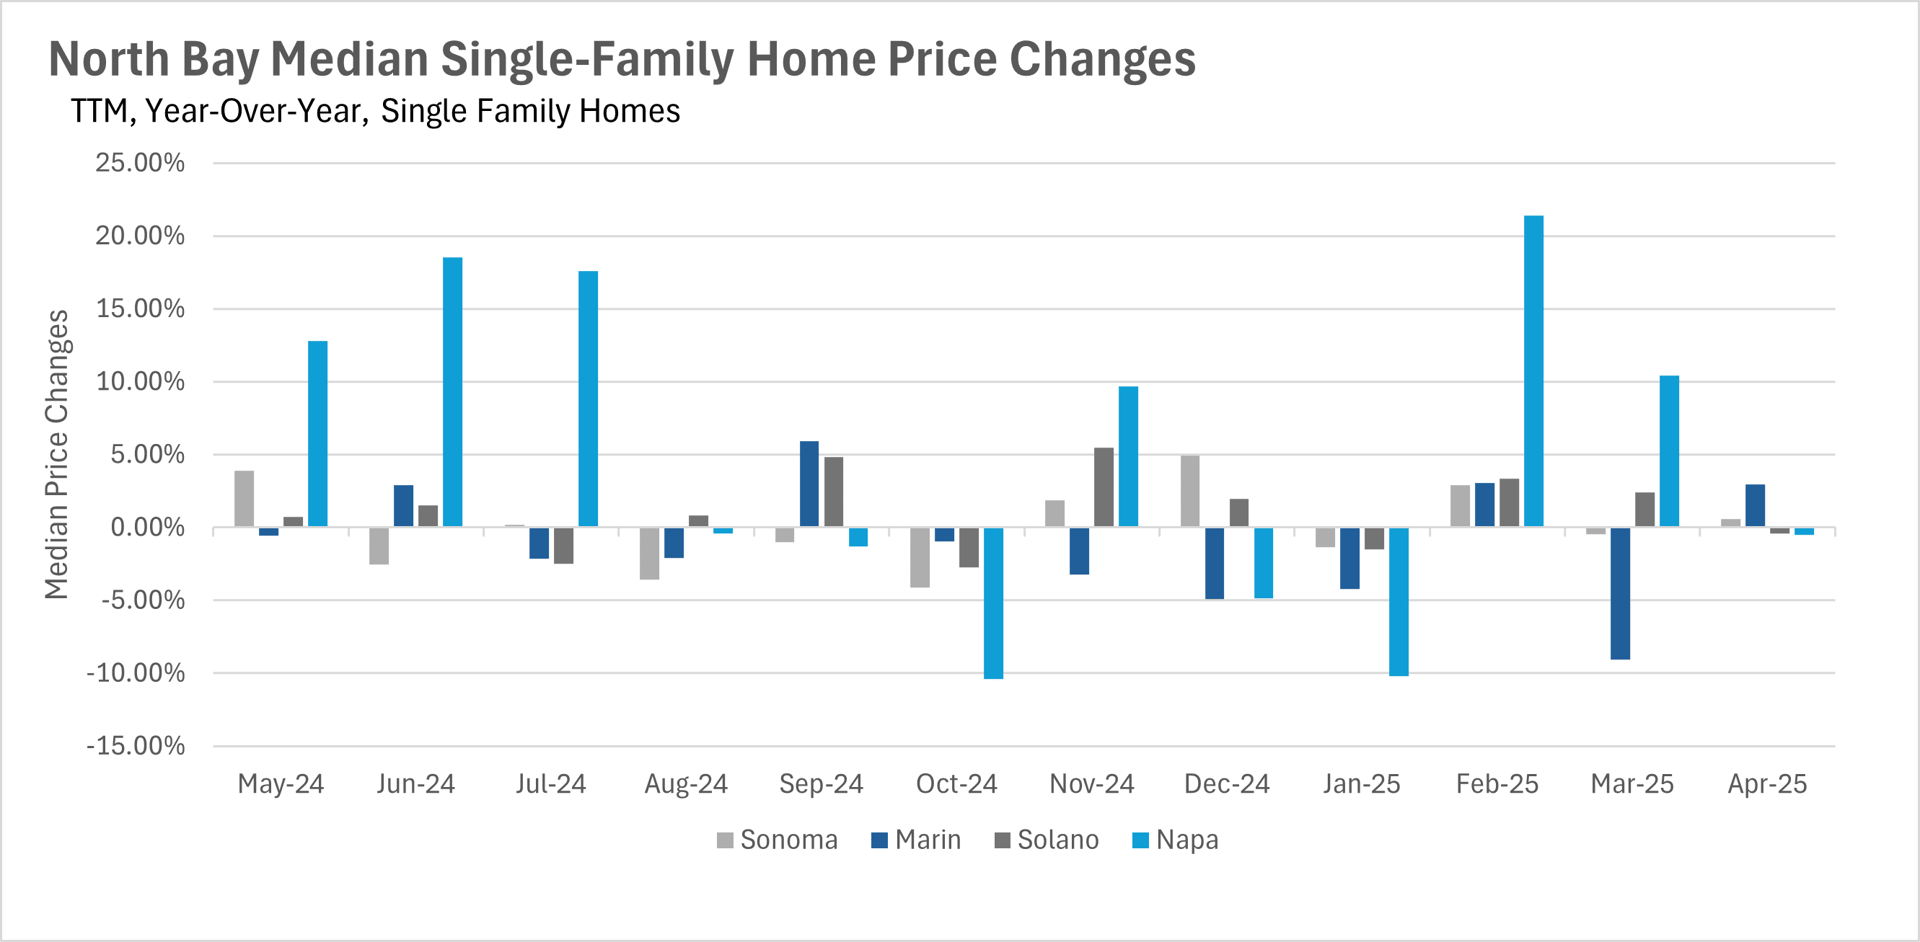
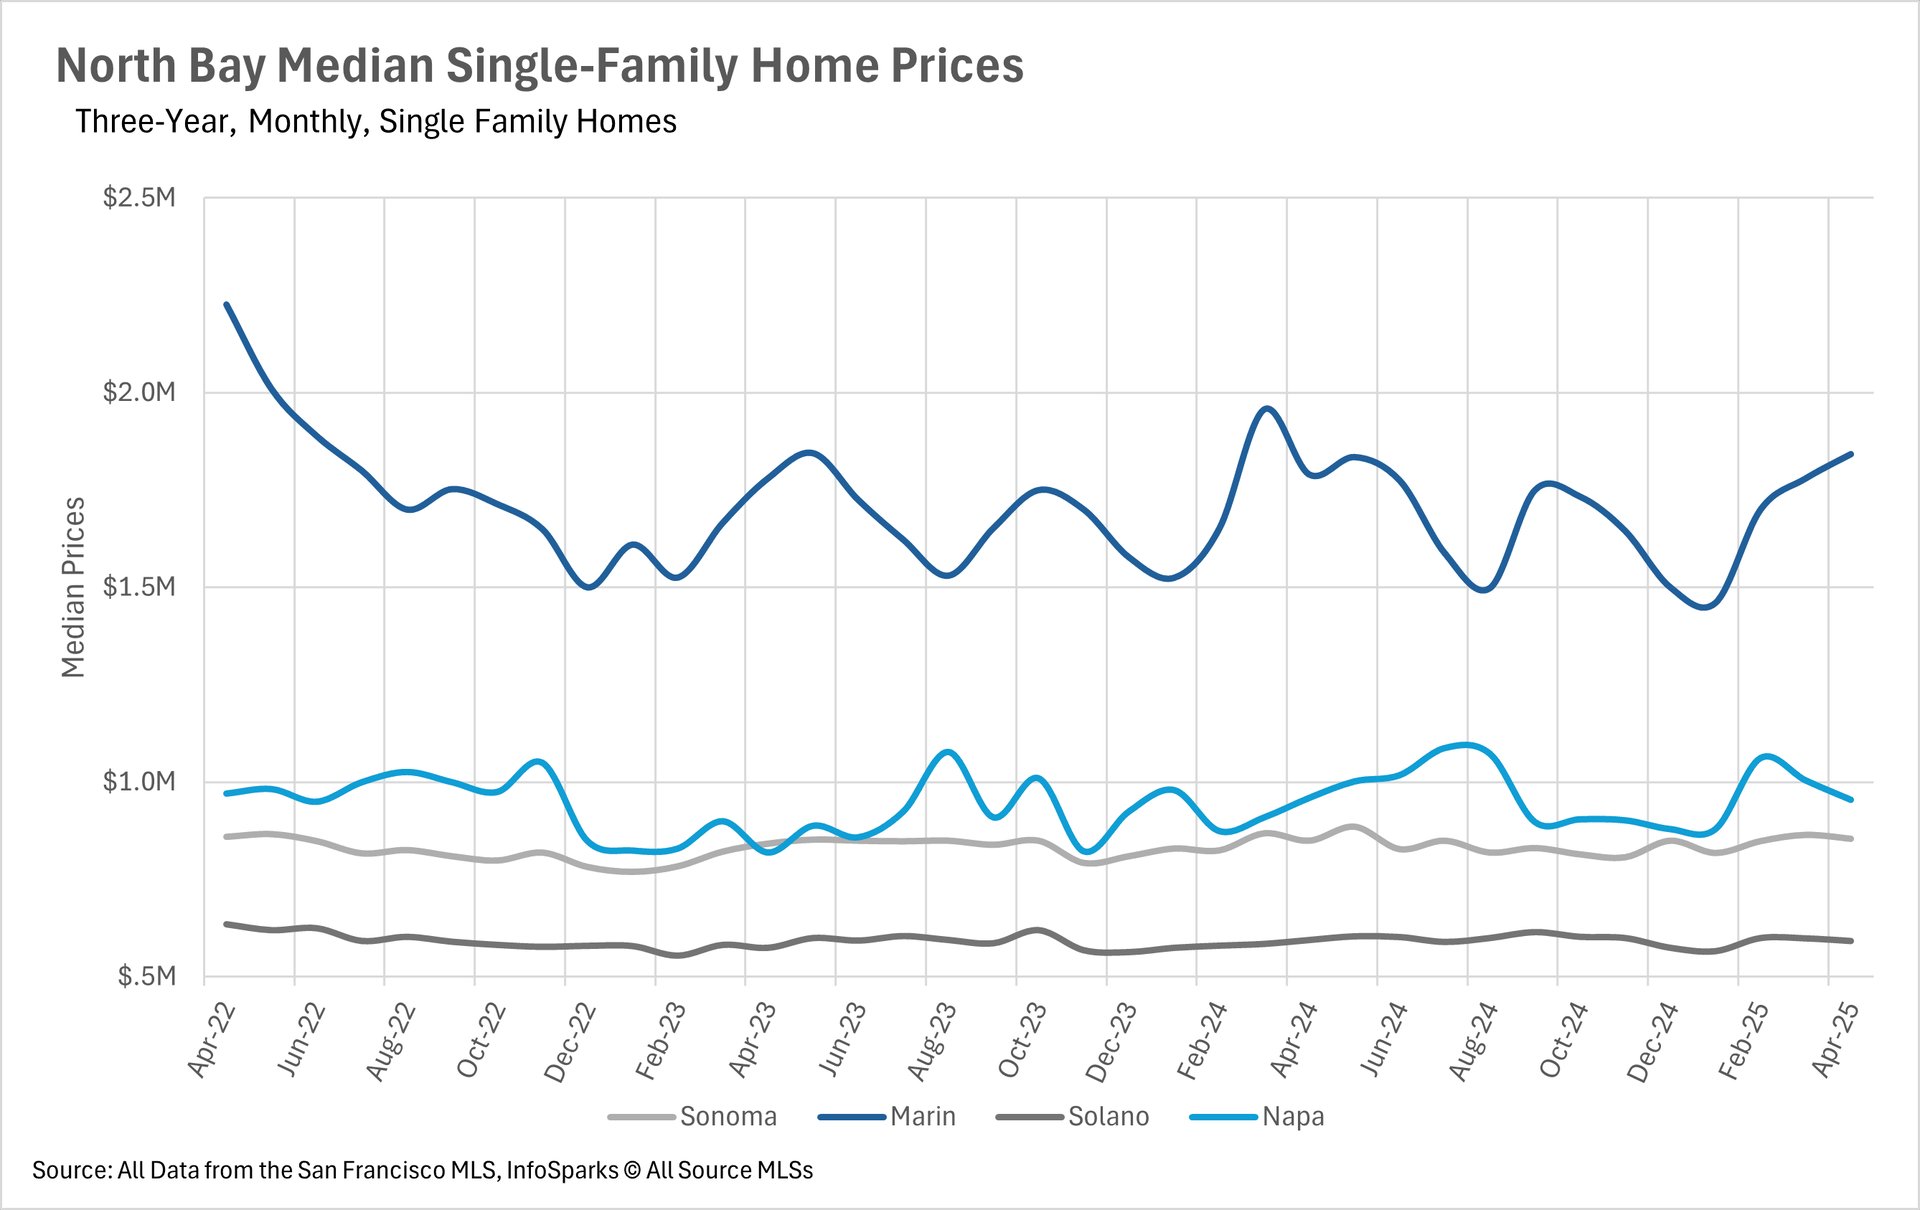
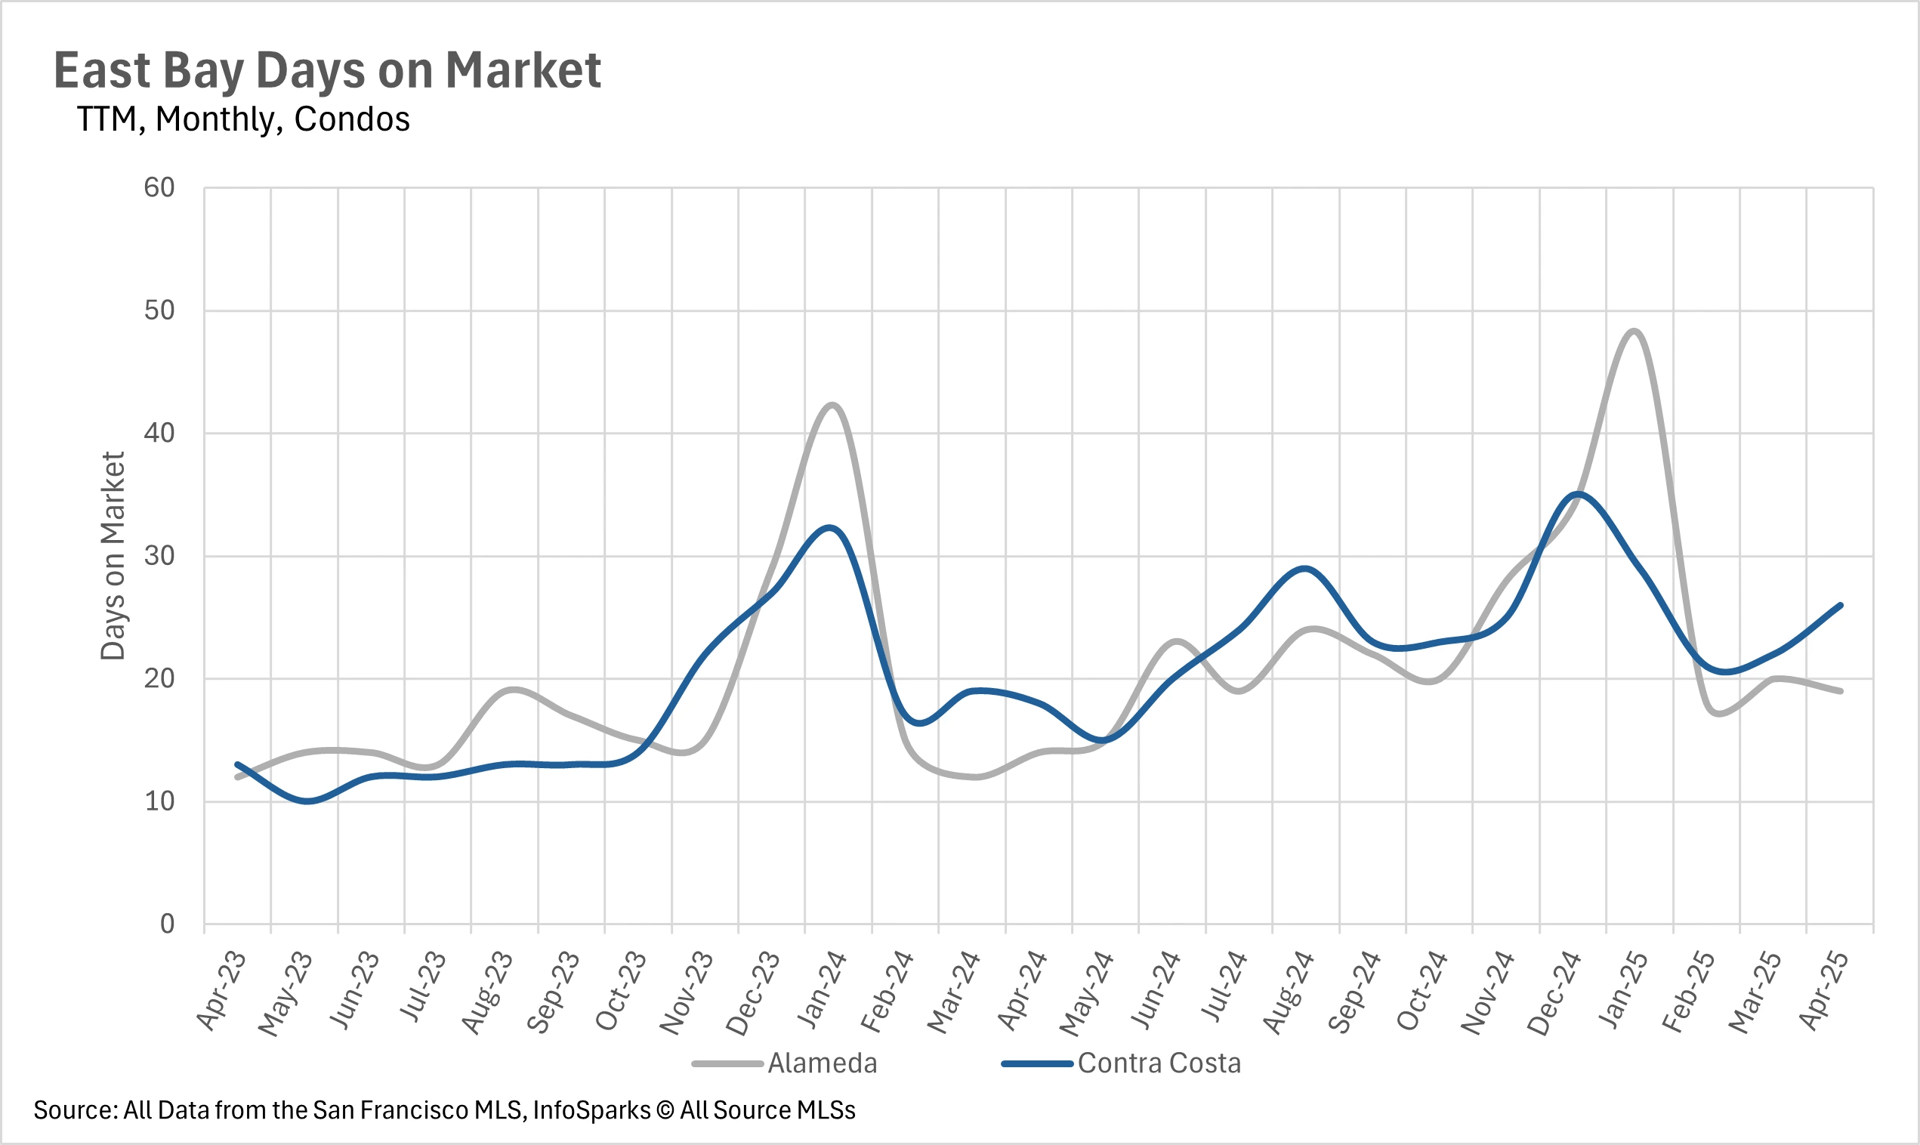
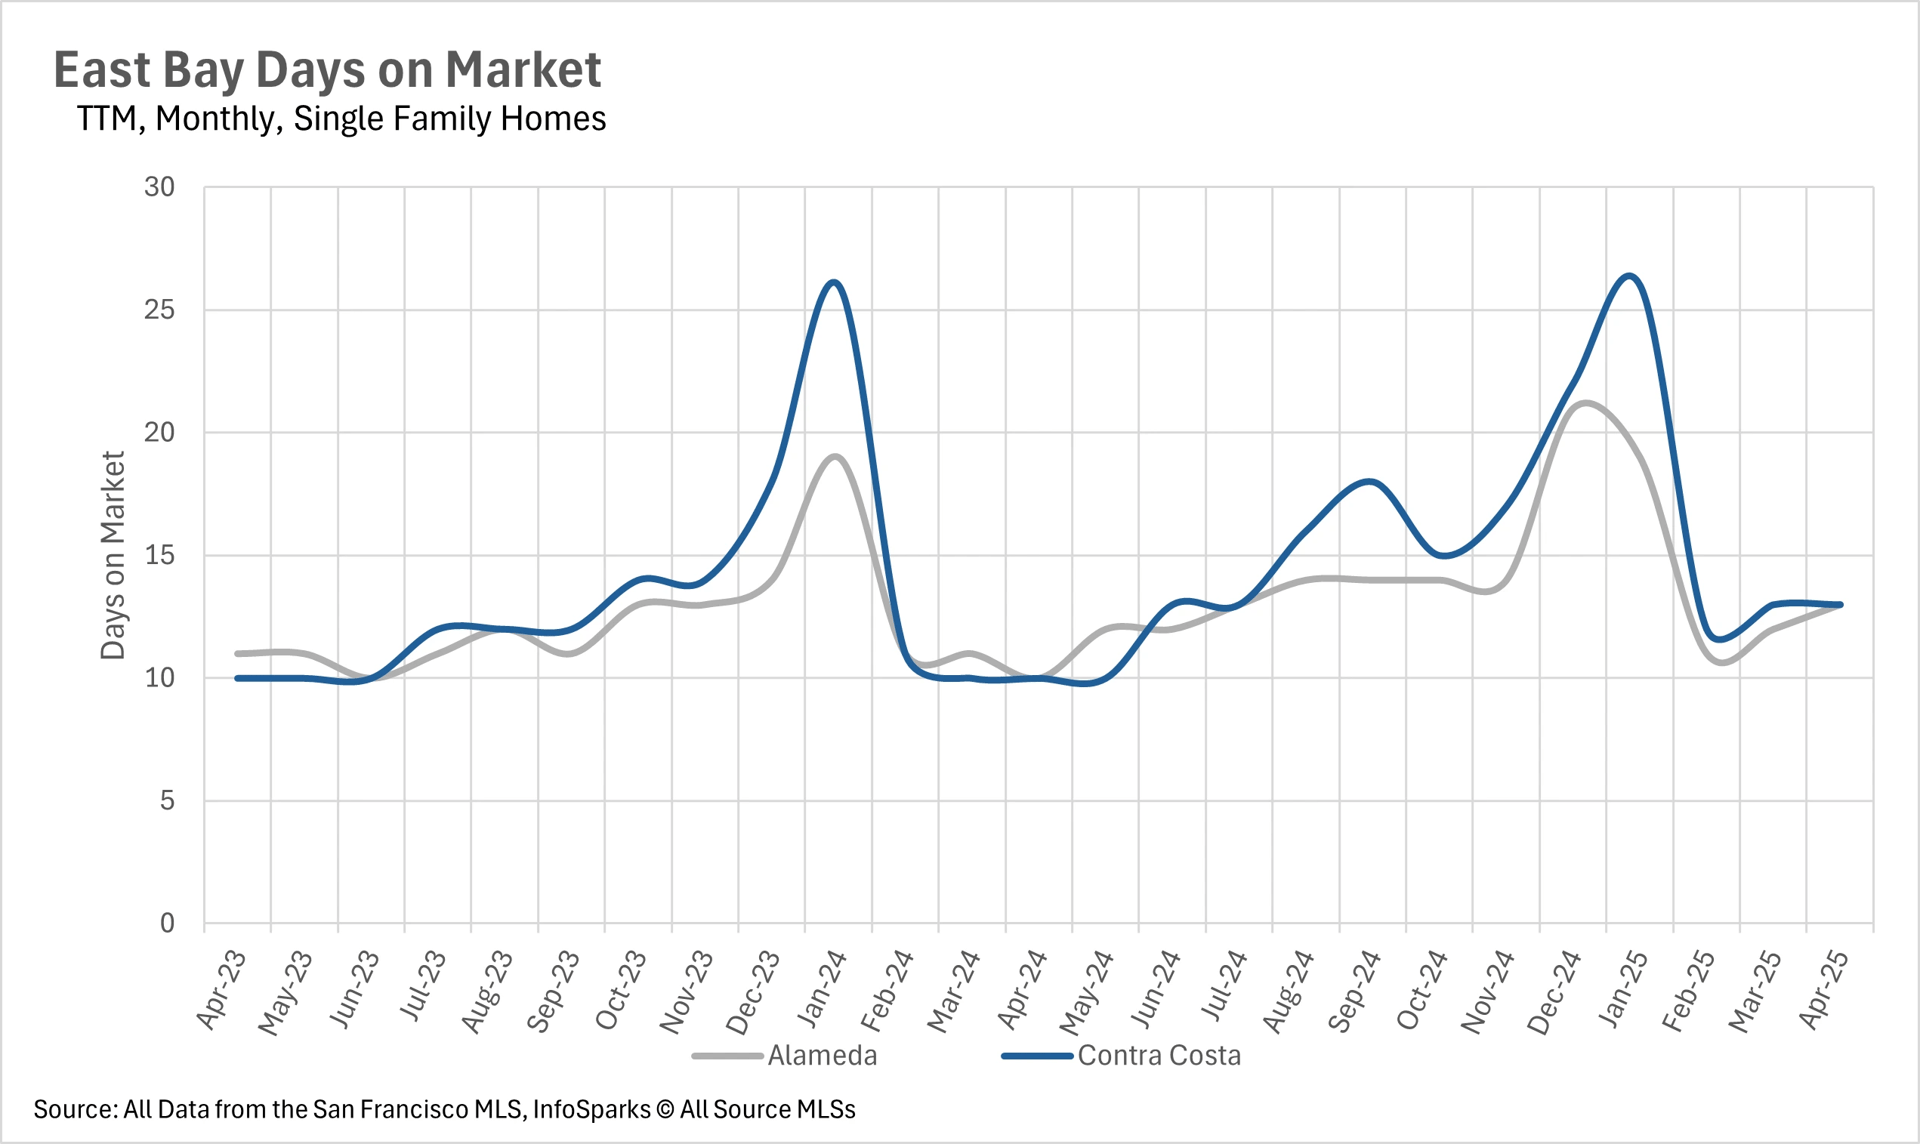
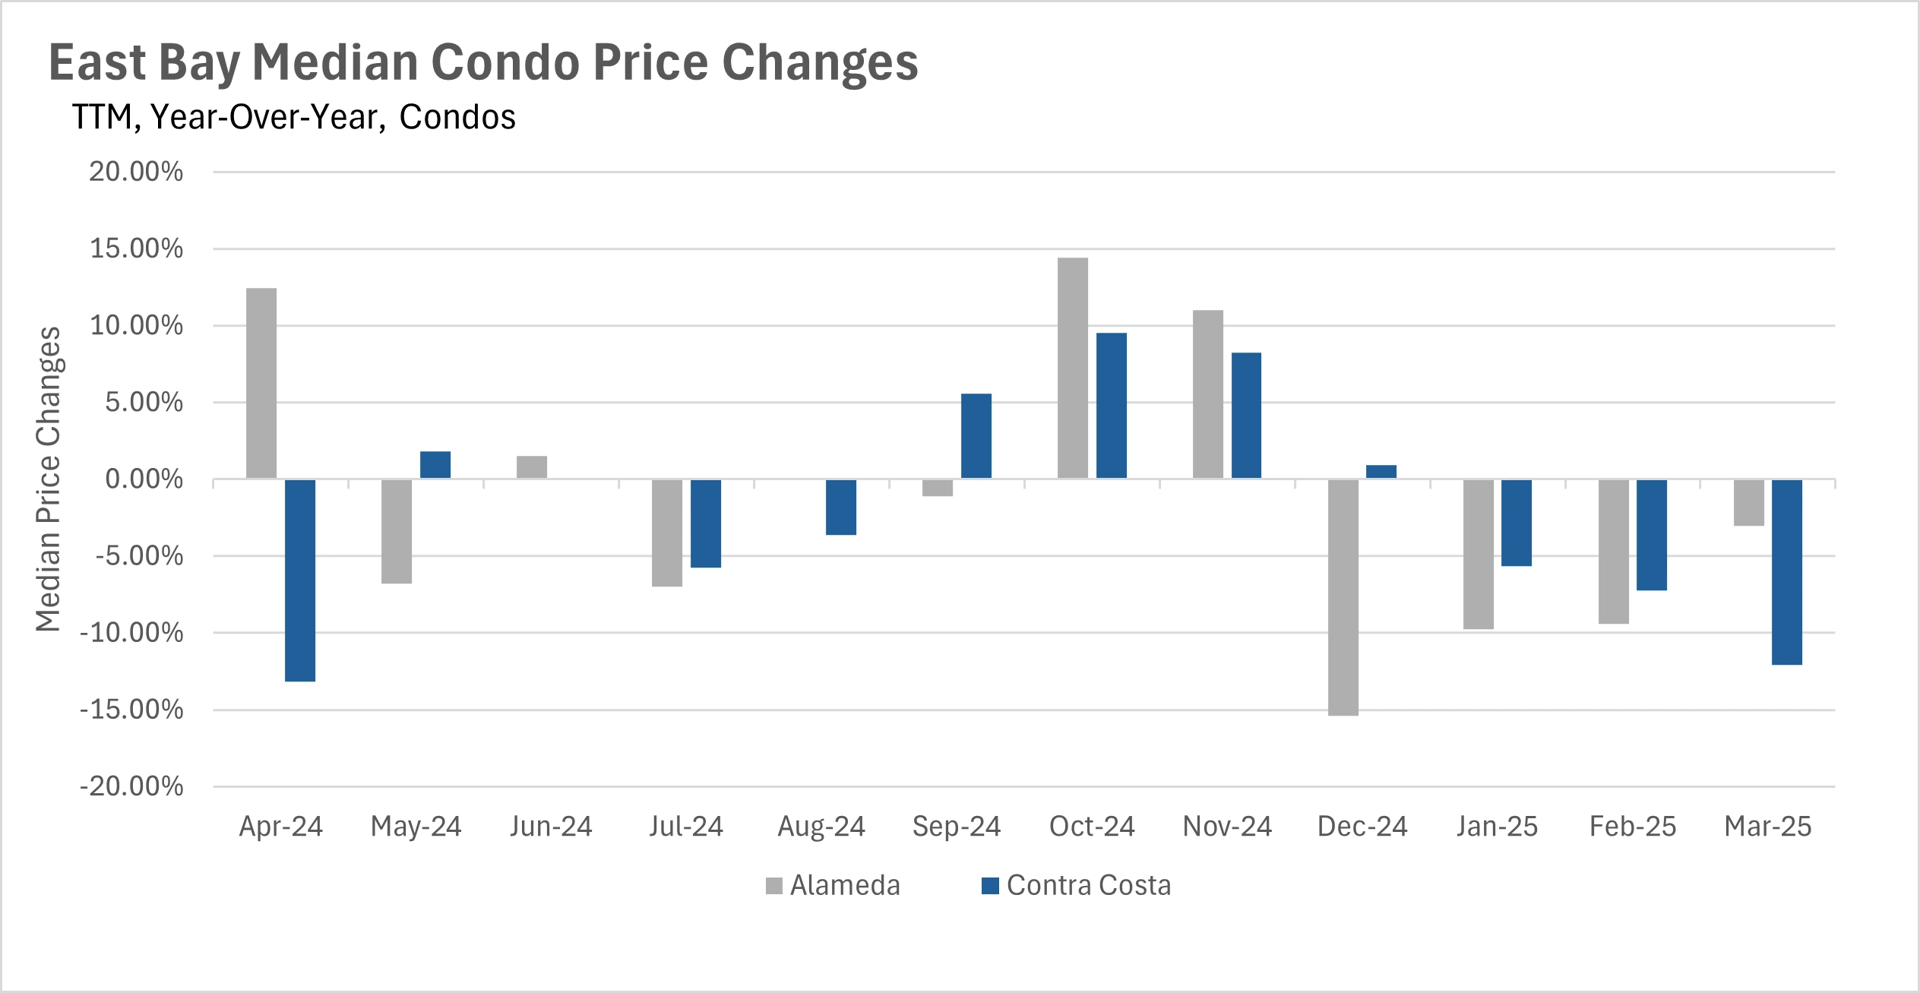
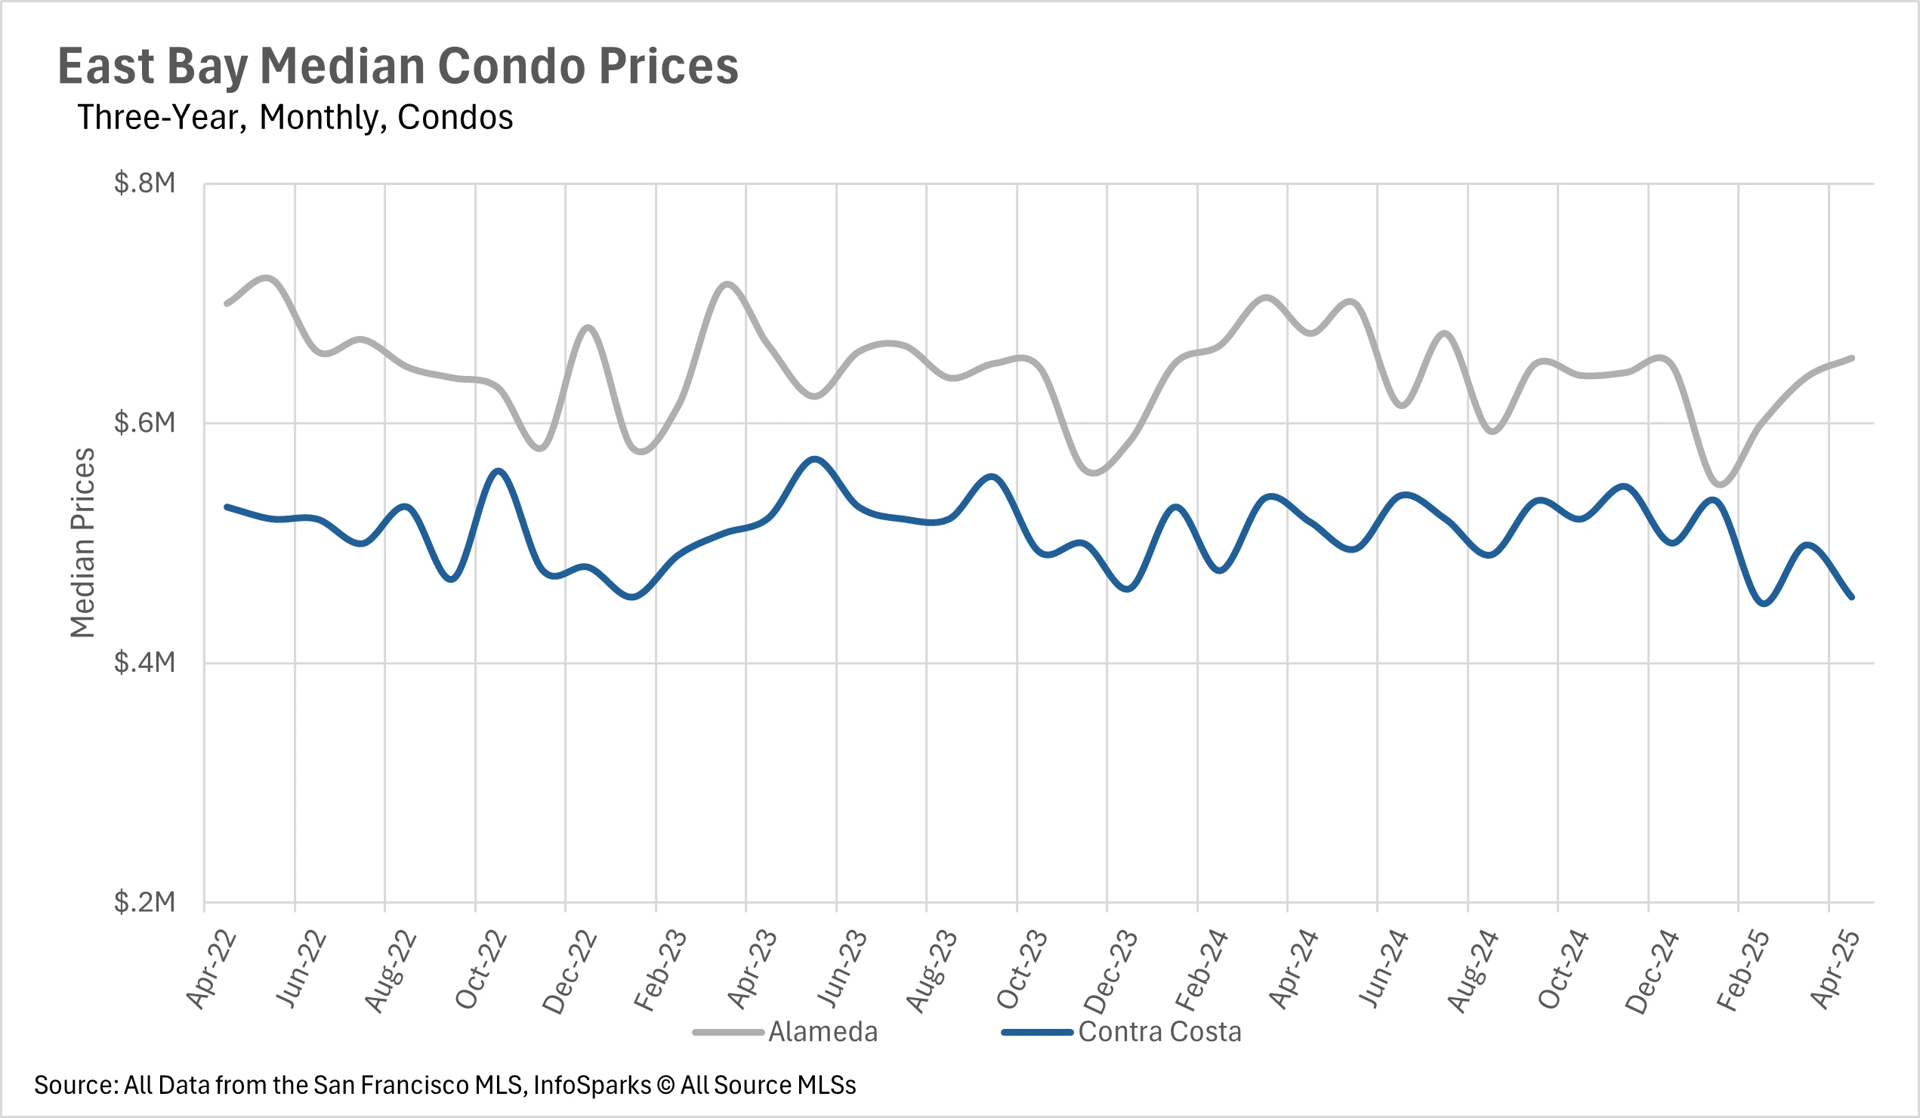
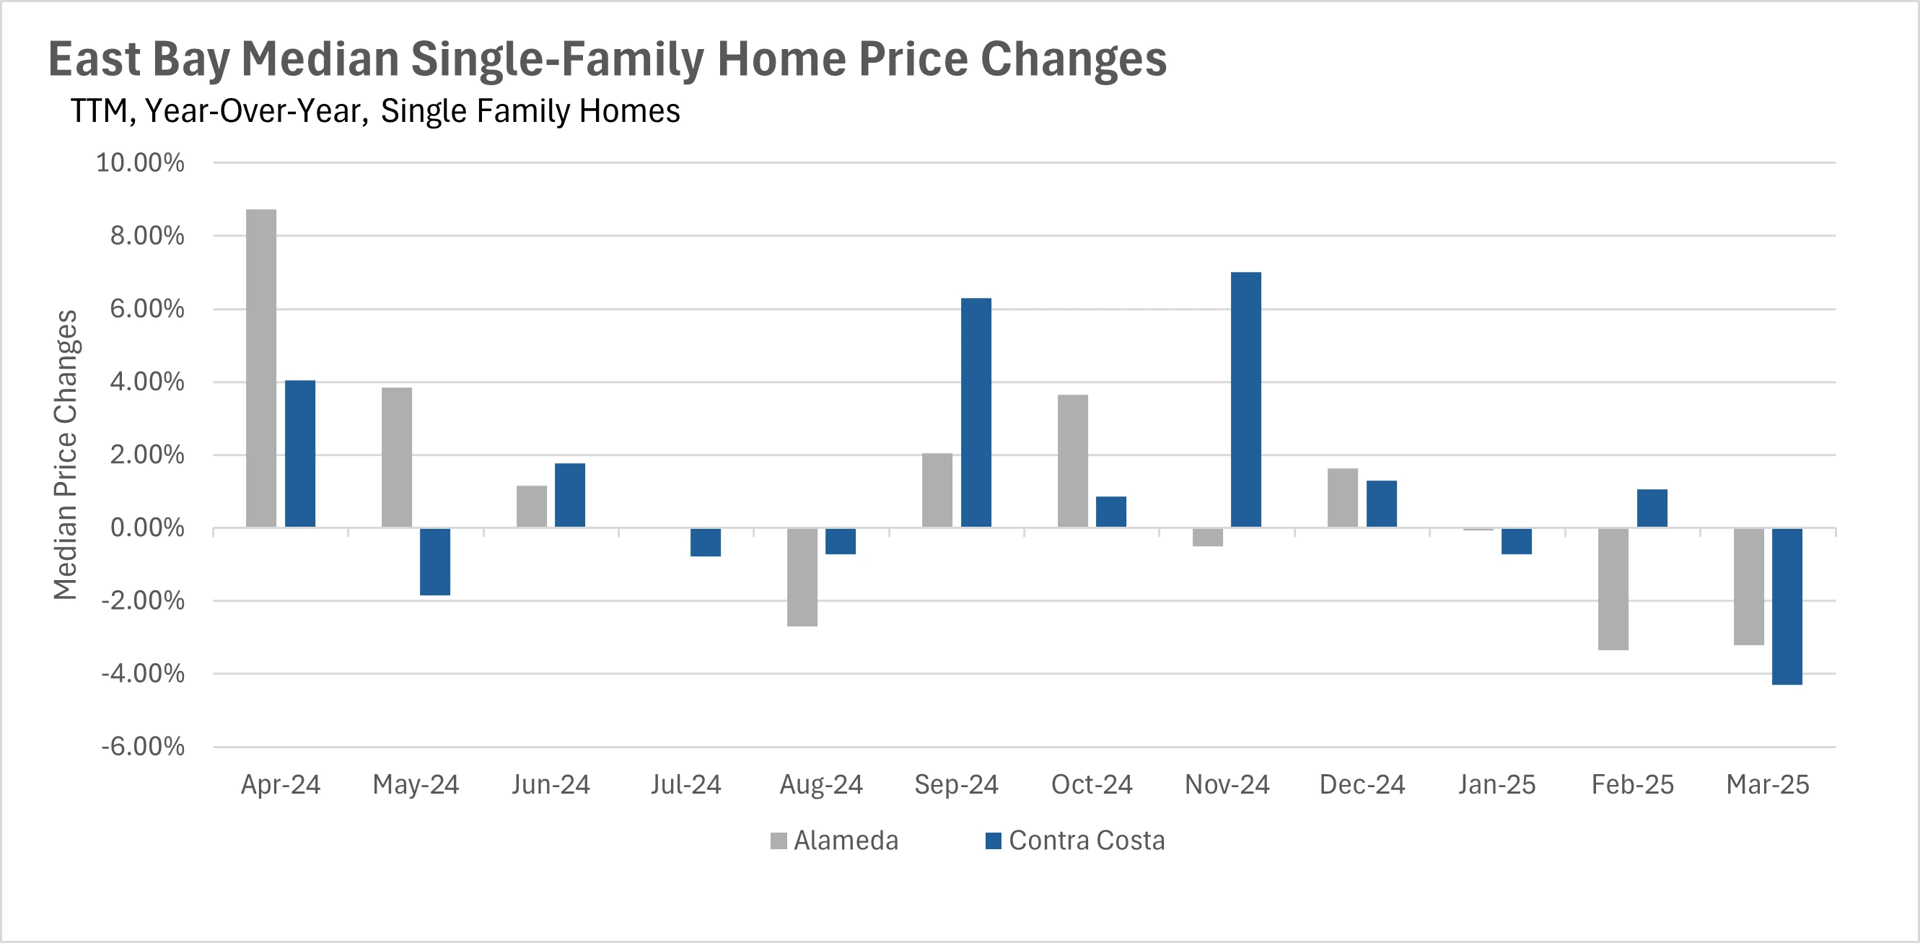
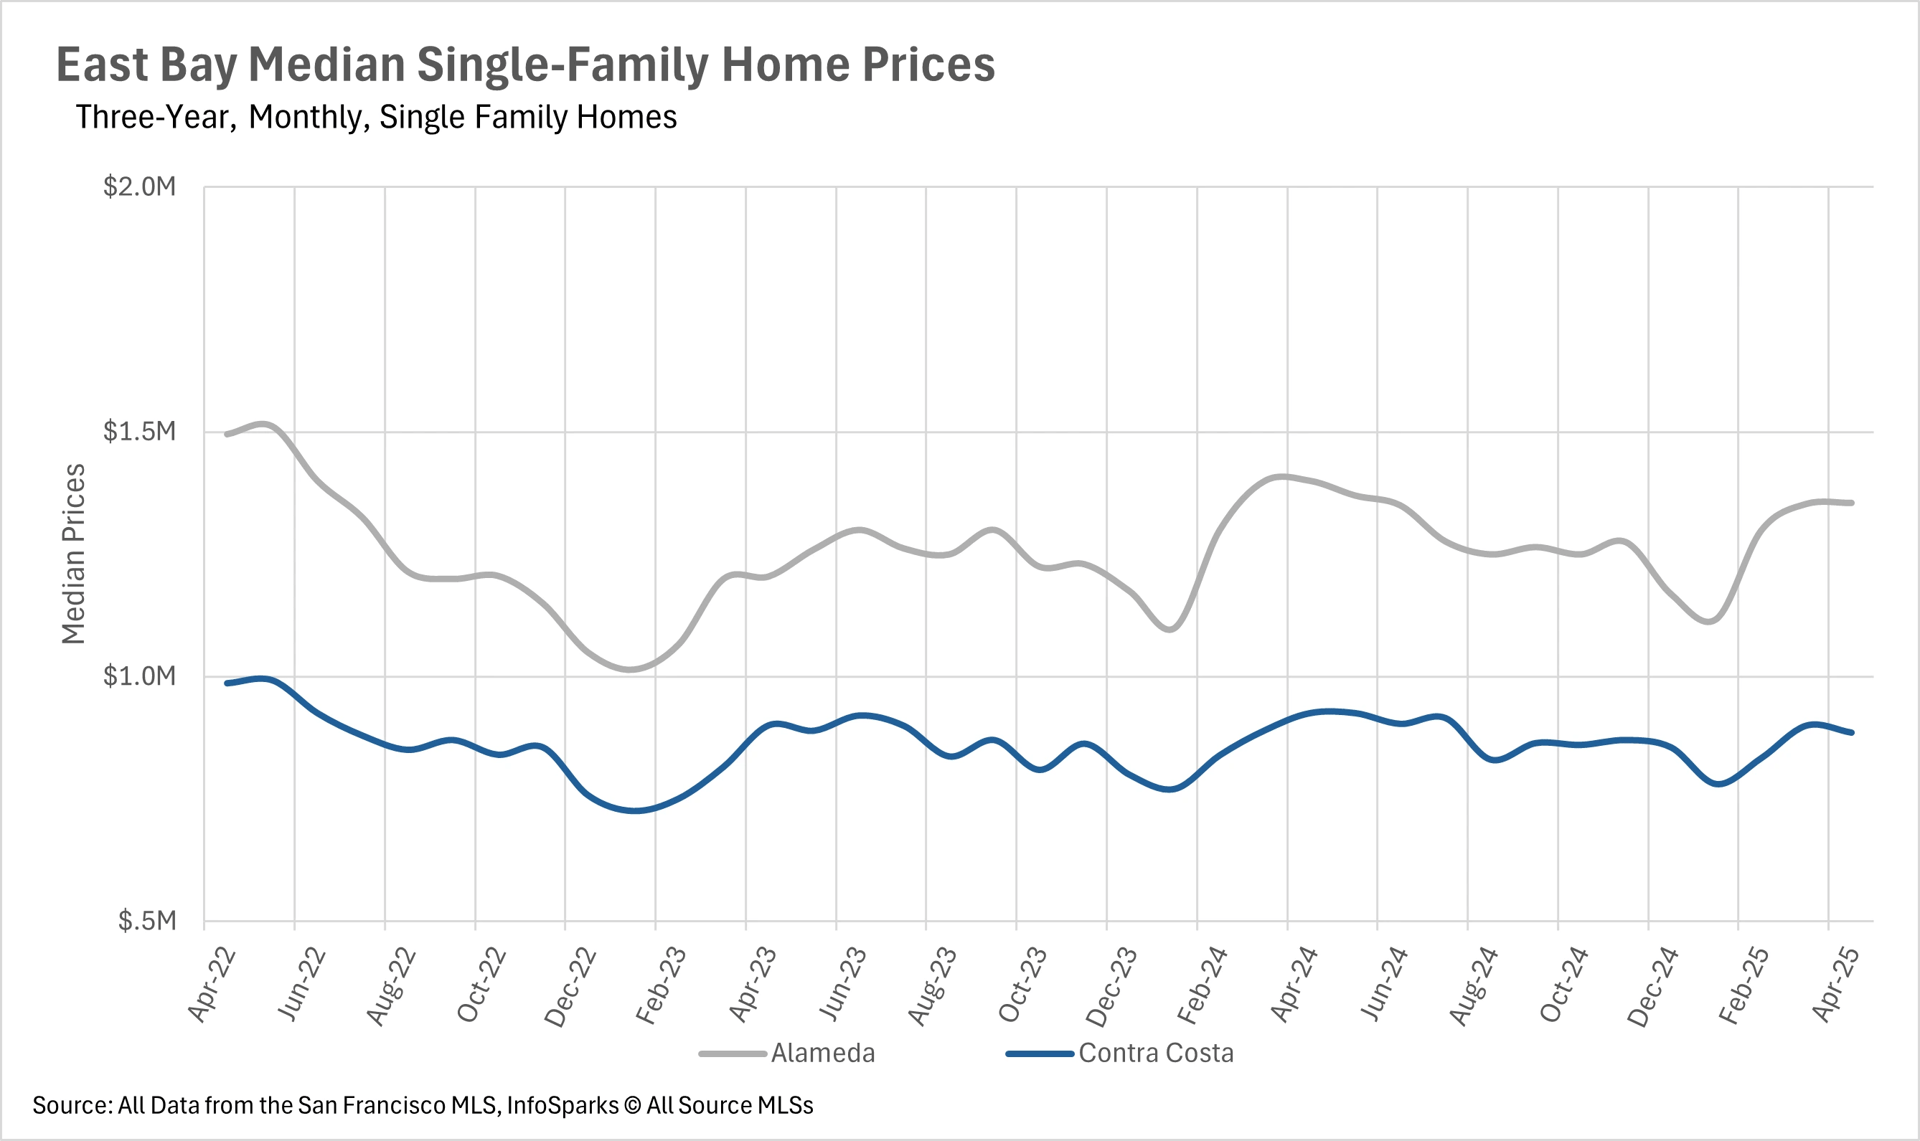
The East Bay saw widespread price declines, with single-family homes in Alameda and Contra Costa Counties dropping 3.21% and 4.31%, and Contra Costa condos experiencing a sharp 12% decrease. North Bay prices remained relatively flat, with minimal movement in Sonoma, Marin, Solano, and Napa Counties (ranging from +2.93% to -0.52%).

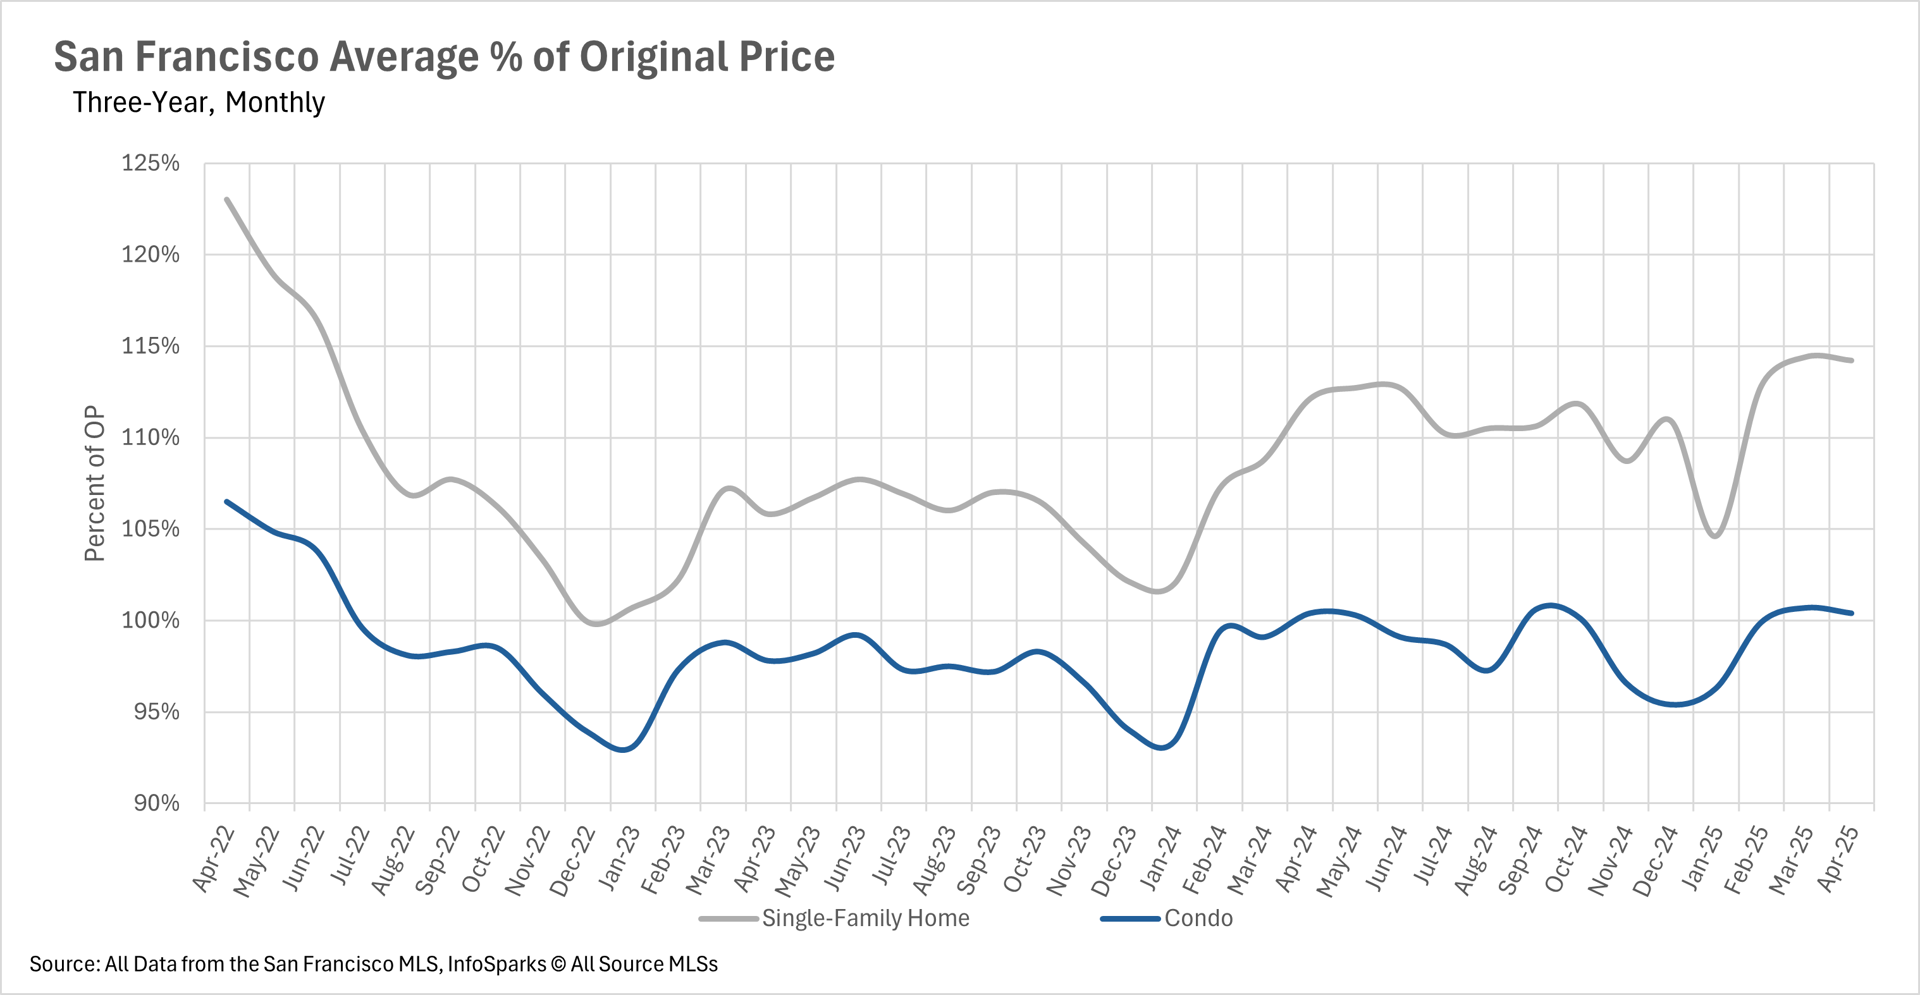
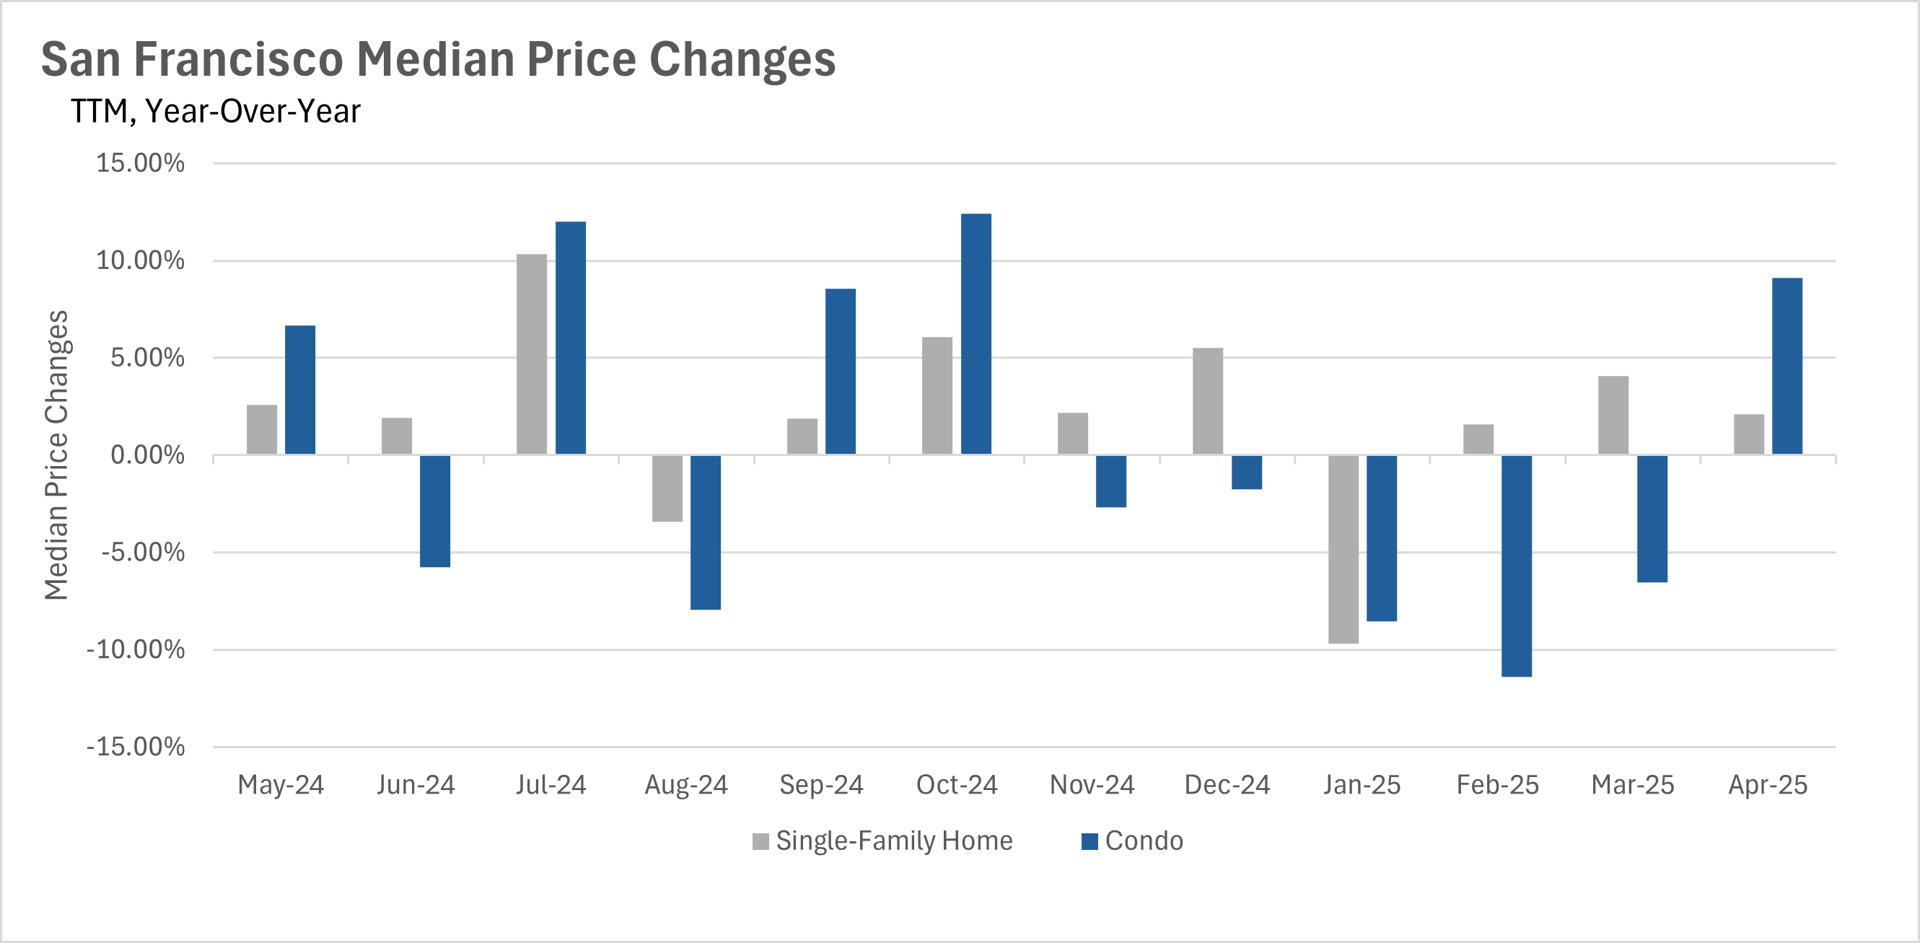
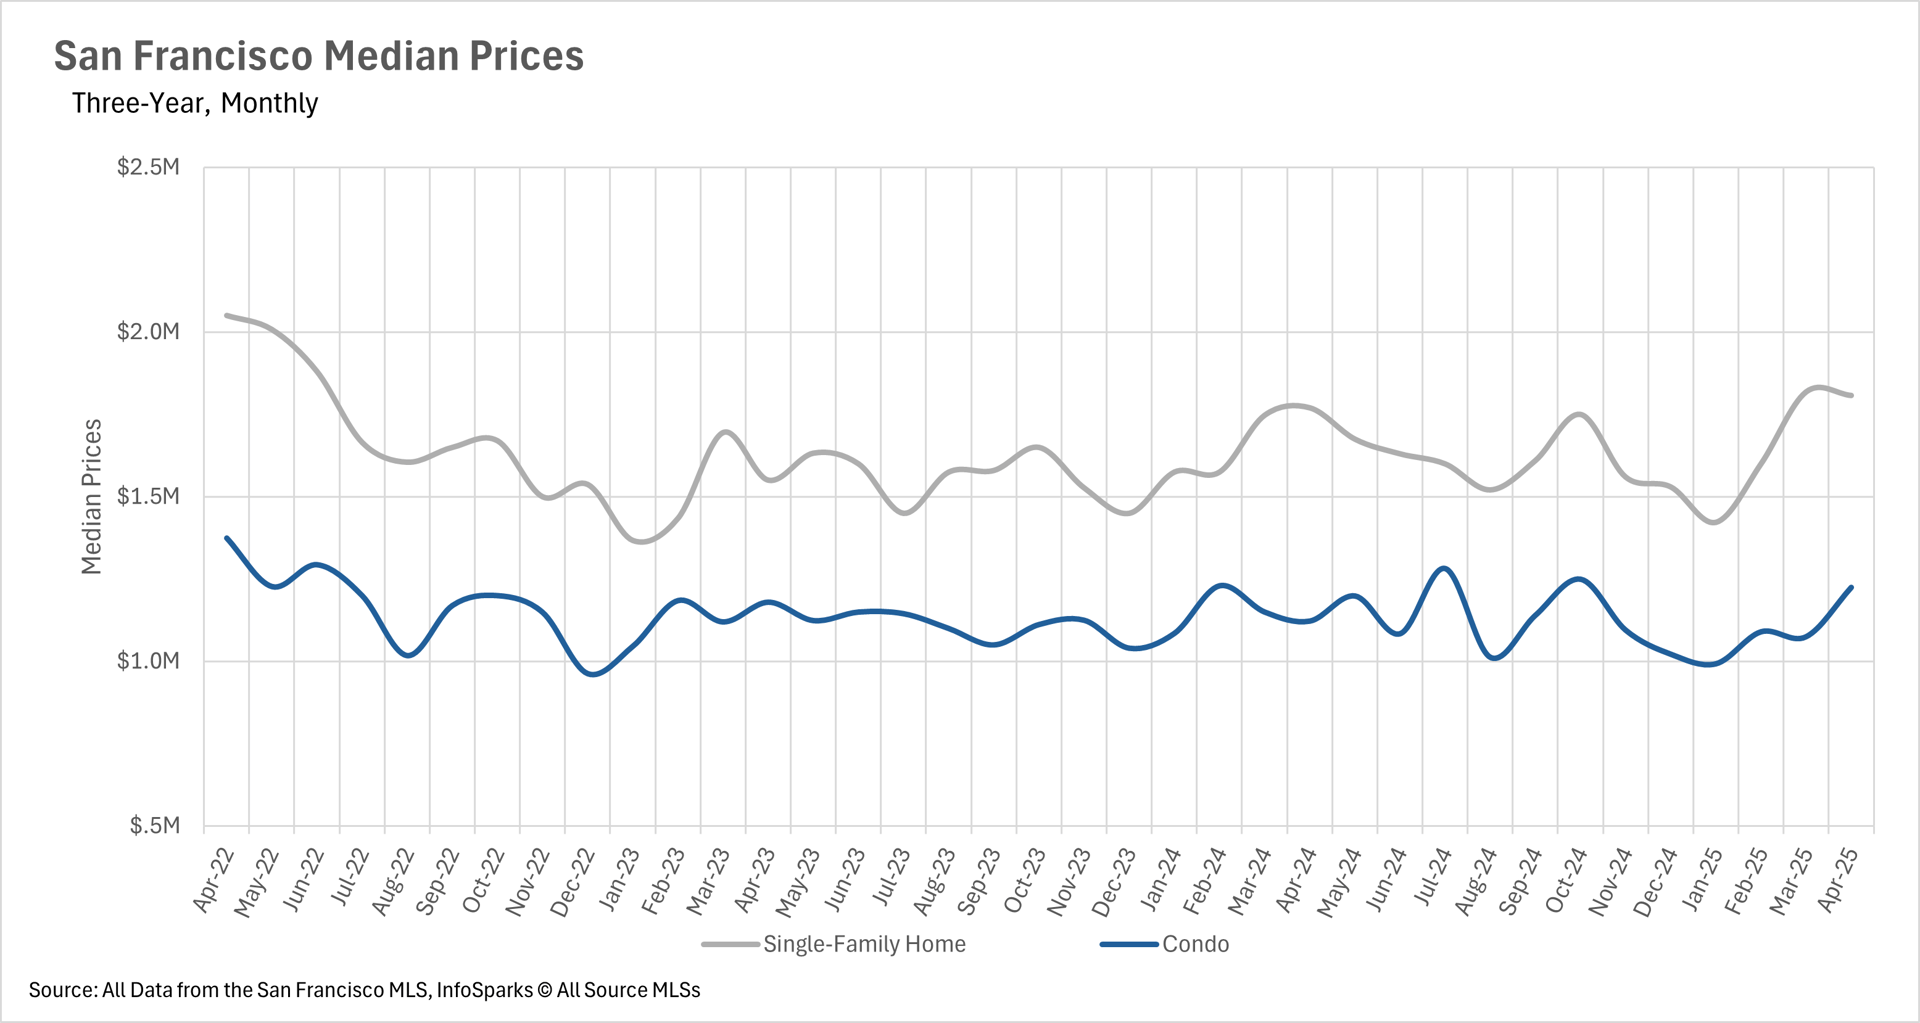
San Francisco showed contrasting trends, with single-family home prices increasing modestly by 2.12%, while condo prices reversed their five-month decline with a robust 9.13% increase, possibly signaling a turning point for the San Francisco condo market.

Inventory Levels Show Dramatic Regional Variations

Inventory trends vary dramatically across Bay Area regions in April. The East Bay experienced a substantial surge, with both single-family and condo inventories increasing by approximately 43% year-over-year, driven by a 7.47% increase in new single-family listings while sales dropped 12.21%.

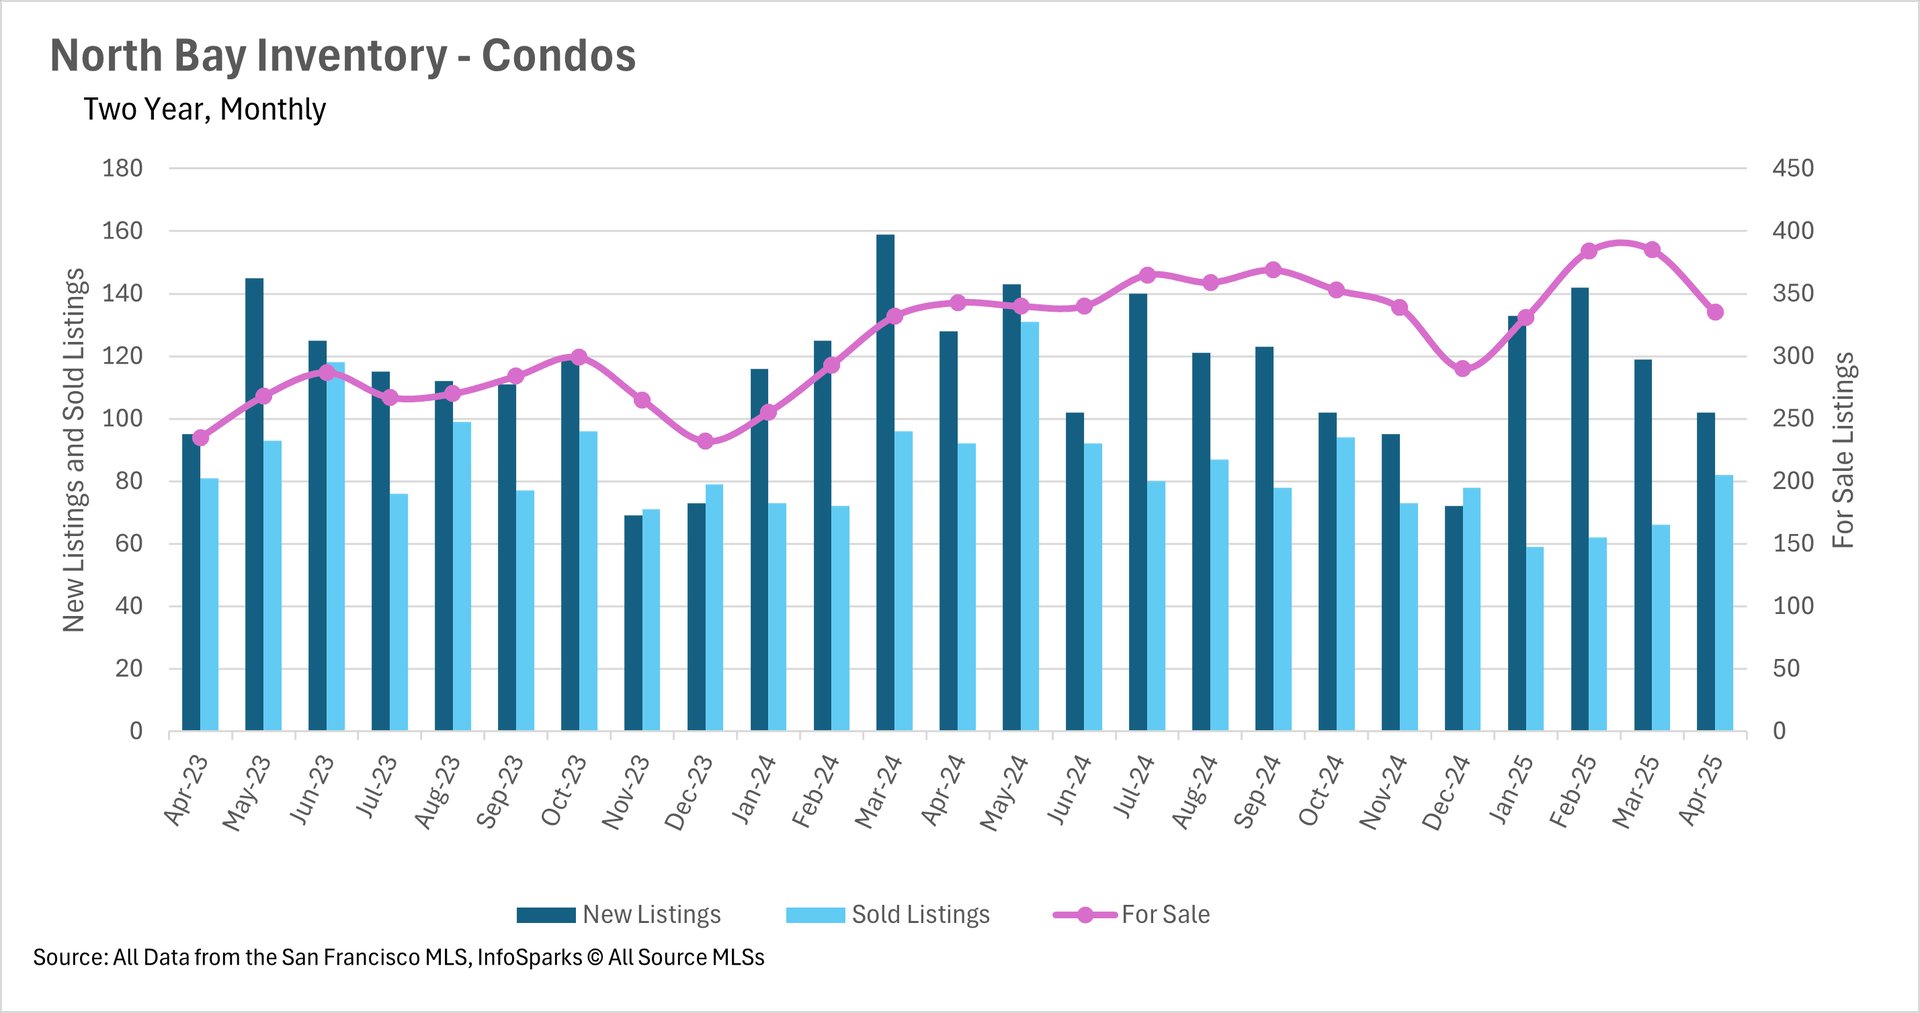
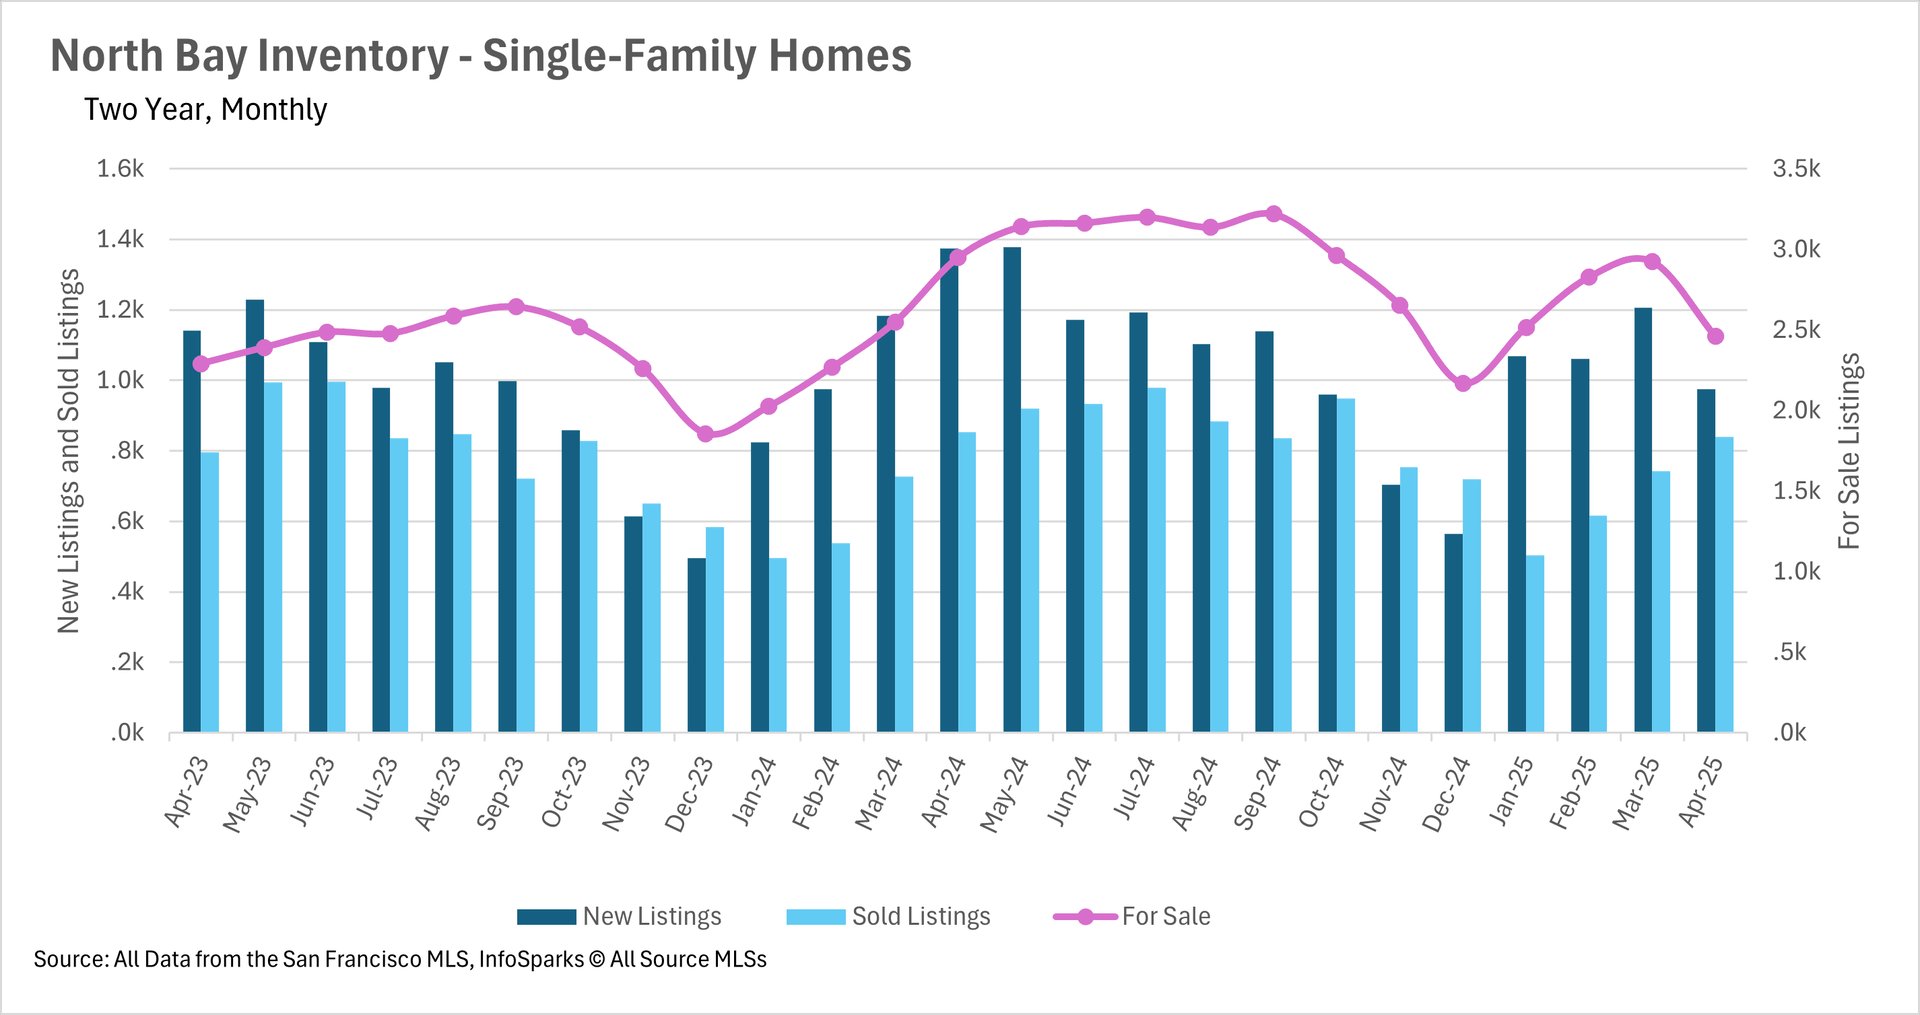
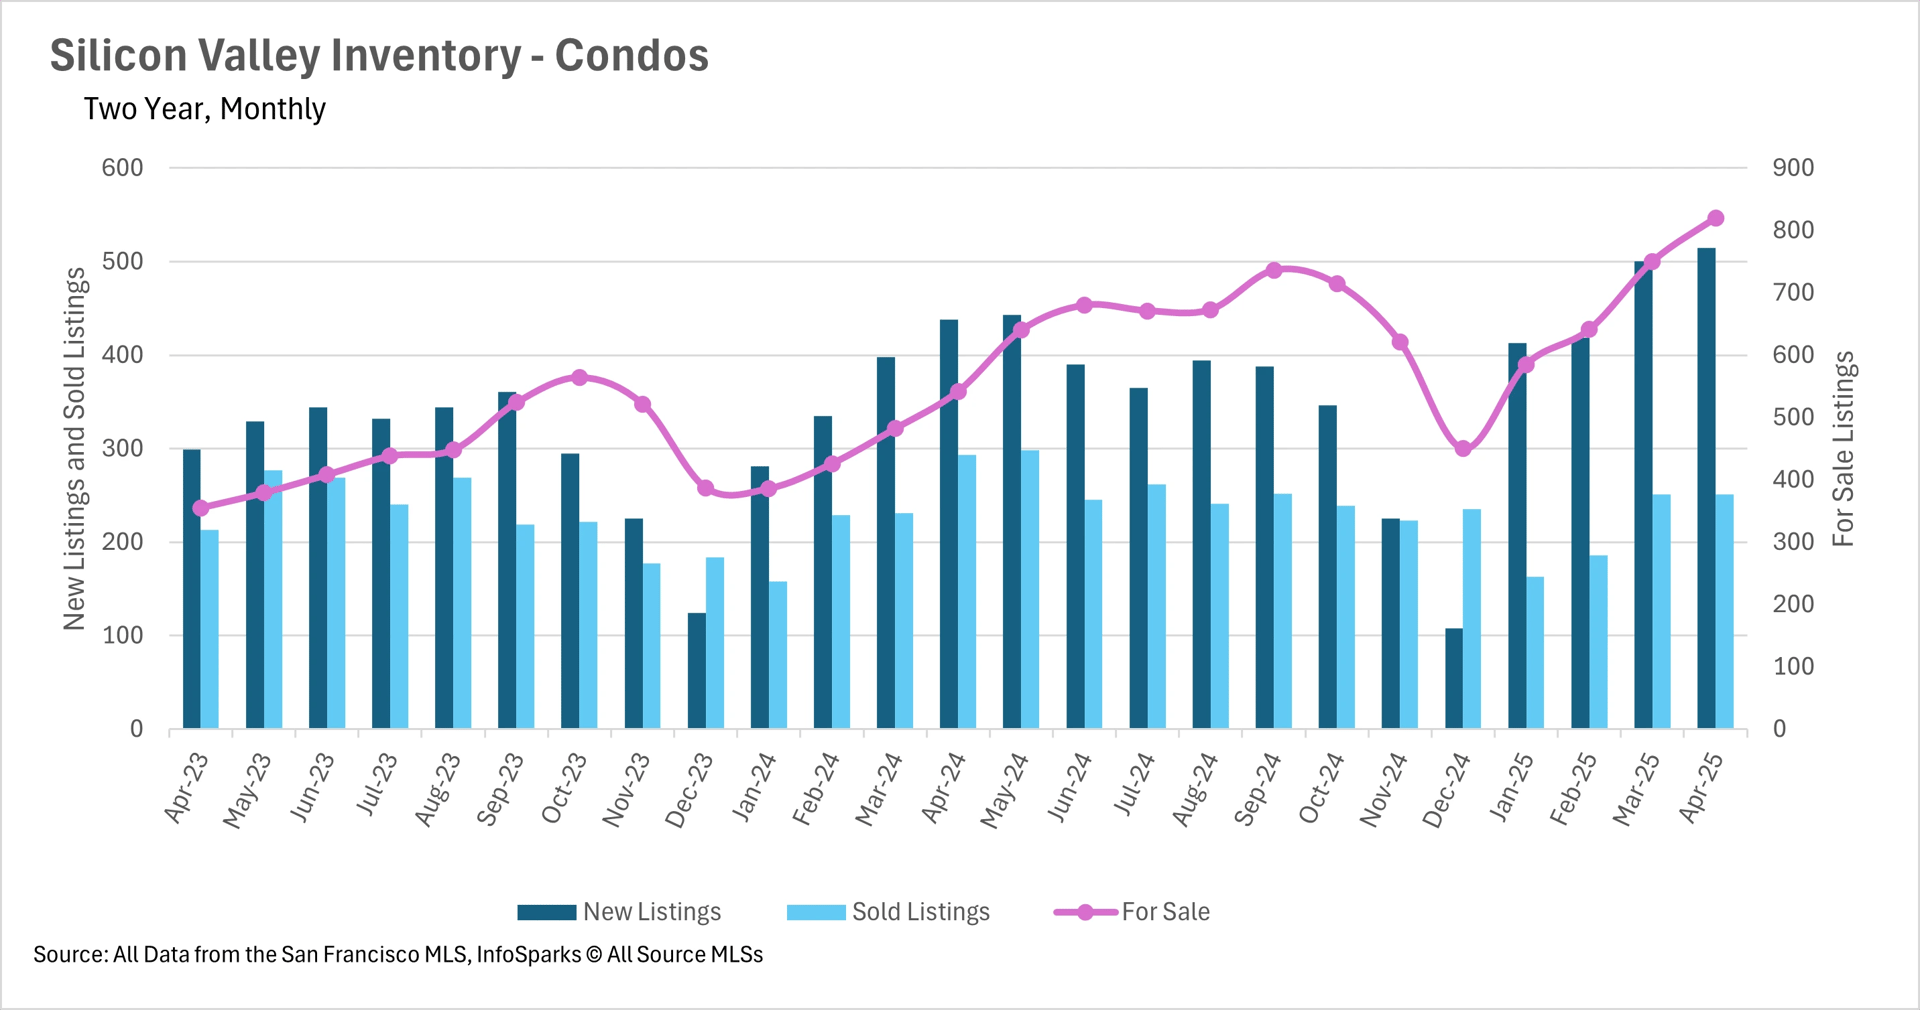
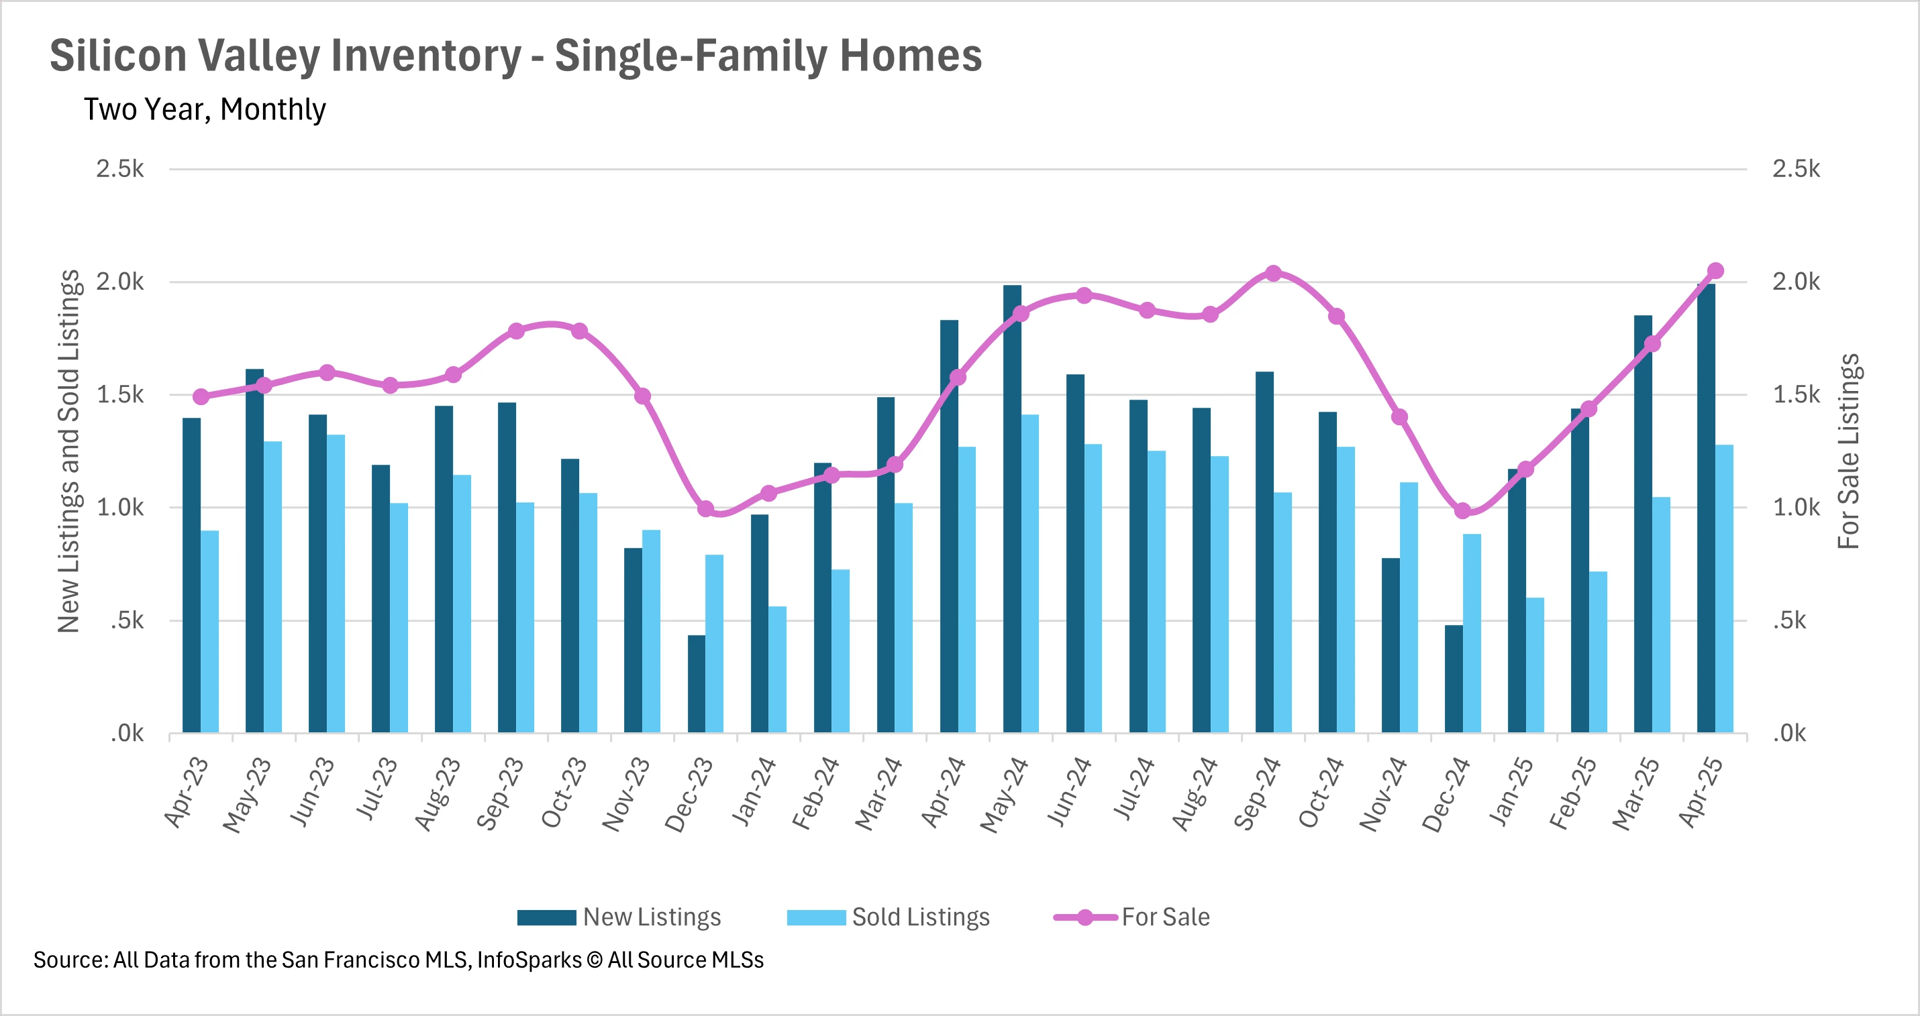
Silicon Valley similarly saw inventory growth, with single-family home supply increasing nearly 30% year-over-year and condo inventory jumping an impressive 51.29%, as new listings outpaced closings. In stark contrast, North Bay inventory levels continued to fall, with a 16.61% year-over-year and 15.87% month-over-month decrease in active listings, largely due to 30% fewer new listings hitting the market compared to last year.

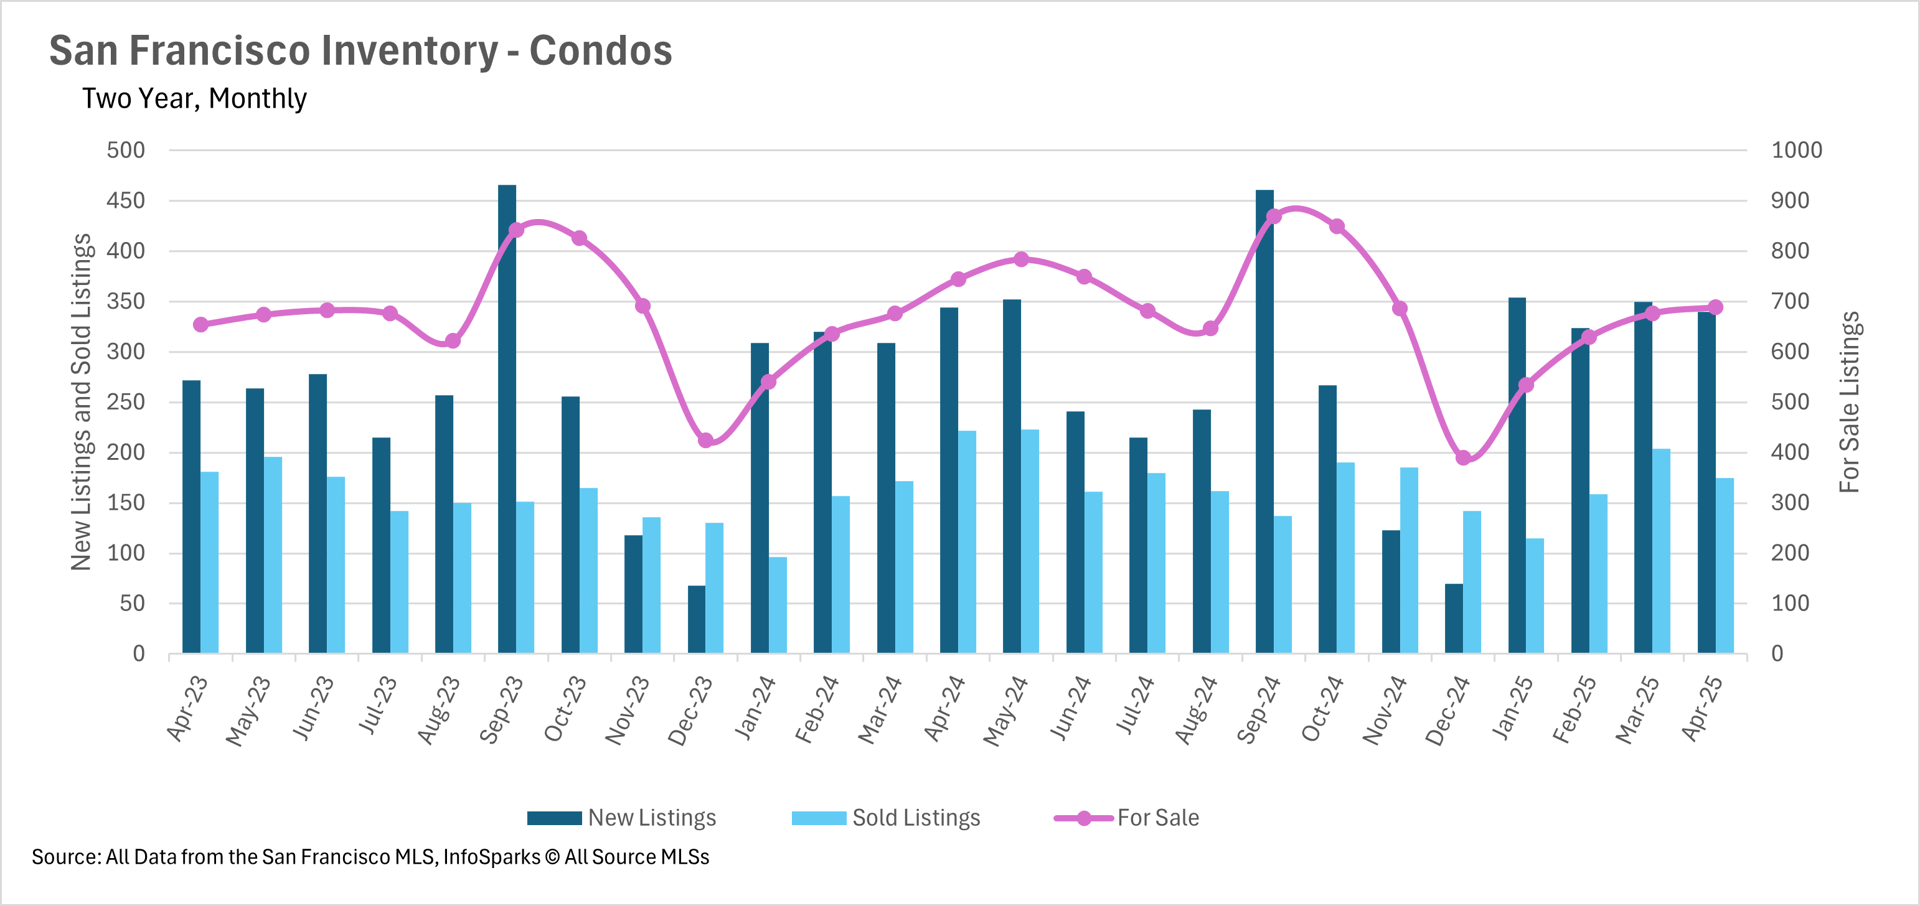
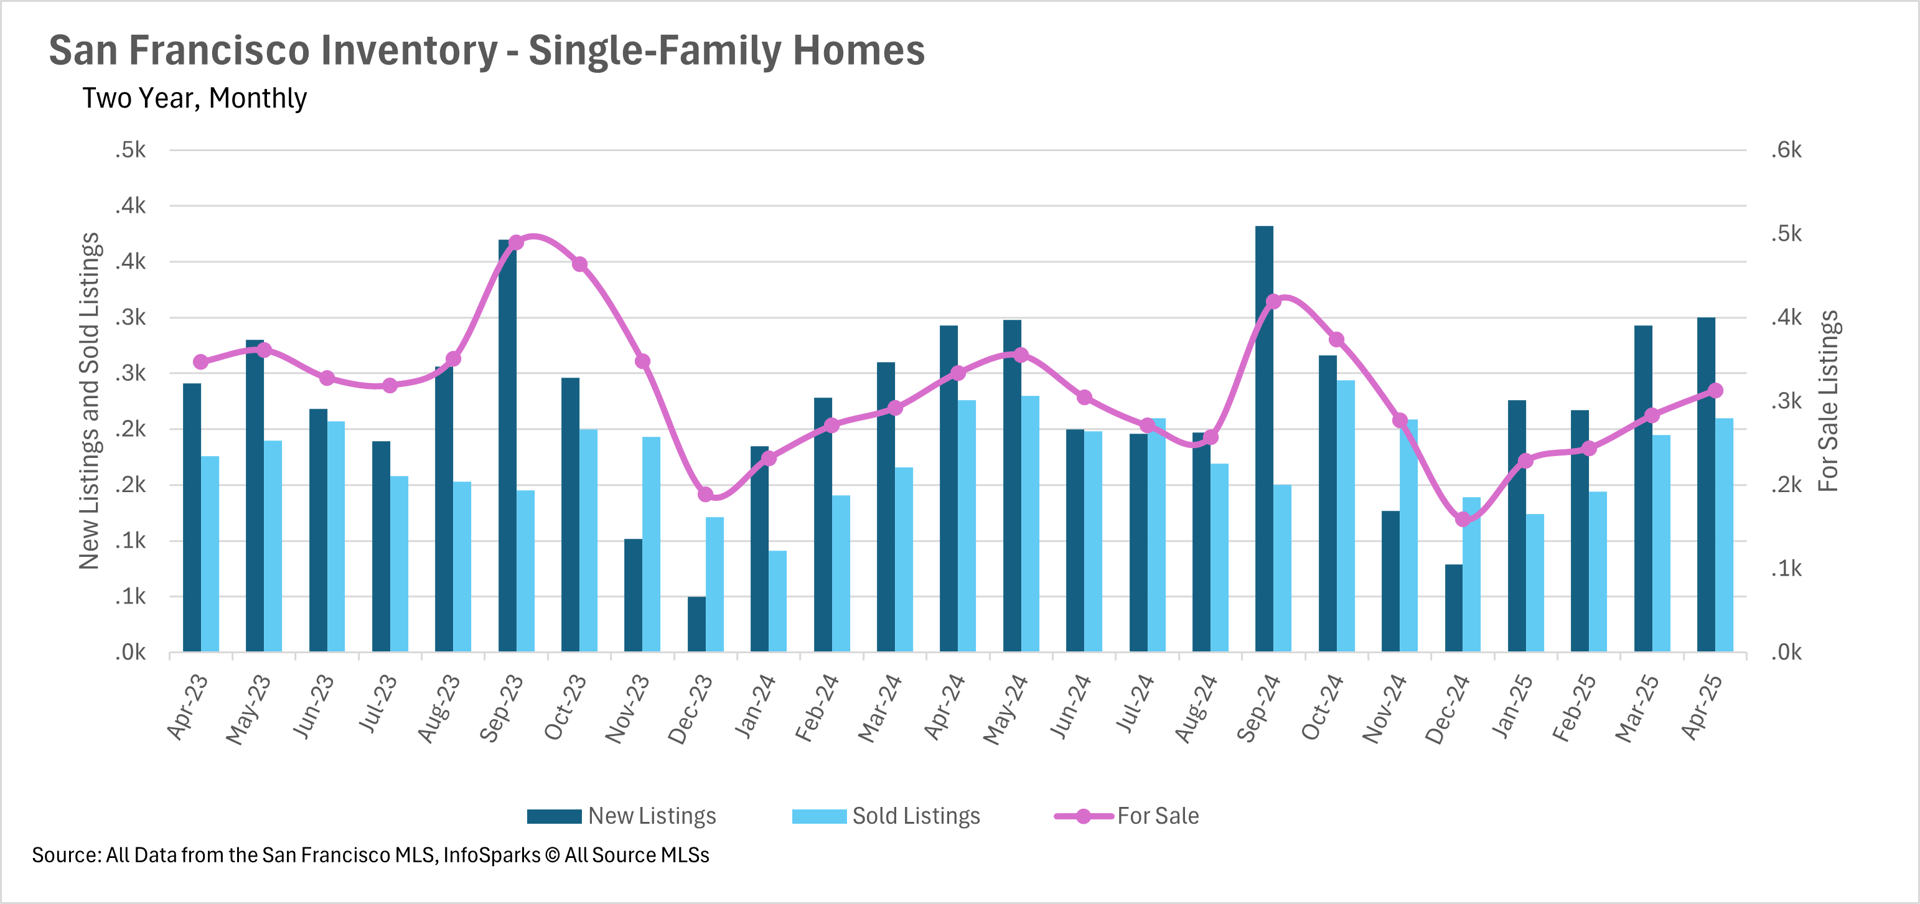
San Francisco's inventory situation remains particularly challenging, with single-family home listings dropping 6.29% and condo listings falling 7.52% year-over-year, with condo sales seeing a substantial 21.17% decrease, one of the most significant declines in recent times.

Homes Continue to Sell Quickly Despite Inventory Variations

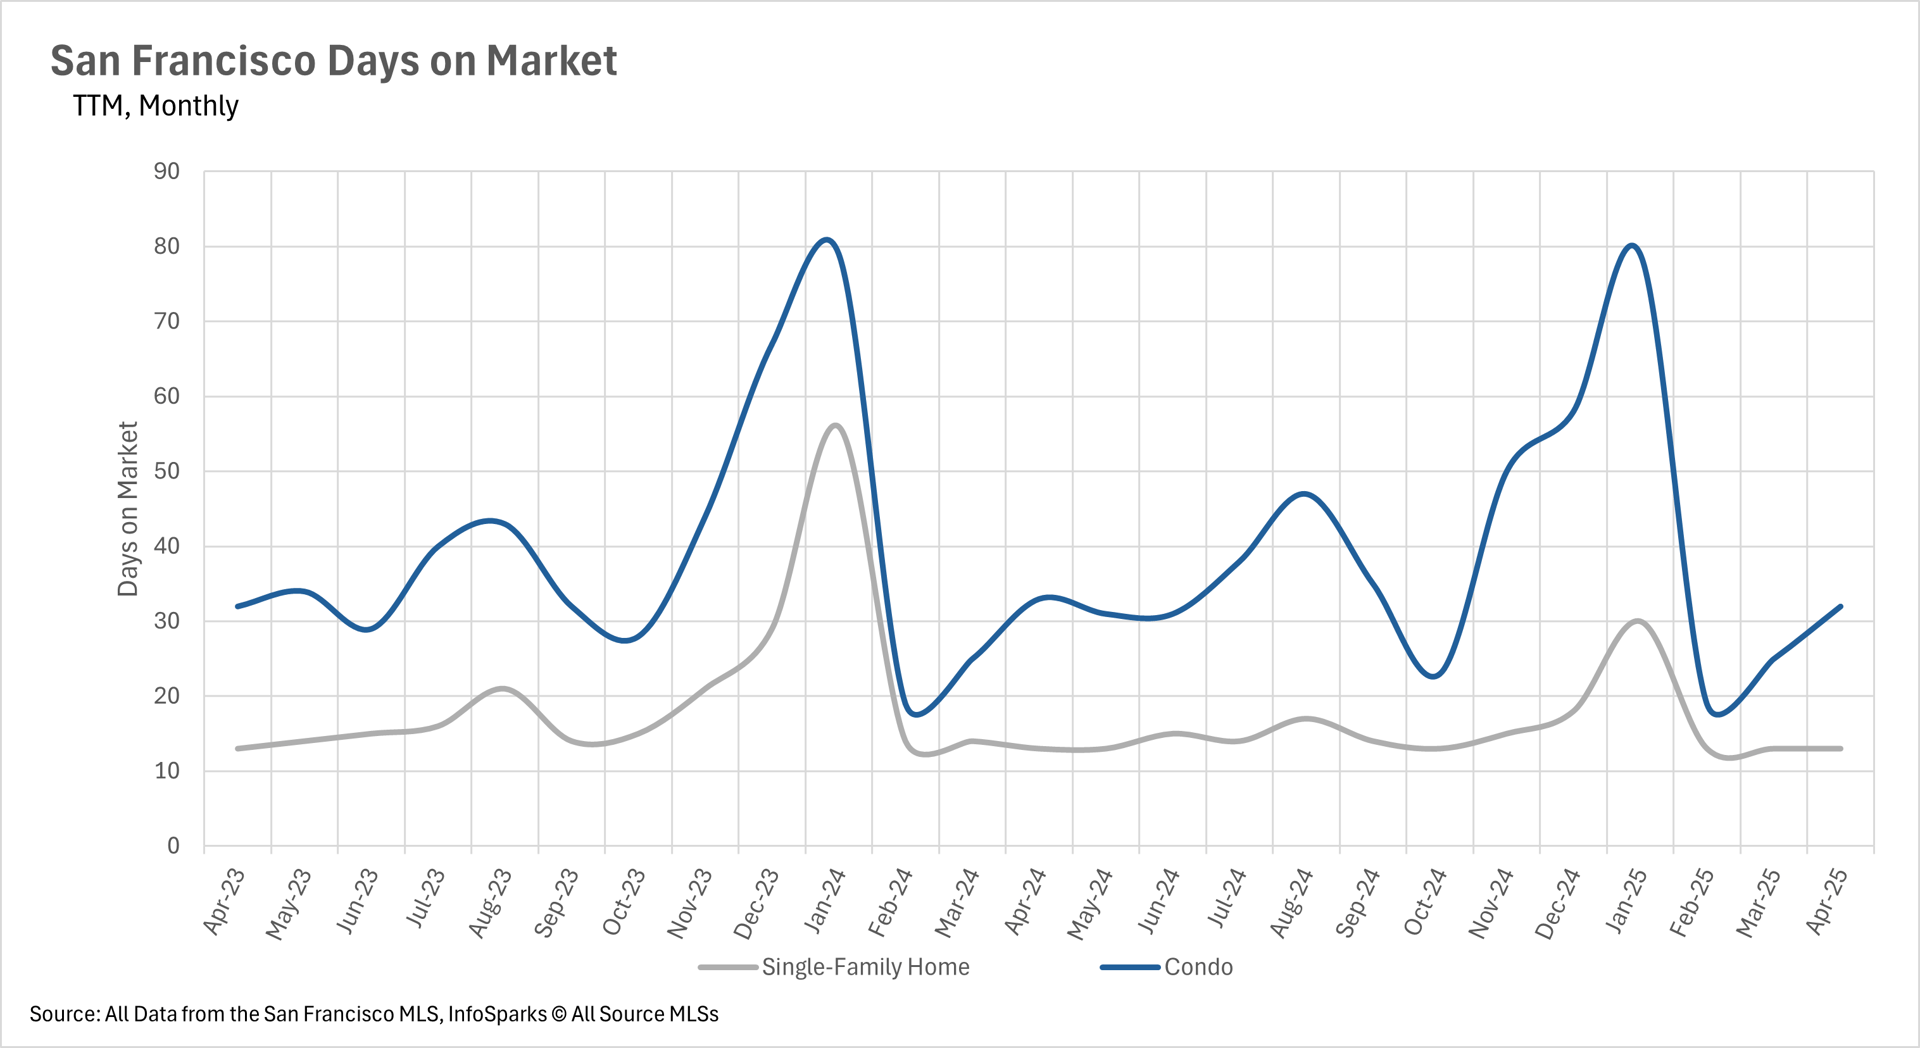
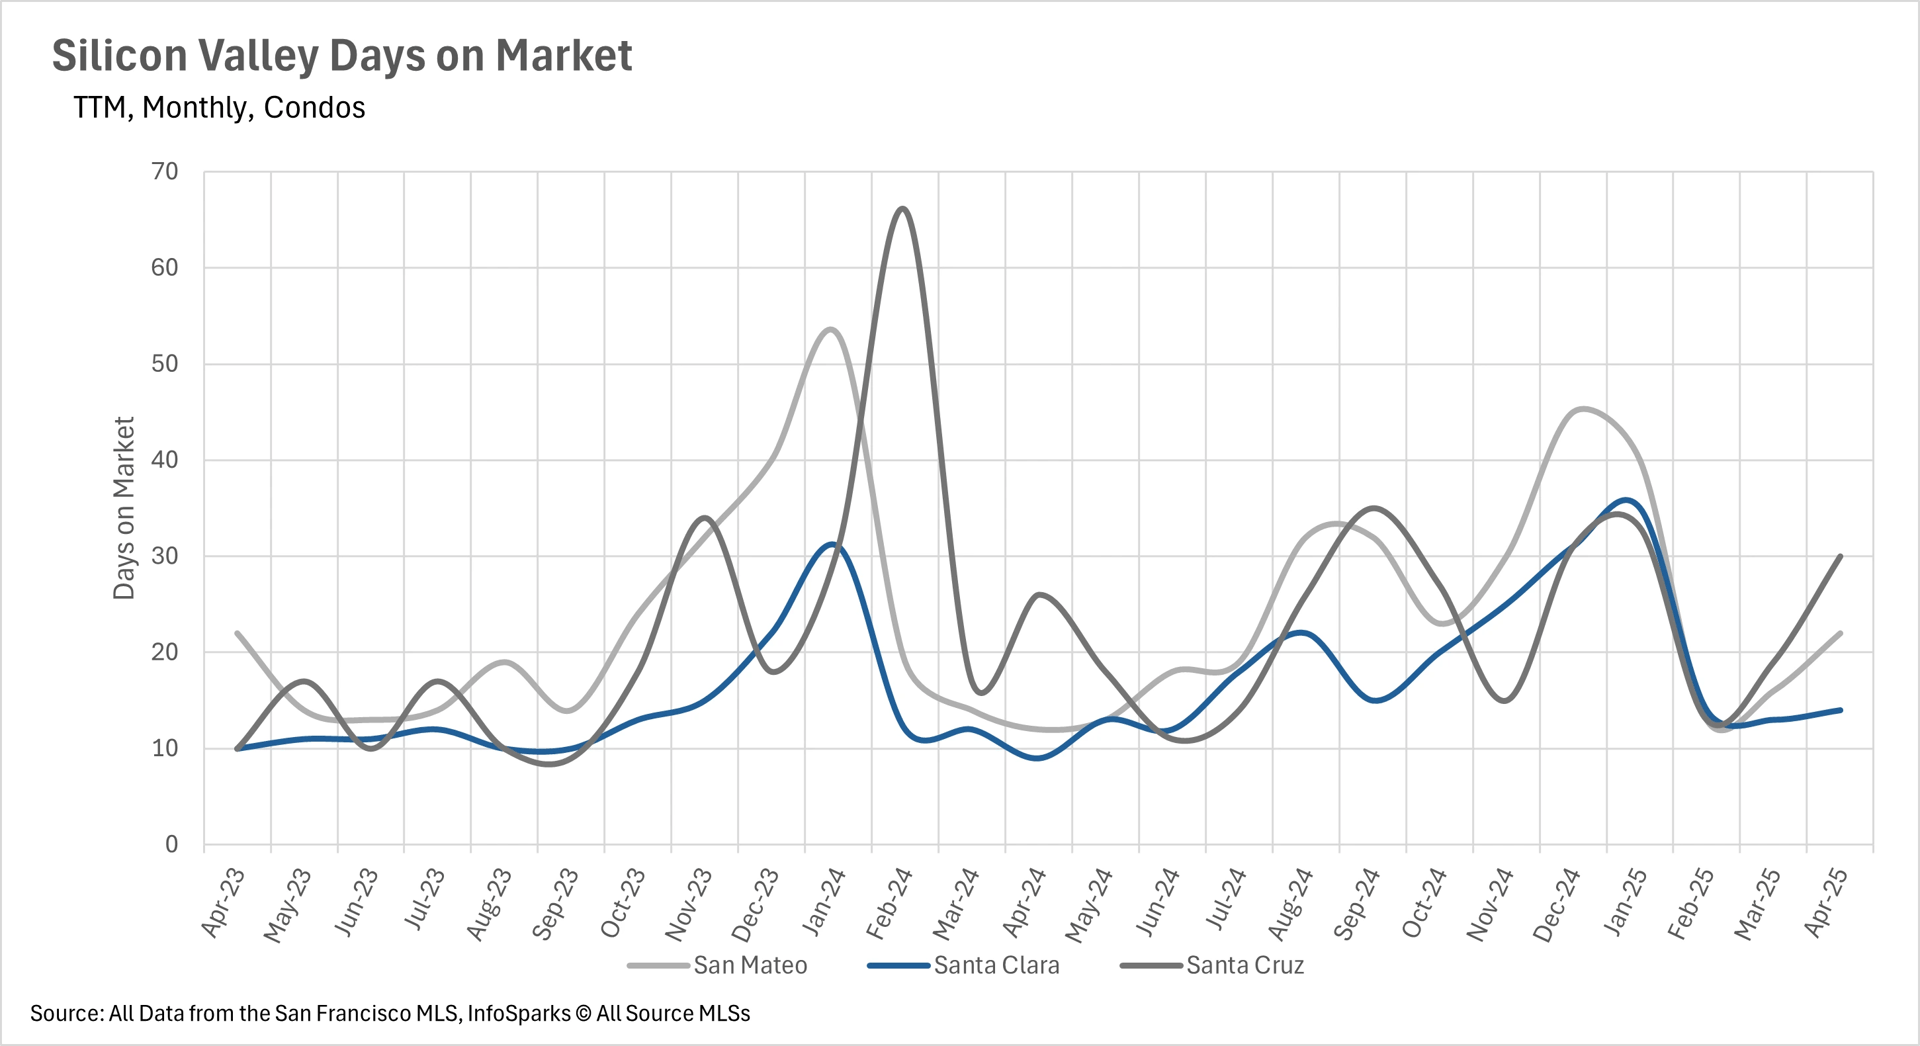
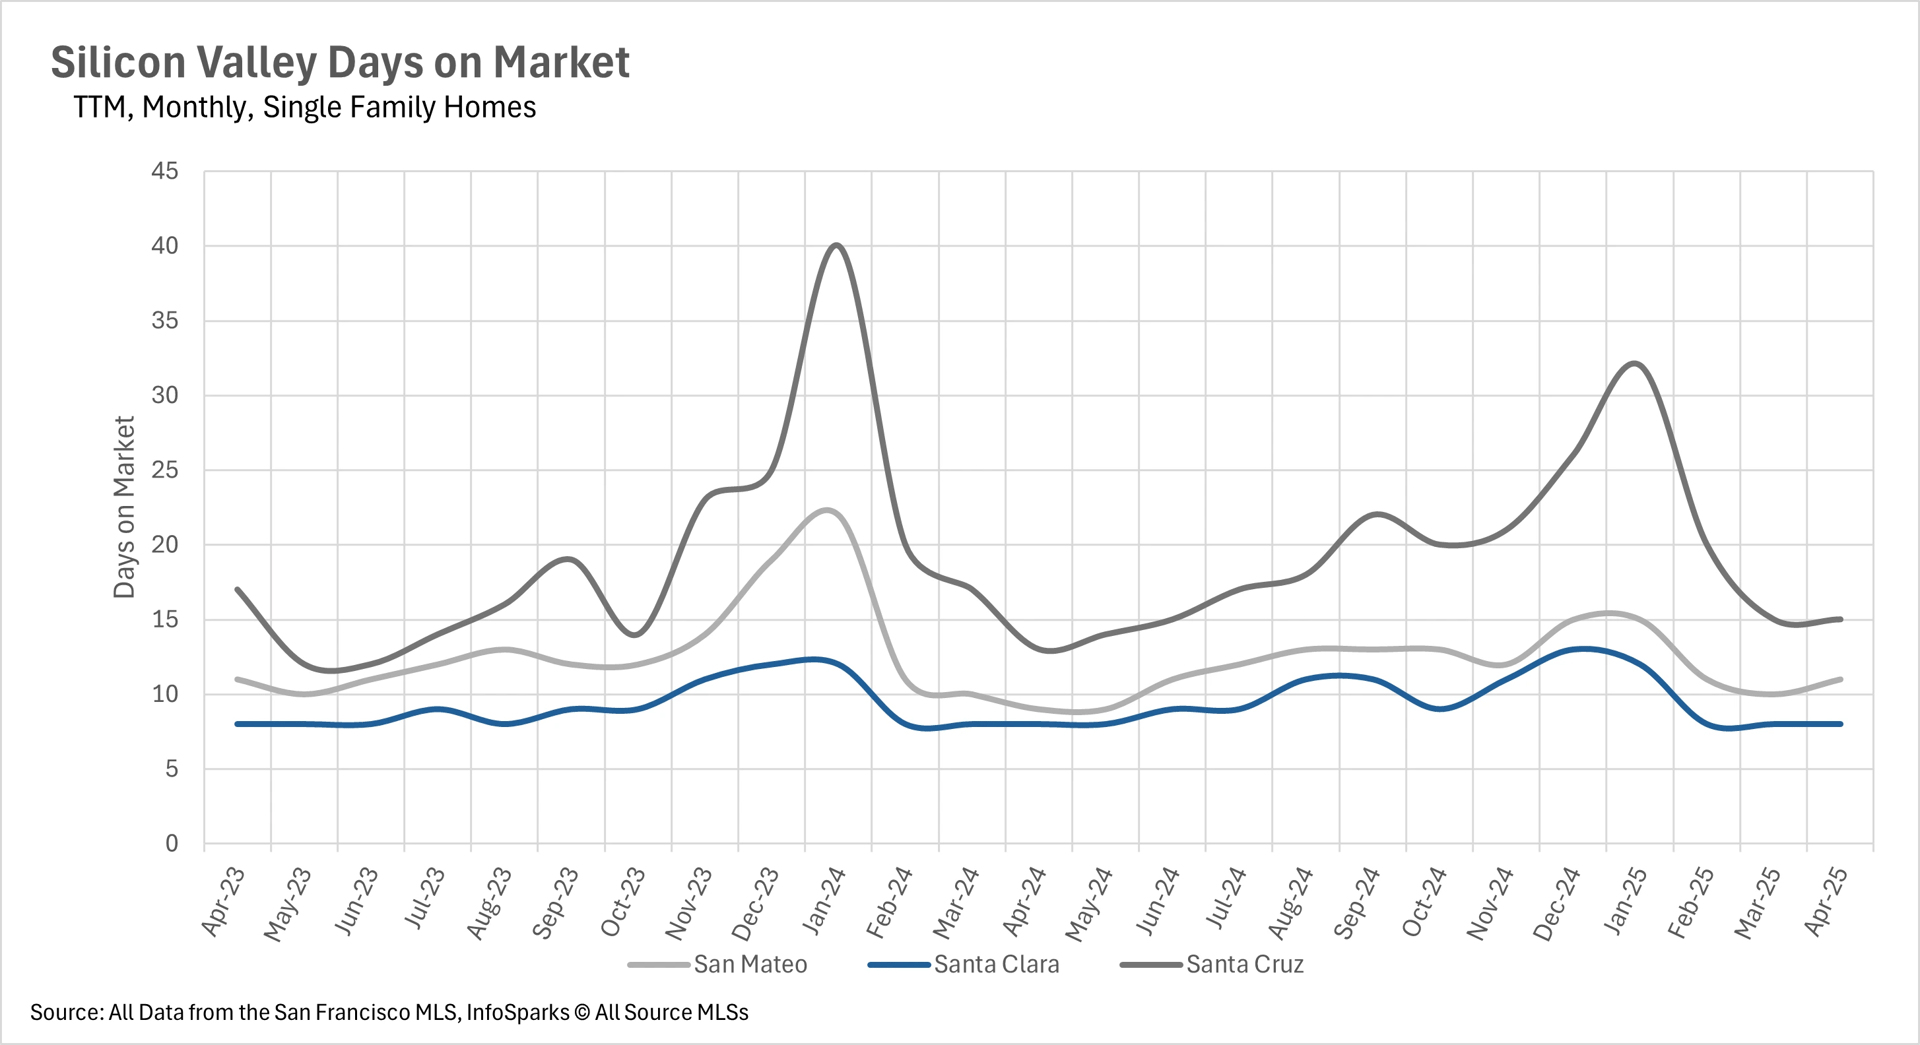
Despite varying inventory levels and price trends, homes across the Bay Area are still selling relatively quickly. Silicon Valley continues to lead with the fastest market movement, the average single-family home in Santa Clara County sells in just 8 days, while San Mateo and Santa Cruz Counties follow at 11 and 15 days, respectively.

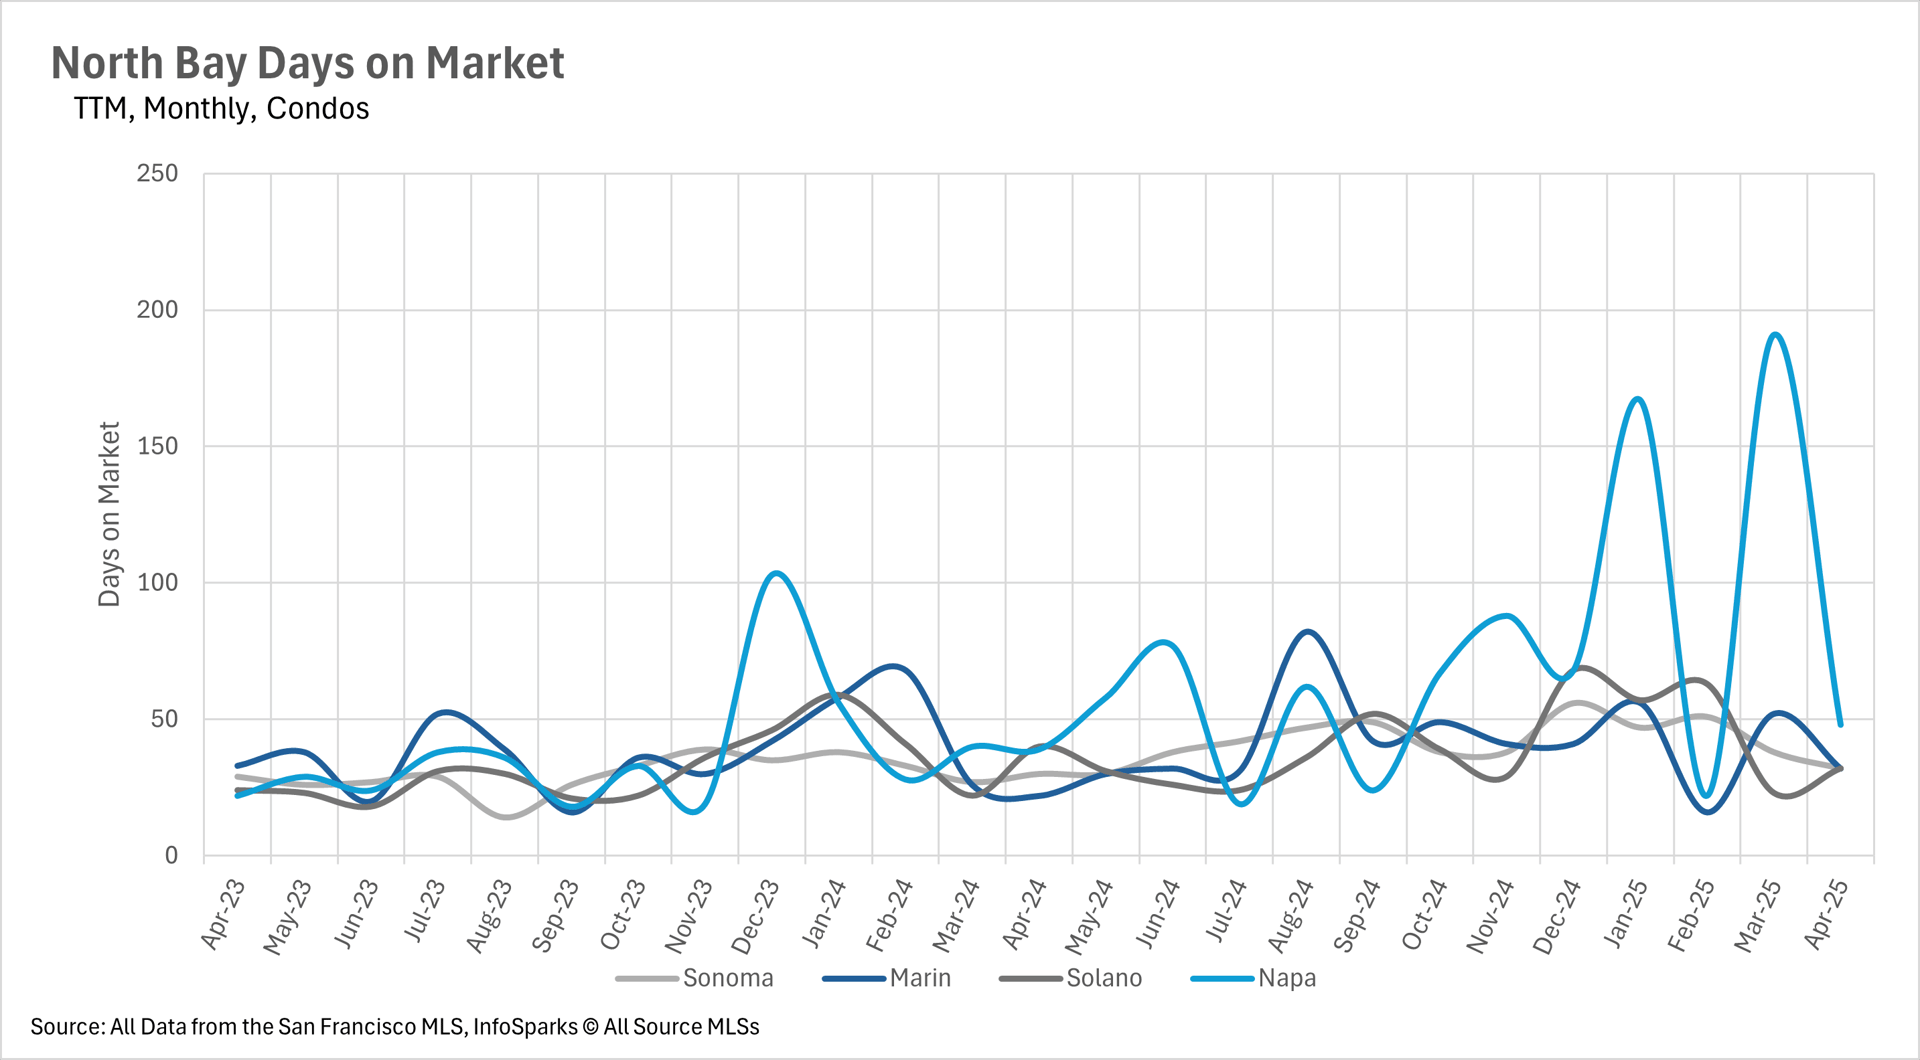
The East Bay also maintains quick sales with single-family homes typically on the market for only 13 days, and condos selling in 19 days in Alameda County and 26 days in Contra Costa. North Bay is experiencing slightly longer market times compared to last year, but still maintains reasonable timeframes.

San Francisco's single-family homes are not only selling quickly but commanding substantial premiums, with the average home selling for 14.2% above asking price, though condos are selling closer to list price (just 0.4% above asking). These relatively short market times, despite increasing inventory in some regions, indicate that buyer demand remains healthy throughout much of the Bay Area.

The Single-Family Home Market Favors Sellers, While the Condo Market Favors Buyers

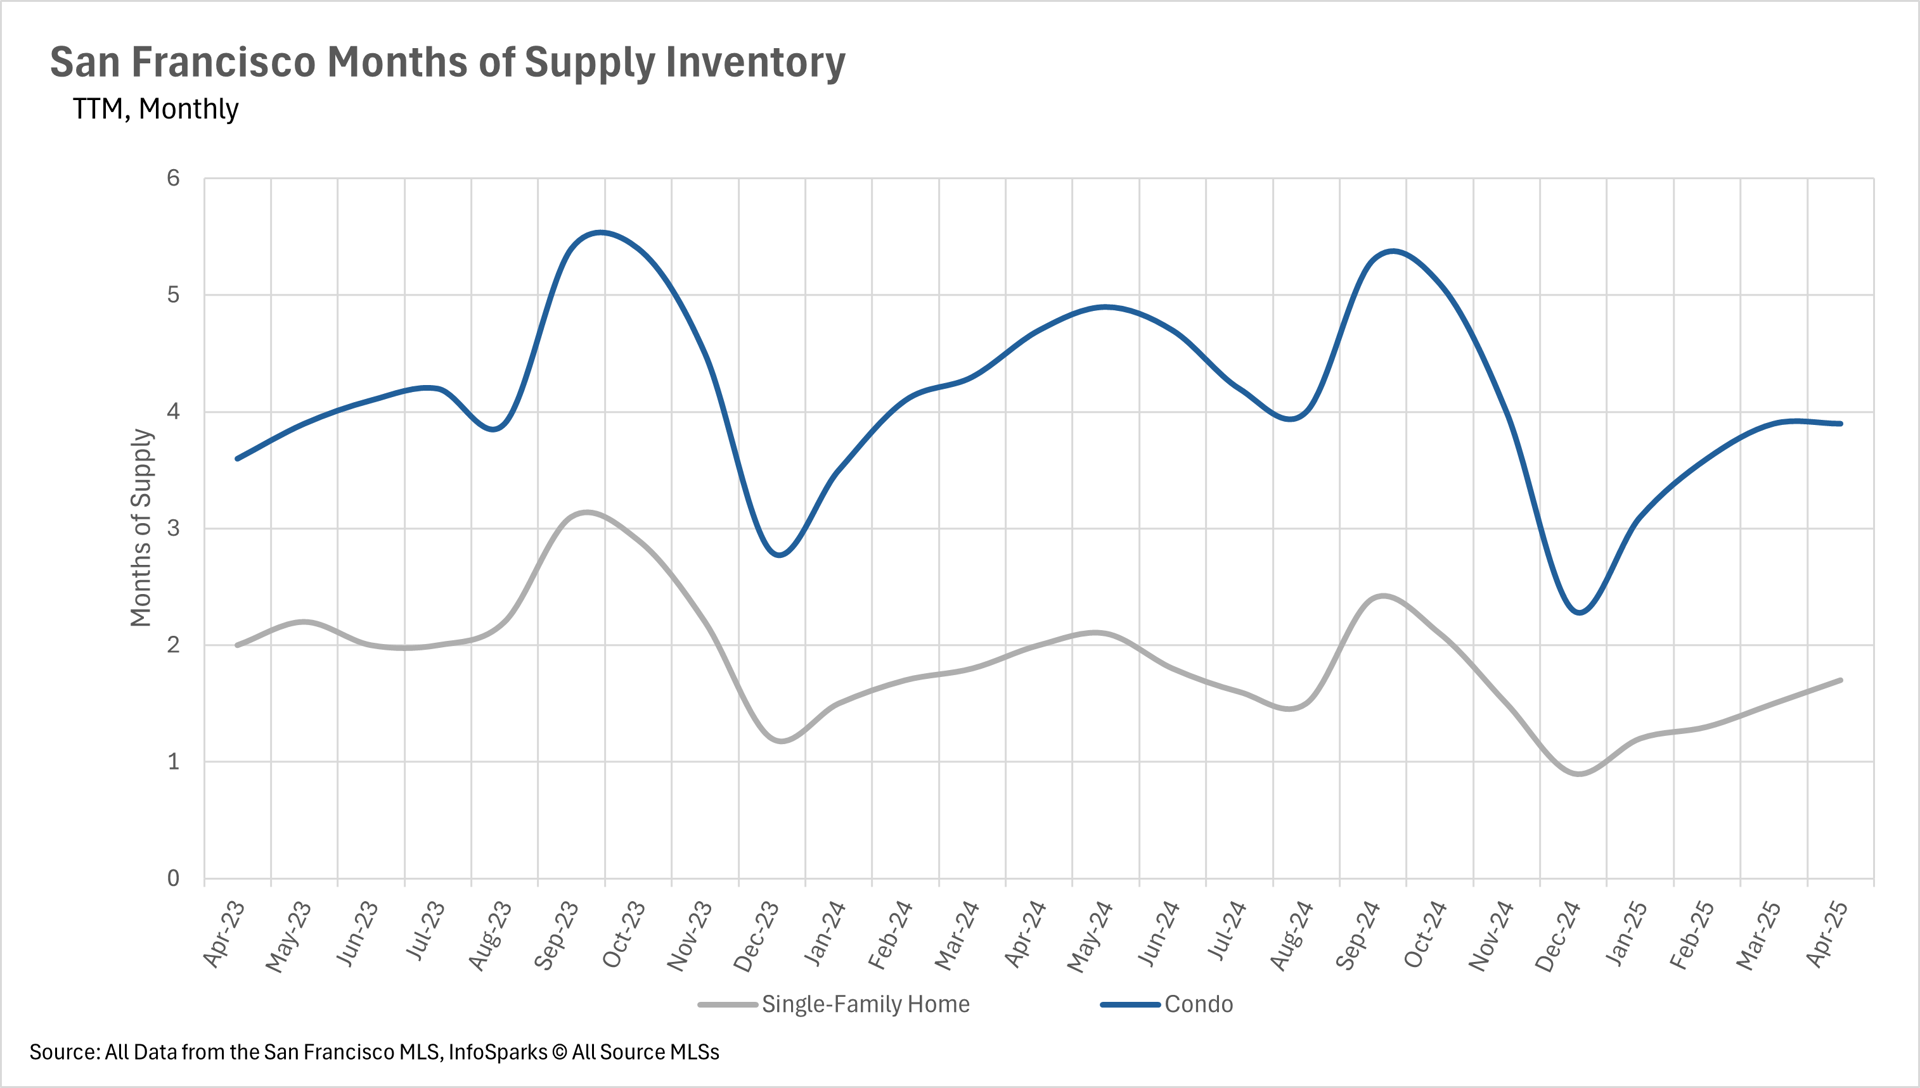
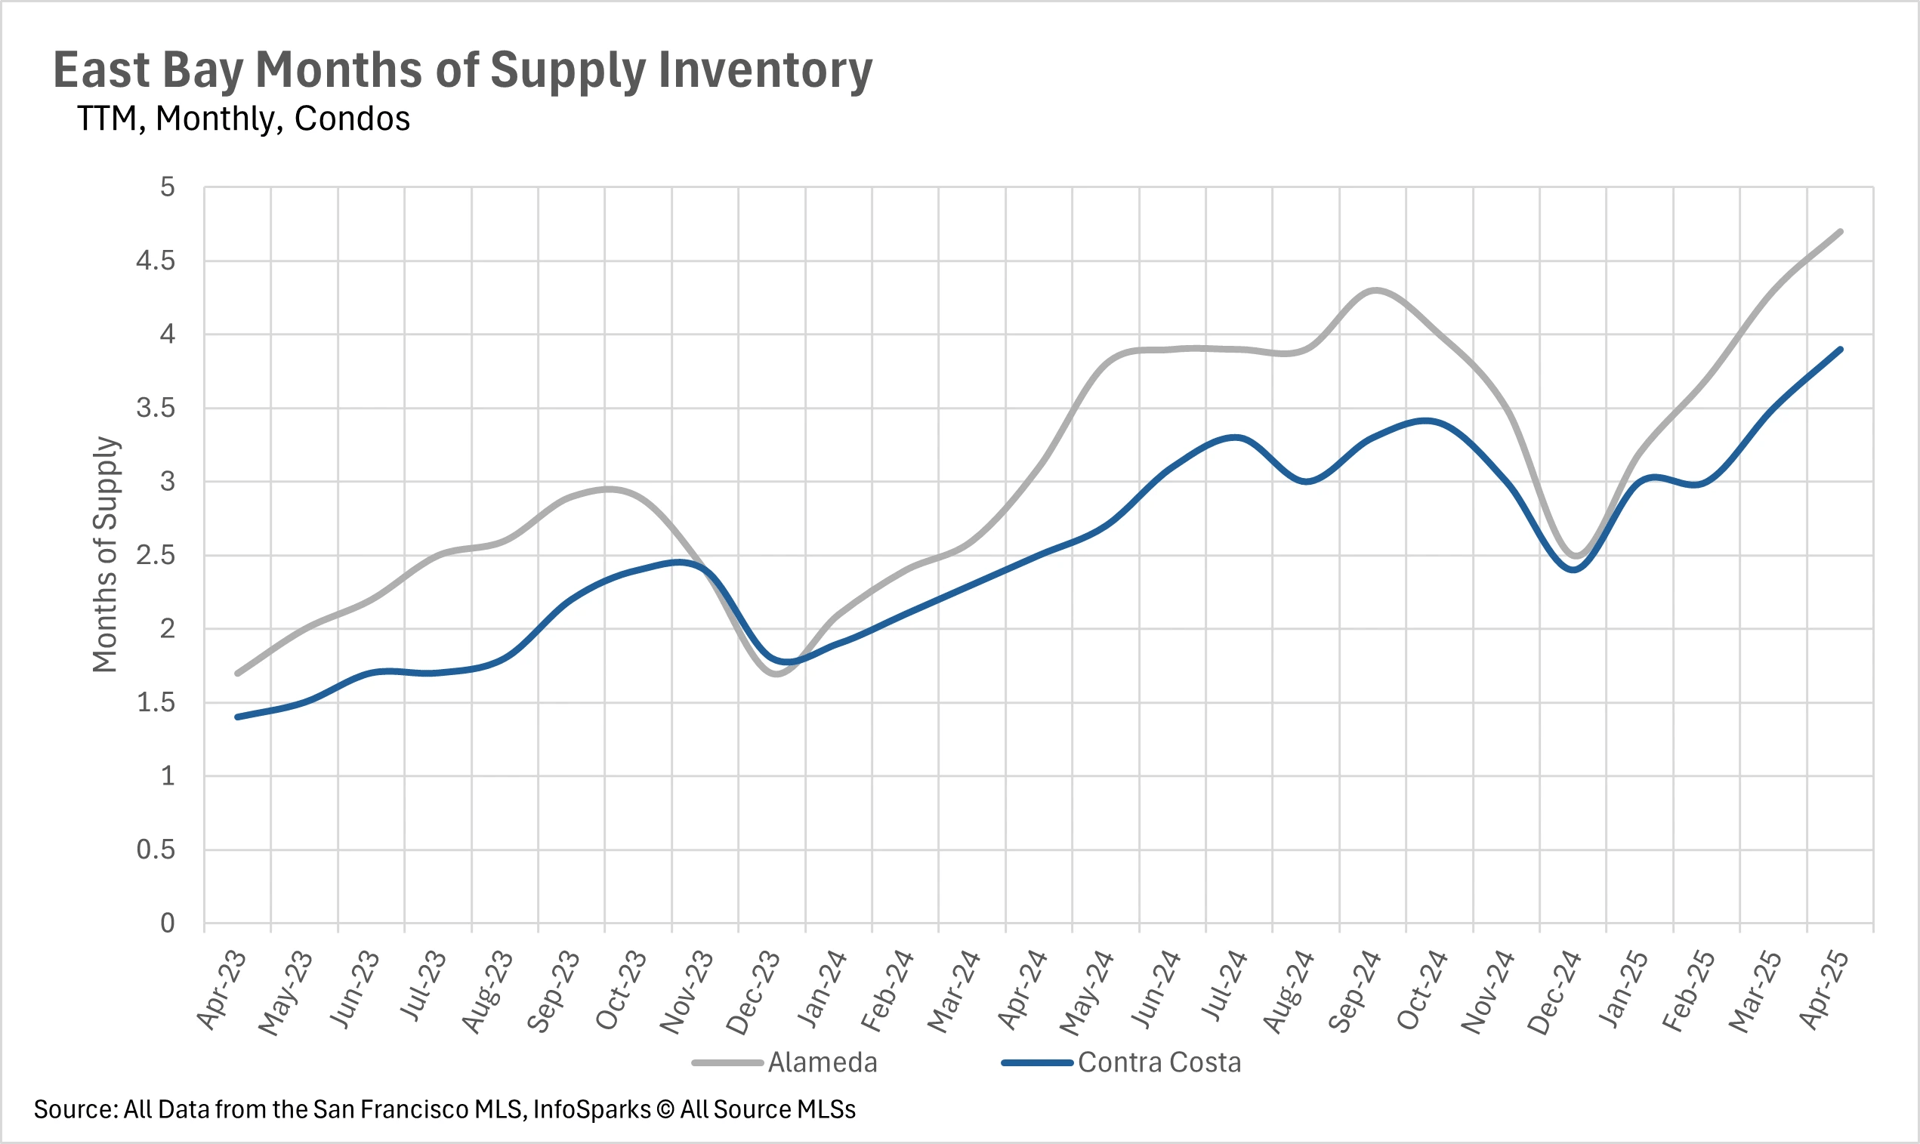
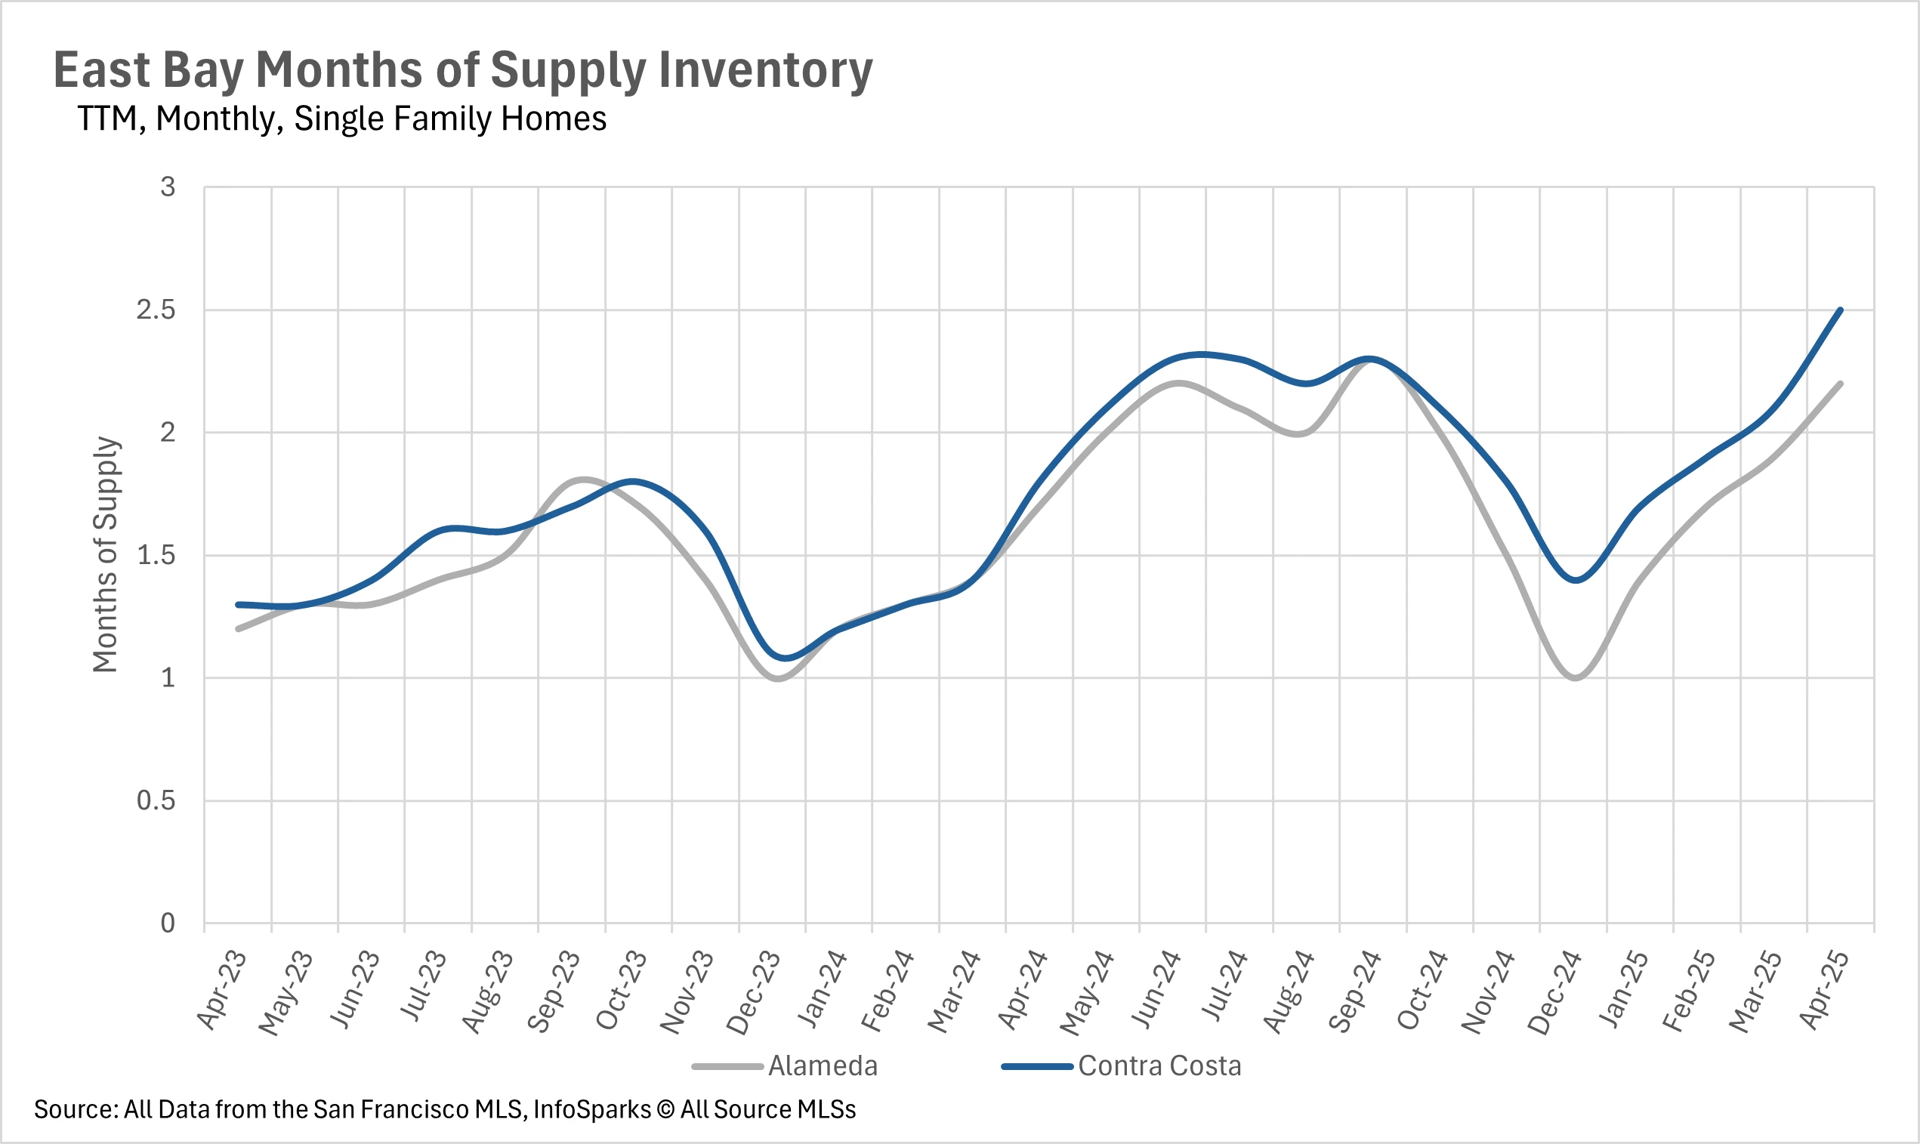
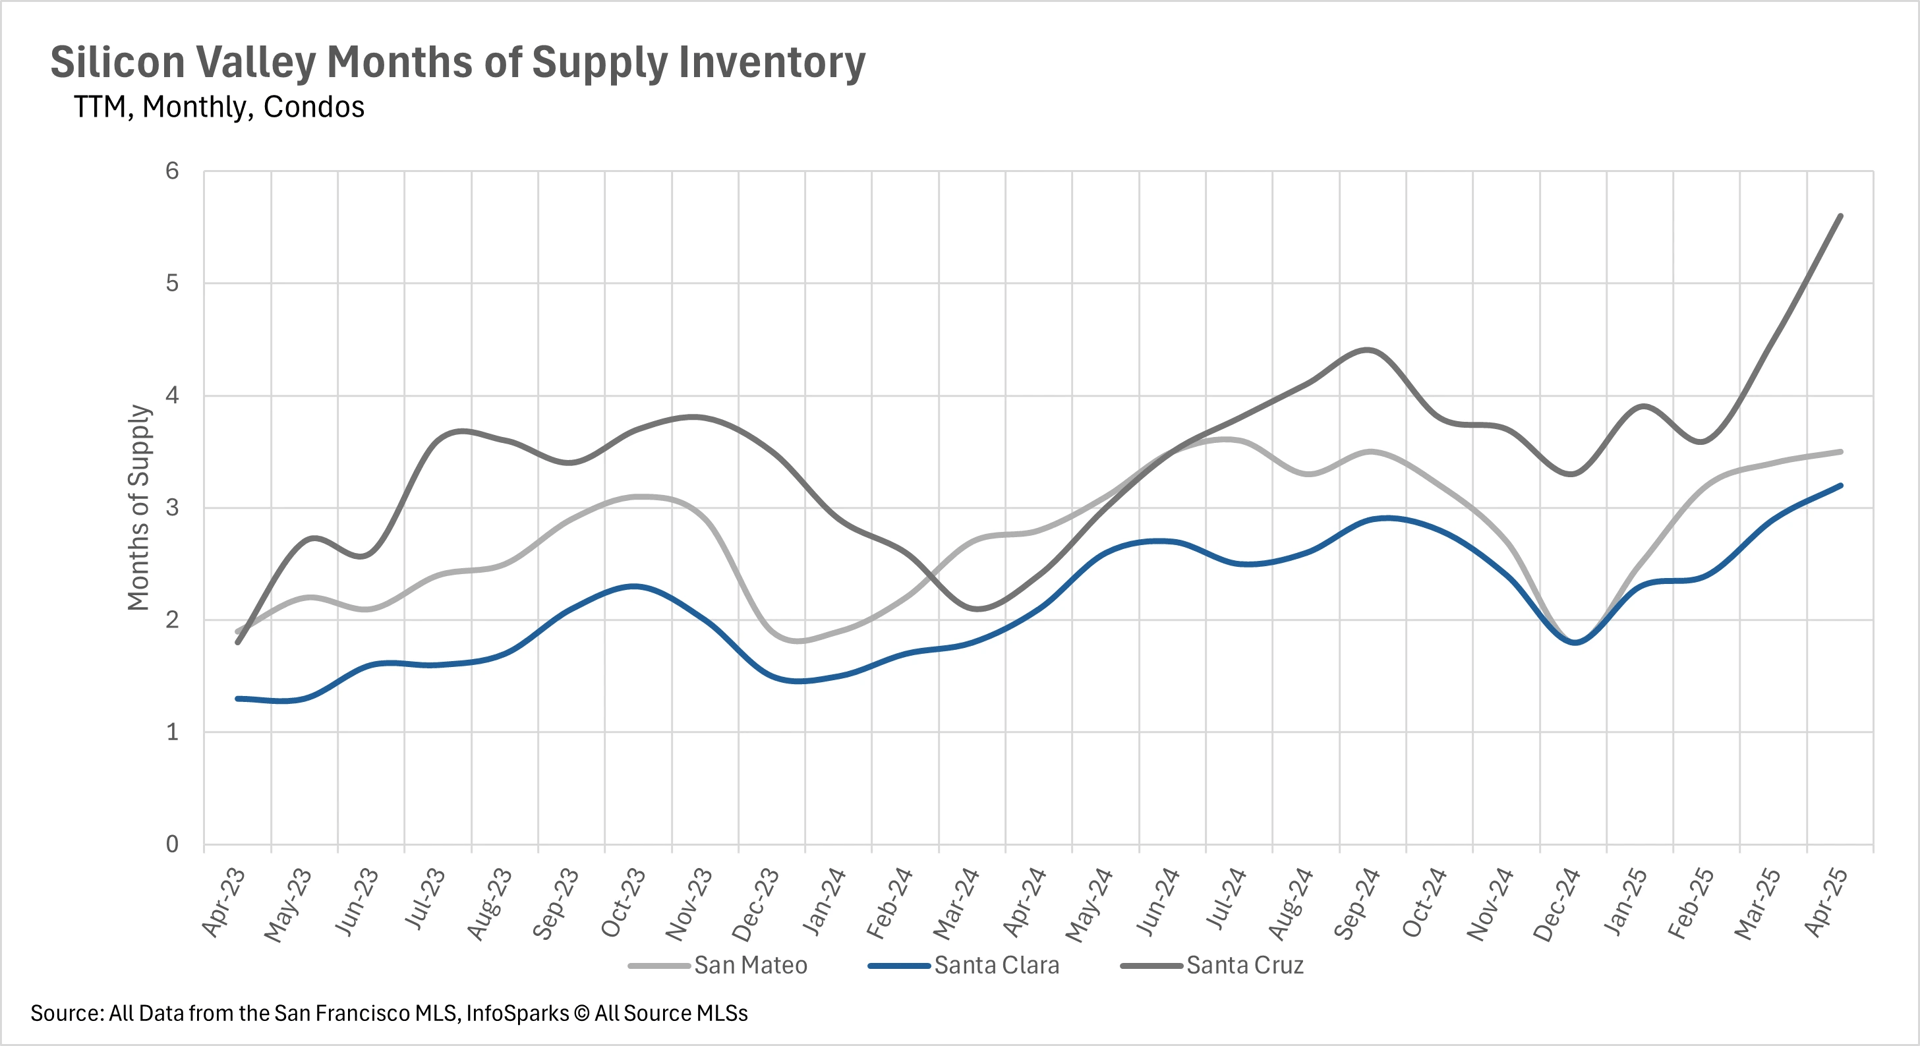
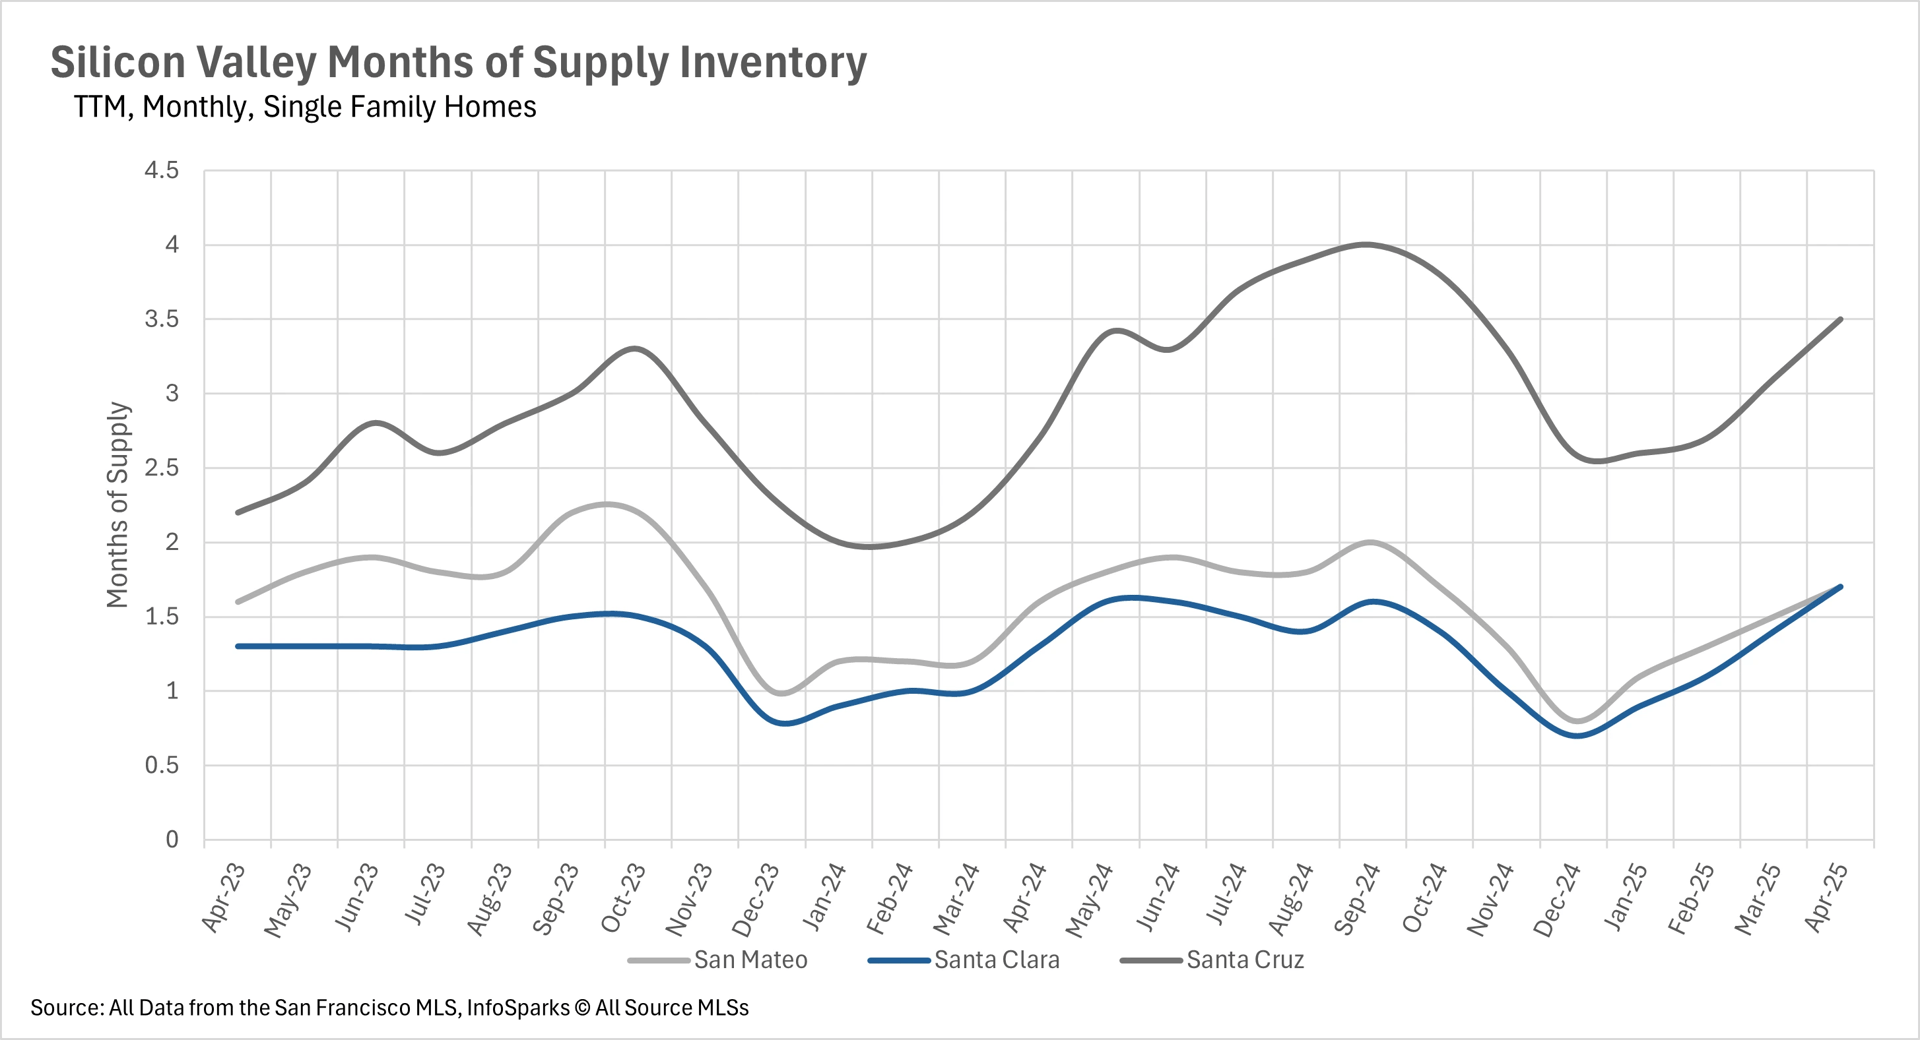
The months of supply inventory (MSI) metric shows a consistent pattern across the Bay Area, with single-family homes generally remaining in seller's market territory while condos favor buyers. In San Francisco, single-family homes have just 1.7 months of supply (strongly favoring sellers), while condos sit at 3.9 months (favoring buyers).

Silicon Valley shows a similar split, with San Mateo and Santa Clara Counties at 1.7 months for single-family homes, while condos range from 3.2 to 5.6 months of supply. The East Bay single-family market stands at 2.2 months in Alameda and 2.5 months in Contra Costa, suggesting sellers maintain leverage for now, though with rising inventory, this could shift toward a buyer's market this summer.

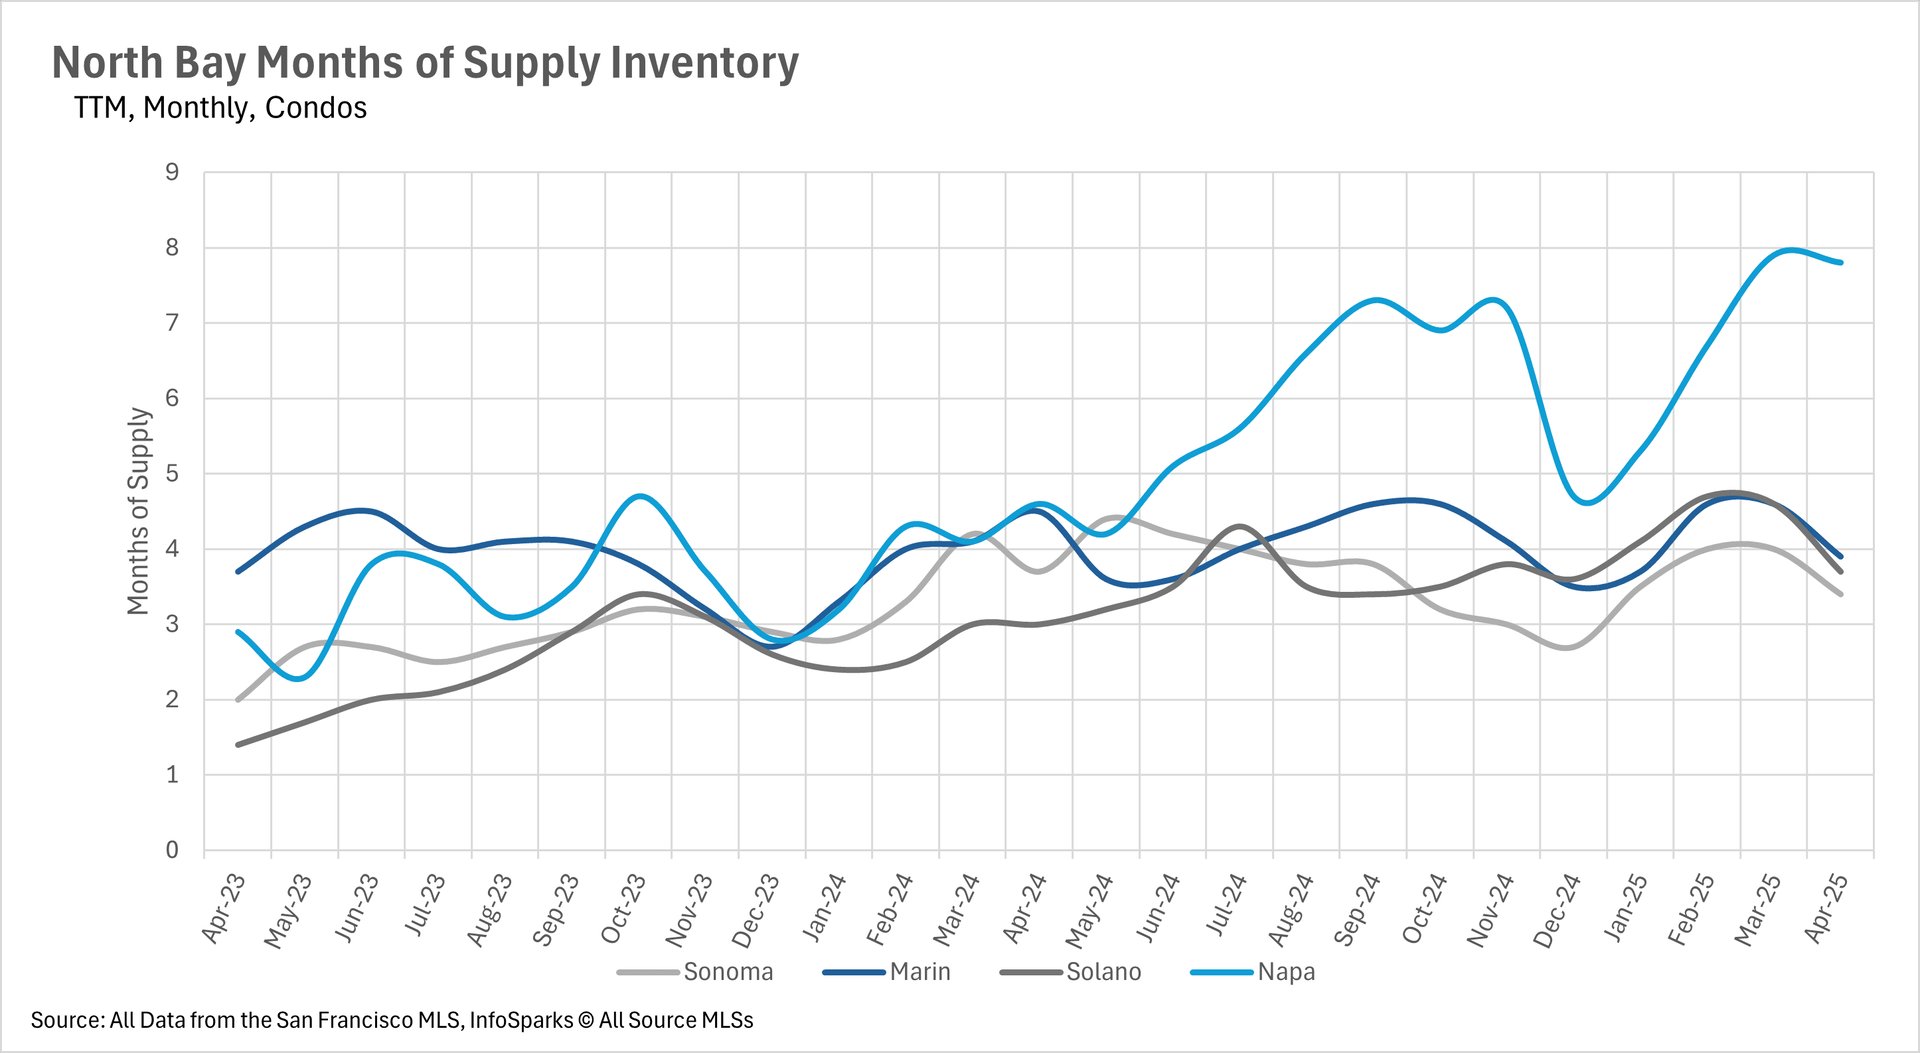
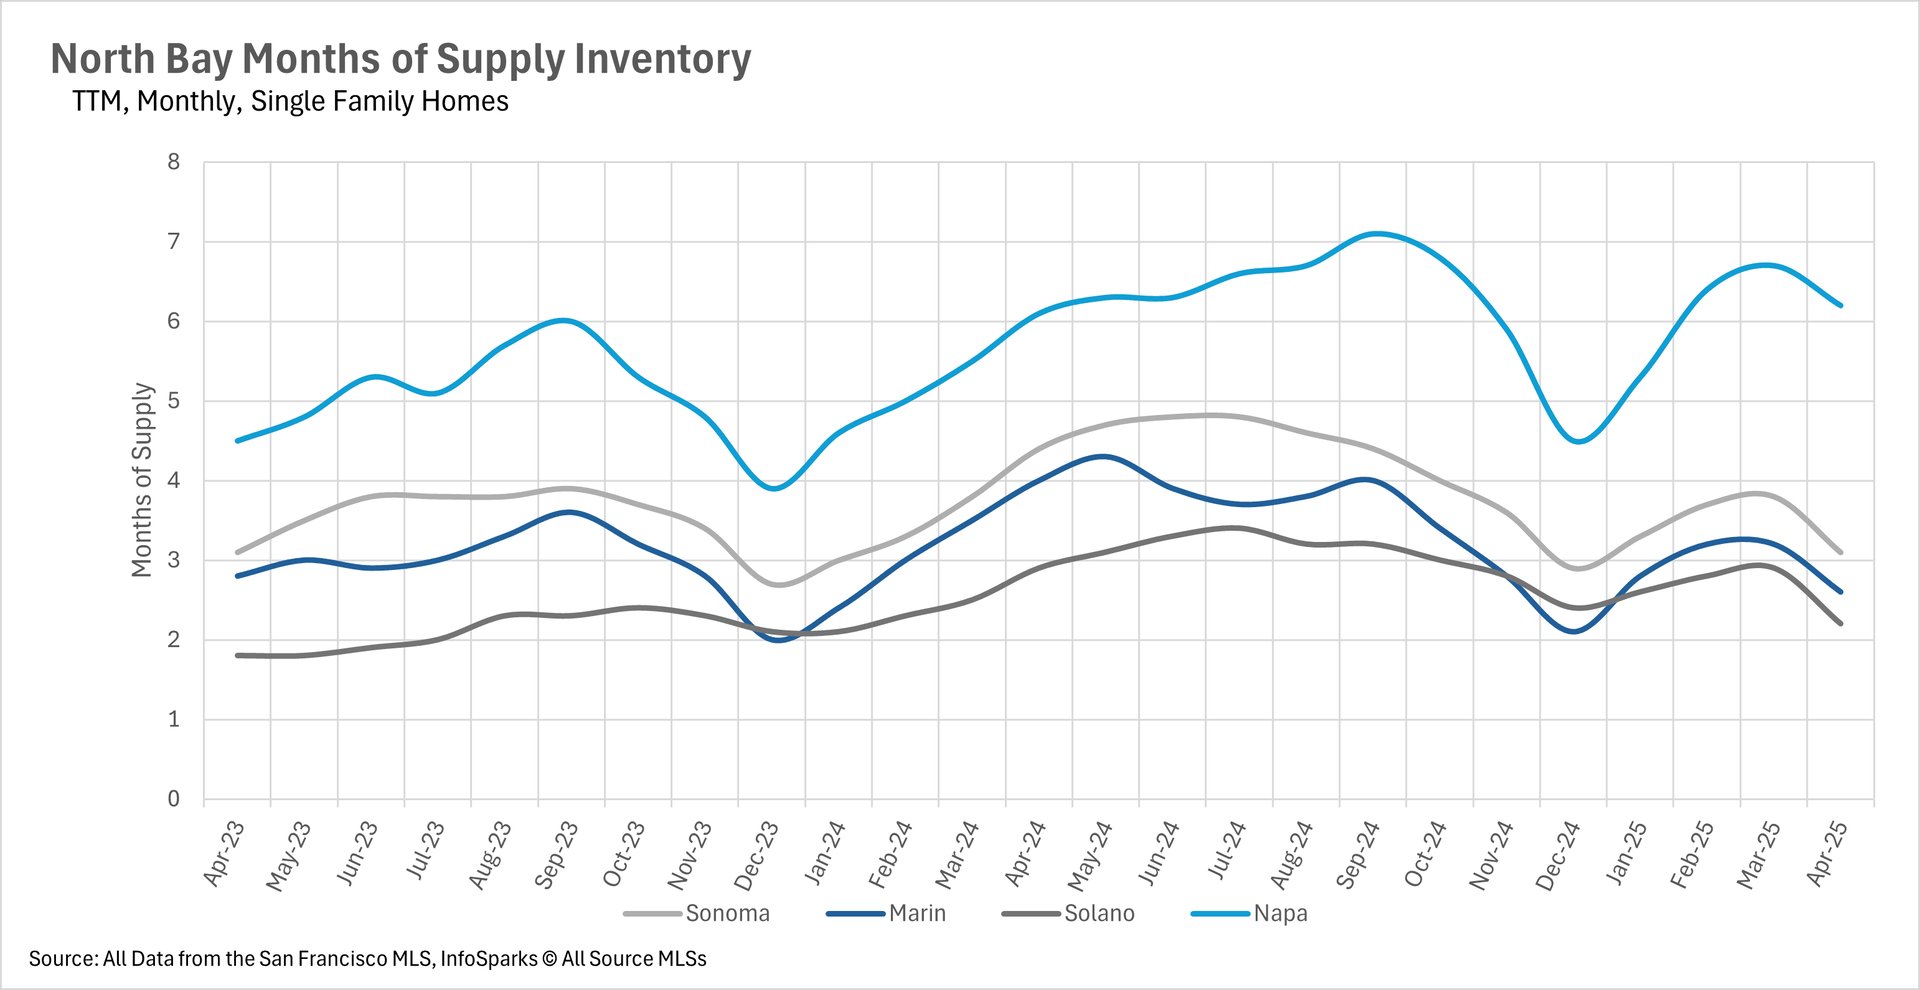
Meanwhile, East Bay condos clearly favor buyers with 4.7 and 3.9 months of supply in Alameda and Contra Costa Counties, respectively. The North Bay shows more variation, with Napa County at 6.2 months (strongly favoring buyers), Sonoma at 3.1 months (balanced), and Marin and Solano at 2.6 and 2.2 months, respectively (favoring sellers). This consistent pattern of lower MSI for single-family homes versus condos appears throughout the Bay Area, highlighting the continued preference for detached housing.

Local Lowdown Data

Line chart showing San Francisco average percent of original price for single-family homes and condos from 2022 to 2025, sourced from San Francisco MLS

Graph of San Francisco days on market for single-family homes and condos, monthly data from 2023 to 2025, San Francisco MLS

Bar chart of San Francisco condo inventory with new and sold listings, monthly data from 2023 to 2025, sourced from San Francisco MLS

Bar chart showing San Francisco single-family home inventory with new and sold listings, monthly from 2023 to 2025, San Francisco MLS

Histogram of San Francisco median price changes year-over-year for single-family homes and condos, 2024 to 2025, San Francisco MLS

Line graph of San Francisco median prices for single-family homes and condos, monthly from 2022 to 2025, sourced from San Francisco MLS

Line chart of San Francisco months of supply inventory for single-family homes and condos, monthly from 2023 to 2025, San Francisco MLS

Graph showing North Bay Days on Market (TTM, Monthly) for condos, with data trends for Sonoma, Marin, Solano, and Napa from April 2023 to April 2025, highlighting fluctuations in days on market over time.

Graph displaying North Bay Days on Market (TTM, Monthly) for single-family homes, showing trends for Sonoma, Marin, Solano, and Napa from April 2023 to April 2025, with varying days on market over the period.

Bar and line graph of North Bay Inventory for condos over two years, monthly data, comparing new listings, sold listings, and for-sale inventory from April 2023 to April 2025 across the region.

Bar and line graph illustrating North Bay Inventory for single-family homes over two years, monthly data, showing new listings, sold listings, and for-sale inventory from April 2023 to April 2025.

Bar graph of North Bay Median Condo Price Changes (TTM, Year-Over-Year) for Sonoma, Marin, Solano, and Napa from May 2024 to April 2025, indicating percentage changes in condo prices.

Line graph of North Bay Median Condo Prices over three years, monthly data, tracking trends for Sonoma, Marin, Solano, and Napa from April 2022 to April 2025.

Bar graph of North Bay Median Single-Family Home Price Changes (TTM, Year-Over-Year) for Sonoma, Marin, Solano, and Napa from May 2024 to April 2025, showing percentage variations in home prices.

Line graph of North Bay Median Single-Family Home Prices over three years, monthly data, depicting trends for Sonoma, Marin, Solano, and Napa from April 2022 to April 2025.

Line graph of North Bay Months of Supply Inventory (TTM, Monthly) for condos, showing trends for Sonoma, Marin, Solano, and Napa from April 2023 to April 2025, indicating supply levels over time.

Line graph of North Bay Months of Supply Inventory (TTM, Monthly) for single-family homes, illustrating trends for Sonoma, Marin, Solano, and Napa from April 2023 to April 2025, reflecting supply changes.

Line graph showing East Bay days on market for condos (TTM, monthly) from April 2023 to April 2025, comparing Alameda and Contra Costa counties. Data source: San Francisco MLS, InfoSparks.

Line graph displaying East Bay days on market for single-family homes (TTM, monthly) from April 2023 to April 2025, comparing Alameda and Contra Costa counties. Data source: San Francisco MLS, InfoSparks.

Bar and line chart illustrating East Bay condo inventory (two-year, monthly) from April 2023 to April 2025, showing new listings, sold listings, and for-sale listings. Data source: San Francisco MLS, InfoSparks.

Bar and line chart depicting East Bay single-family home inventory (two-year, monthly) from April 2023 to April 2025, showing new listings, sold listings, and for-sale listings. Data source: San Francisco MLS, InfoSparks.

Bar chart showing East Bay median condo price changes (TTM, year-over-year) from April 2024 to March 2025, comparing Alameda and Contra Costa counties. Data source: San Francisco MLS, InfoSparks.

Line graph depicting East Bay median condo prices (three-year, monthly) from April 2022 to April 2025, comparing Alameda and Contra Costa counties. Data source: San Francisco MLS, InfoSparks.

Bar chart displaying East Bay median single-family home price changes (TTM, year-over-year) from April 2024 to March 2025, comparing Alameda and Contra Costa counties. Data source: San Francisco MLS, InfoSparks.

Line graph showing East Bay median single-family home prices (three-year, monthly) from April 2022 to April 2025, comparing Alameda and Contra Costa counties. Data source: San Francisco MLS, InfoSparks.

Line graph illustrating East Bay months of supply inventory for condos (TTM, monthly) from April 2023 to April 2025, comparing Alameda and Contra Costa counties. Data source: San Francisco MLS, InfoSparks.

Line graph depicting East Bay months of supply inventory for single-family homes (TTM, monthly) from April 2023 to April 2025, comparing Alameda and Contra Costa counties. Data source: San Francisco MLS, InfoSparks.

Line graph showing Silicon Valley days on market for condos (TTM, monthly) from April 2023 to April 2025, comparing San Mateo, Santa Clara, and Santa Cruz counties. Data source: San Francisco MLS, InfoSparks.

Line graph displaying Silicon Valley days on market for single-family homes (TTM, monthly) from April 2023 to April 2025, comparing San Mateo, Santa Clara, and Santa Cruz counties. Data source: San Francisco MLS, InfoSparks.

Bar and line chart displaying Silicon Valley condo inventory (two-year, monthly) from April 2023 to April 2025, showing new listings, sold listings, and for-sale listings. Data source: San Francisco MLS, InfoSparks.

Bar and line chart illustrating Silicon Valley single-family home inventory (two-year, monthly) from April 2023 to April 2025, with new listings, sold listings, and for-sale listings. Data source: San Francisco MLS, InfoSparks.

Bar chart showing Silicon Valley median price changes for condos (TTM, year-over-year) from May 2024 to April 2025, comparing San Mateo, Santa Clara, and Santa Cruz counties. Data source: San Francisco MLS, InfoSparks.

Line graph depicting Silicon Valley median condo prices (three-year, monthly) from April 2022 to April 2025, comparing San Mateo, Santa Clara, and Santa Cruz counties. Data source: San Francisco MLS, InfoSparks.

Bar chart displaying Silicon Valley median price changes for single-family homes (TTM, year-over-year) from May 2024 to April 2025, comparing San Mateo, Santa Clara, and Santa Cruz counties. Data source: San Francisco MLS, InfoSparks.

Line graph showing Silicon Valley median single-family home prices (three-year, monthly) from April 2022 to April 2025, comparing San Mateo, Santa Clara, and Santa Cruz counties. Data source: San Francisco MLS, InfoSparks.

Line graph illustrating Silicon Valley months of supply inventory for condos (TTM, monthly) from April 2023 to April 2025, comparing San Mateo, Santa Clara, and Santa Cruz counties. Data source: San Francisco MLS, InfoSparks.

Line graph depicting Silicon Valley months of supply inventory for single-family homes (TTM, monthly) from April 2023 to April 2025, comparing San Mateo, Santa Clara, and Santa Cruz counties. Data source: San Francisco MLS, InfoSparks.

Let’s Talk

You’ve got questions and we can’t wait to answer them.

Follow Us on Instagram