

Our team is committed to continuing to serve all your real estate needs while incorporating safety protocols to protect all of our loved ones.
In addition, as your local real estate experts, we feel it’s our duty to give you, our valued client, all the information you need to better understand our local real estate market. Whether you’re buying or selling, we want to make sure you have the best, most pertinent information, so we’ve put together this monthly analysis breaking down specifics about the market.
As we all navigate this together, please don’t hesitate to reach out to us with any questions or concerns. We’re here to support you.
– Kevin Gueco, DRE #01461677
Welcome to our October newsletter. This month, we discuss the state of the economy, COVID-19, and potential economic stimulus. We will also look at forecasts for the housing market now that we are entering autumn. Overall, the housing market has shown significant price growth over the second quarter, showcasing the strength and stability of residential real estate. Year-over-year sales have also increased considerably through the summer months. As we enter autumn, we believe the housing market is positioned for continued growth in both sales and price appreciation. As the market changes, we will continue to provide the most up-to-date housing information to support your buying and selling decisions.
Welcome to our November newsletter. This month, we take a look at the ways in which current U.S. economic conditions are affecting local, state, and national real estate markets. In particular, we examine some crucial economic indicators, such as third-quarter Real Gross Domestic Product (GDP)1 and new housing permits. Although California’s COVID-19 cases remain fewer per capita than those of most other states, cases are rising in California, and the United States as a whole is seeing new peaks every day. Even amidst this uncertainty, demand for homes has never been higher. Mortgage rates continue at all-time lows, and buyers are devoting more of their total spending to housing costs. As we make our way through the autumn months, we continue to provide you with the most up-to-date market information so that you feel supported and informed in your buying and selling decisions.
In this month’s newsletter, we cover the following:
- Key Topics and Trends in November: U.S. GDP grew 7.4% in 2020’s third quarter,2 but is still 60% of where it would have been without the pandemic. The number of new housing permits is at its highest peak since the 2008–2009 recession. Hiring is slowing, and unemployment benefits have ended for many people.
- November Housing Market Updates: Single-family homes continue to experience high demand, lower inventory, and rising prices.
- Real GDP is inflation-adjusted GDP. All references to GDP use Real GDP figures.
- 33.1% annualized
Key Topics and Trends in November
In this issue, we dive into some key economic indicators that tend to affect long-term home prices. GDP and employment together explain much of the economic climate and typically trend with housing prices, but they do not explain the current rise in home prices. We will still go over the ins and outs of these indicators, however, because they have received so much press and may affect home prices in the future.
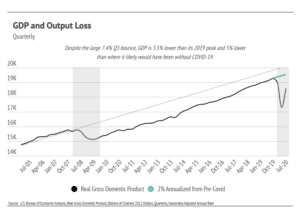
The U.S. Bureau of Economic Analysis reported a 7.4% third-quarter gain to GDP, which is the broadest measure of goods and services produced. During the second quarter of 2020, GDP dropped 9.5% quarter-over-quarter. The second-quarter drop was so sharp that the third-quarter bounce was expected. The long-term effects of the initial drop, however, have yet to be seen. Economists expect lower fourth-quarter GDP growth, which will not make up all the ground lost in the second quarter. Ultimately, the loss in GDP will likely be permanent.
The chart below illustrates the cost of a recession. While it depicts the U.S. GDP from 2005 to the present, it illustrates economic patterns that occur in all recessions. GDP tends to grow at a fairly consistent rate during economic expansions. The dotted line in the chart represents the predicted GDP had the 2008 financial crisis never happened, and the green line illustrates the expected third-quarter 2020 GDP had the pandemic never happened. As that green line shows, we are 40% below where GDP was expected to be this fourth quarter. In other words, we are still underwater despite the impressive third-quarter 2020 increase in GDP.
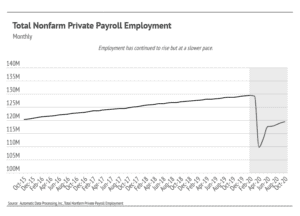
As of October, the Bureau of Labor Statistics reported that 11.1 million workers remained unemployed, which is an unemployment rate of 6.9%. However, the number of out-of-work individuals collecting unemployment insurance has dropped to 7.3 million. In September, the number of unemployed workers and the number of those collecting unemployment insurance were roughly the same. The large number of unemployed workers without government assistance will affect the rental market first, because those working in the hospitality and leisure industries have been most affected by unemployment, and those individuals tend to be renters rather than homeowners.
The employment level does matter in the long term, particularly for the housing market. Disposable personal income and savings, which both dropped in the third quarter, are two of the most important factors when considering whether or not to buy a home. As a result, we will continue to monitor these numbers.
Despite suboptimal major indicators, housing prices have risen considerably. Nationally, home prices have never been higher, and the high demand for single-family homes has dropped the Months of Supply Inventory to the lowest level ever, according to the National Association of Realtors. Months of Supply Inventory is an important marker of real estate market health because it measures how many months it would take for all current homes for sale on the market to sell at the current rate of sales. Low Months of Supply Inventory means that there is a high demand for homes that will push prices higher more rapidly.
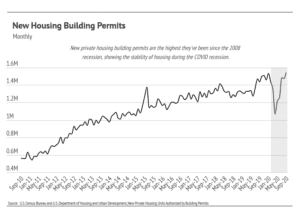
Not only are sales of existing homes up, but so are home building permits. The number of home building permits is the highest it’s been since the housing bubble burst in 2006.
The rise in housing demand and price under the current economic scenario speaks to three factors: (1) the asymmetric effect of the pandemic on personal income; (2) monetary policy (low-interest rates); and (3) buyer preference. Many people have not experienced negative financial effects from the pandemic. An average person who did not lose their job may have even gained financially through a decrease in expenses. Less opportunity for travel, entertainment, and leisure activities could result in an increase in savings. At the same time, mortgage rates are historically low (2.78% as of November 5, 2020) and will remain low for the foreseeable future, making financing higher-priced homes more affordable. And finally, because so much time is currently being spent at home, buyers are willing to use more of their income to create nicer living spaces, buying larger homes, luxury furniture, and new appliances.
In both the short and long terms, housing is one of the best investments one can make.
November Housing Market Updates for selected Los Angeles Areas
In this newsletter, we break down three luxury areas in Los Angeles as follows:
- North Beach: includes the Pacific Palisades, Santa Monica, and Venice
- West Side: includes Beverly Hills, Brentwood, West Hollywood, and Westwood
- South Bay: includes Hermosa, Manhattan Beach, and Redondo
In September, single-family home prices rose in North Beach and the West Side on a month-over-month basis. North Beach prices have been fairly stable this year on an absolute dollar basis and showed a year-over-year increase this month. The West Side, which tends to be more volatile, has seen a significant median price reduction since March, the start of the pandemic. The South Bay has seen the highest demand and largest price increases this year.
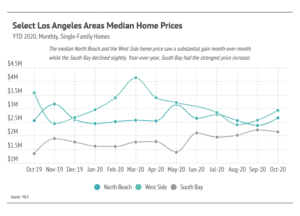
Note: June data removed from the median price because it is not representative. June’s median price for the West Side was over $8 million.
Year-over-year, median home prices were mixed across neighborhoods. South Bay prices rose considerably relative to last year.

Note: June data removed from the median price because it is not representative. June’s median price change for the West Side was over 200%.
Home sales have climbed since the initial months of the pandemic (March through May). Generally, buyers and sellers left the market in April and May, causing pent-up demand. Sales increased and are still near the highest level this year for single-family homes. Usually, we expect sales to decline in the autumn and winter months, but this year’s summer selling season was delayed and seems to be spilling into autumn. North Beach and South Bay continue to see a high level of demand, corresponding to higher sales. Enough new listings are coming to market, which has kept inventory levels similar to last year.


The Days on Market (DOM) rose slightly, indicating that demand may be waning. This is typical in the autumn and winter months. Months of Supply Inventory rose slightly, as inventory was stable and the pace of sales was marginally slower.

We can use the Months of Supply Inventory (MSI) as a metric to judge whether the market favors buyers or sellers. The average MSI is three months in California, which indicates a balanced market. An MSI lower than three means that buyers dominate the market and there are relatively few sellers (i.e., it’s a sellers’ market), while a higher MSI means there are more sellers than buyers (i.e., it’s a buyers’ market). The MSI is 4.5 for North Beach, 12.4 for the West Side, and 2.3 for South Bay. North Bay and the West Side favor buyers, while South Bay favors sellers.

In summary, the high demand in selected Los Angeles Areas seen over the last several months may be declining. Inventory has remained steady, but will likely decline further as we enter the winter months with fewer sellers coming to market, potentially lifting prices higher. Overall, the housing market has shown its resilience through the pandemic and remains one of the safest asset classes. Economic indicators are in an anomalous state, meaning that they are out of trend with each other. The data show that housing has remained consistently strong throughout this period.
We anticipate new listings to slow through the holiday months. The autumn/winter season tends to see a slowdown in activity, although we may see a new trend this year with higher-than-normal sales.
As always, we remain committed to helping our clients achieve their current and future real estate goals. Our team of experienced professionals are happy to discuss the information we have shared in this newsletter. We welcome you to contact us with any questions about the current market or to request an evaluation of your home.
Interested in a monthly market update? Subscribe here.