Sunset at Mt. Diablo State Park, Contra Costa County, California

East Bay Real Estate Market Report - June 2025

The Local Lowdown

Quick Take:

  • Median sale prices in the East Bay remain shockingly resilient, barely moving on a year-over-year basis.
  • With considerably more inventory on the market than this time last year, inventories have exploded in the East Bay.
  • Although Inventories are up, listings are still being bought up at break-neck speeds.

Note: You can find the charts/graphs for the Local Lowdown at the end of this section.

The East Bay has retained its tremendous resilience

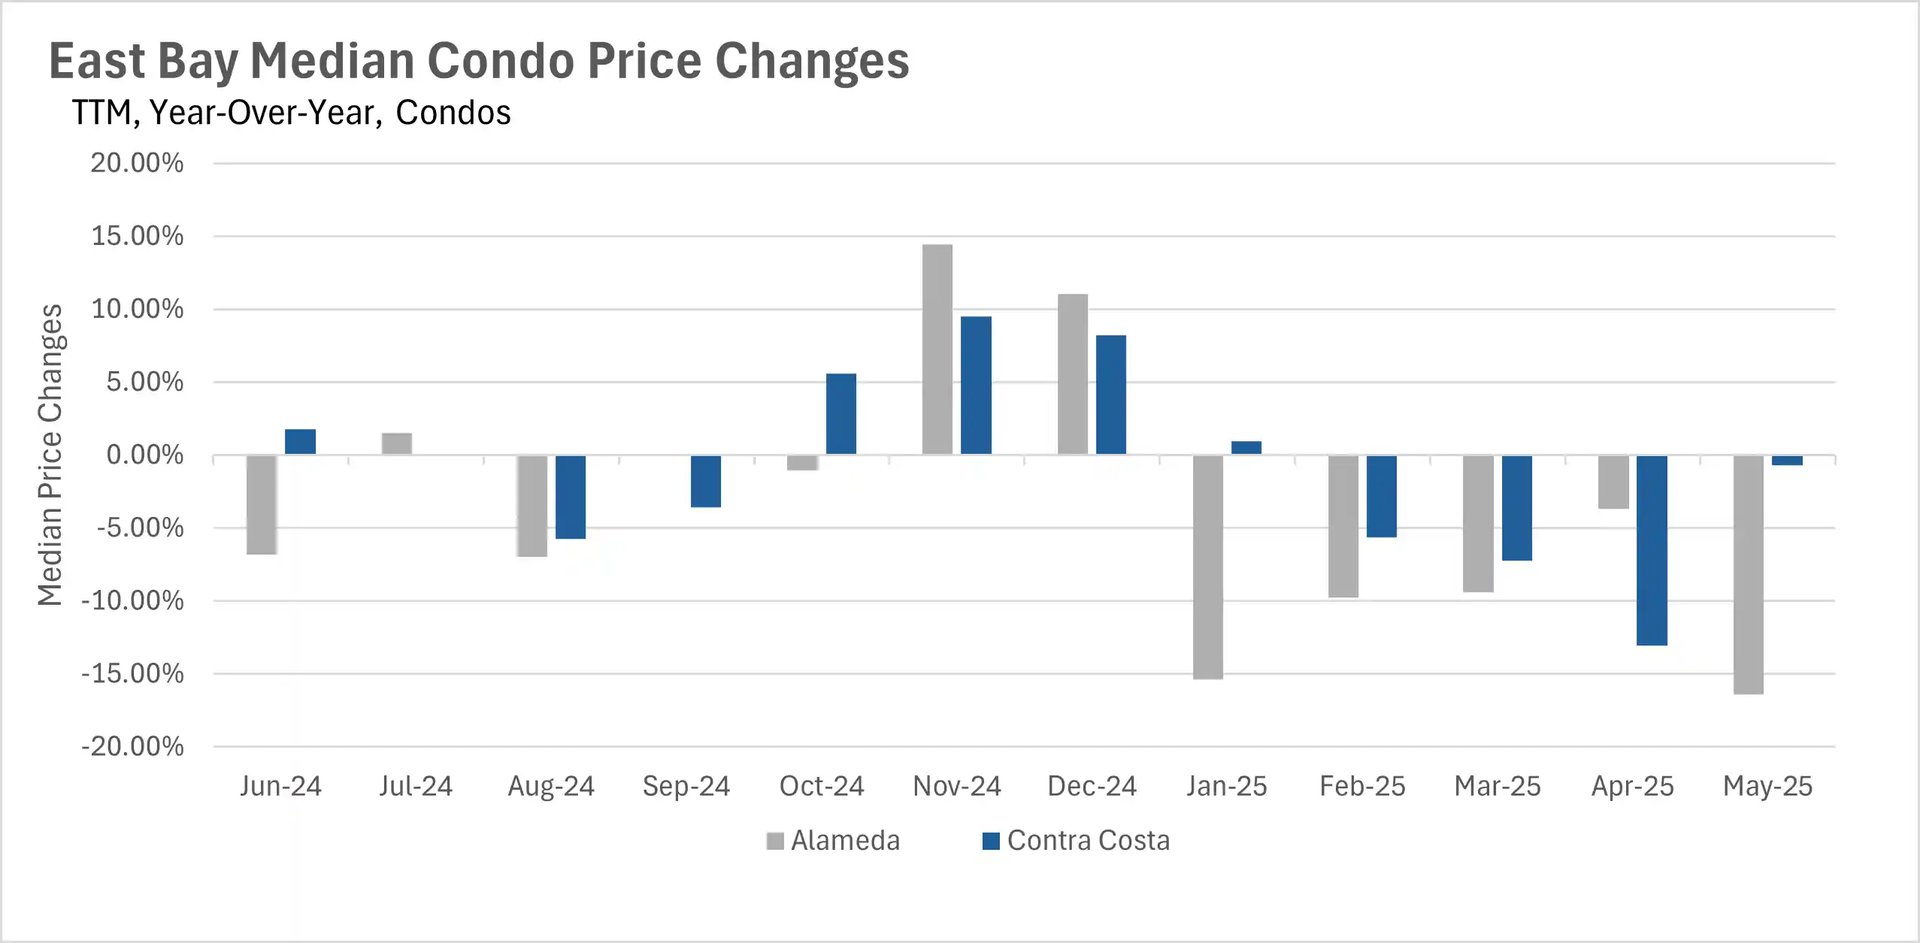
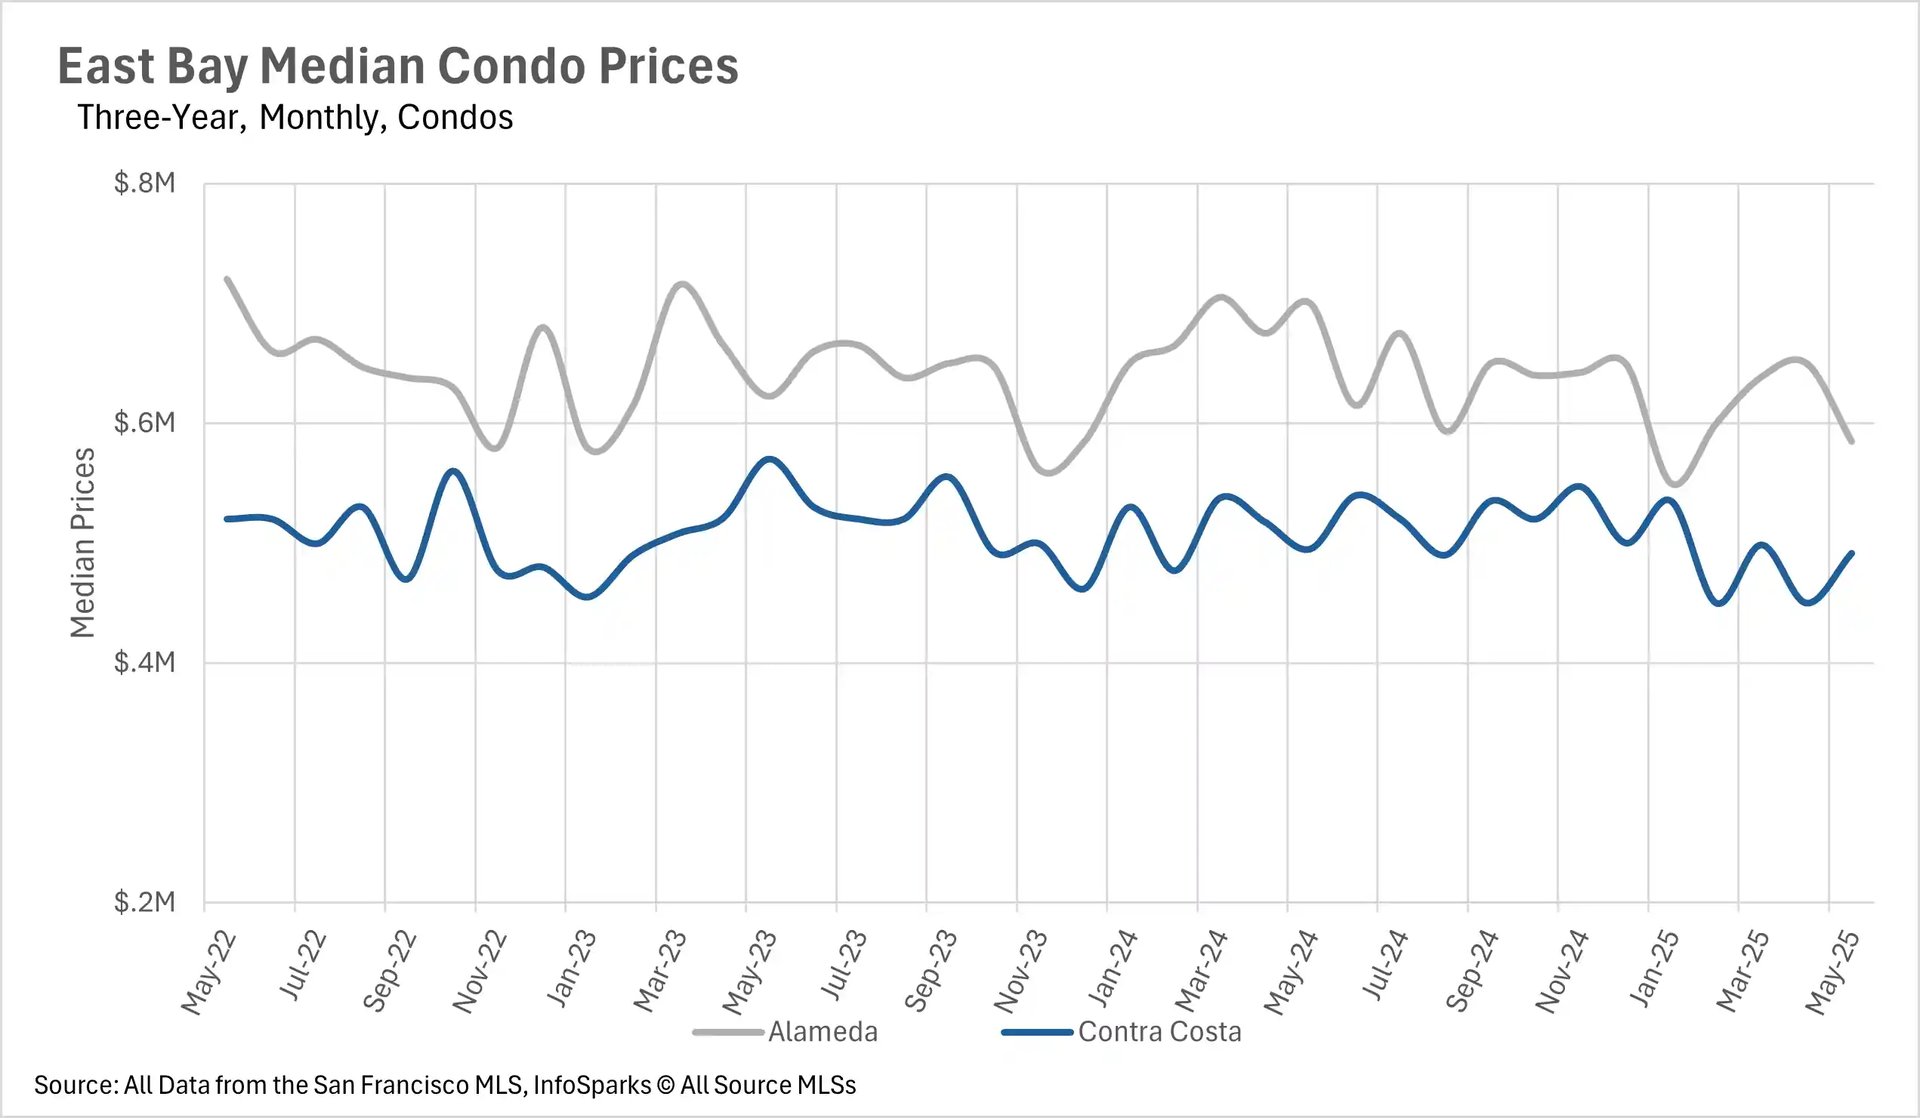
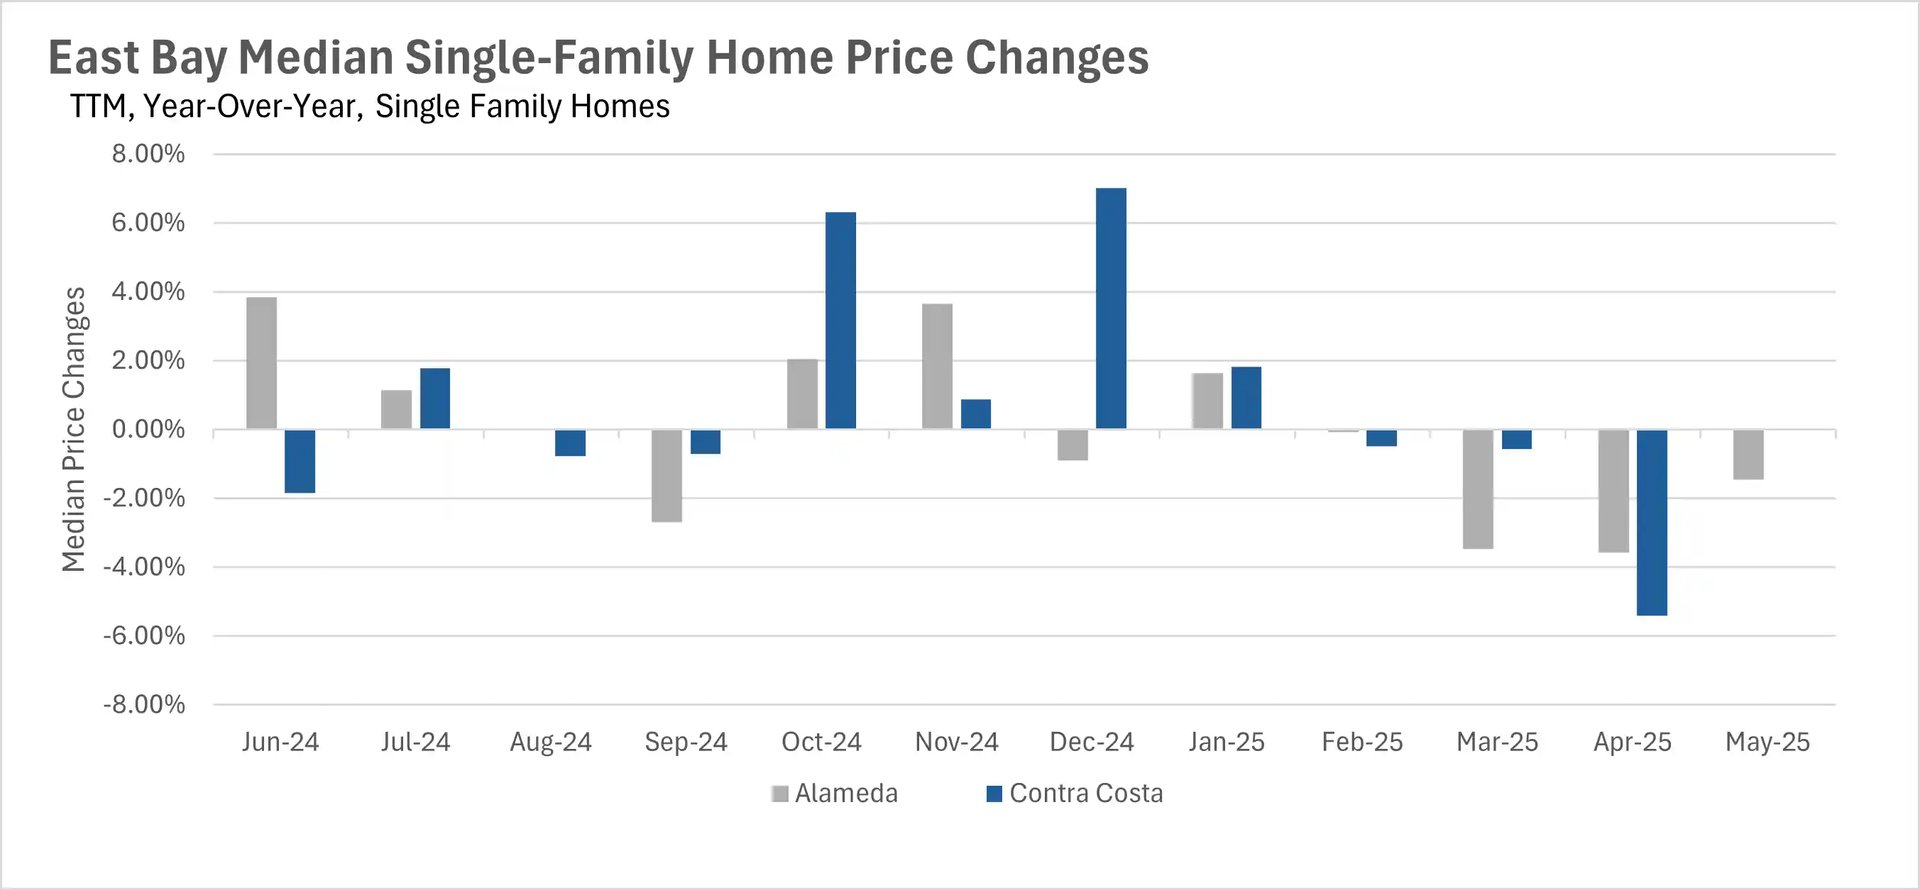
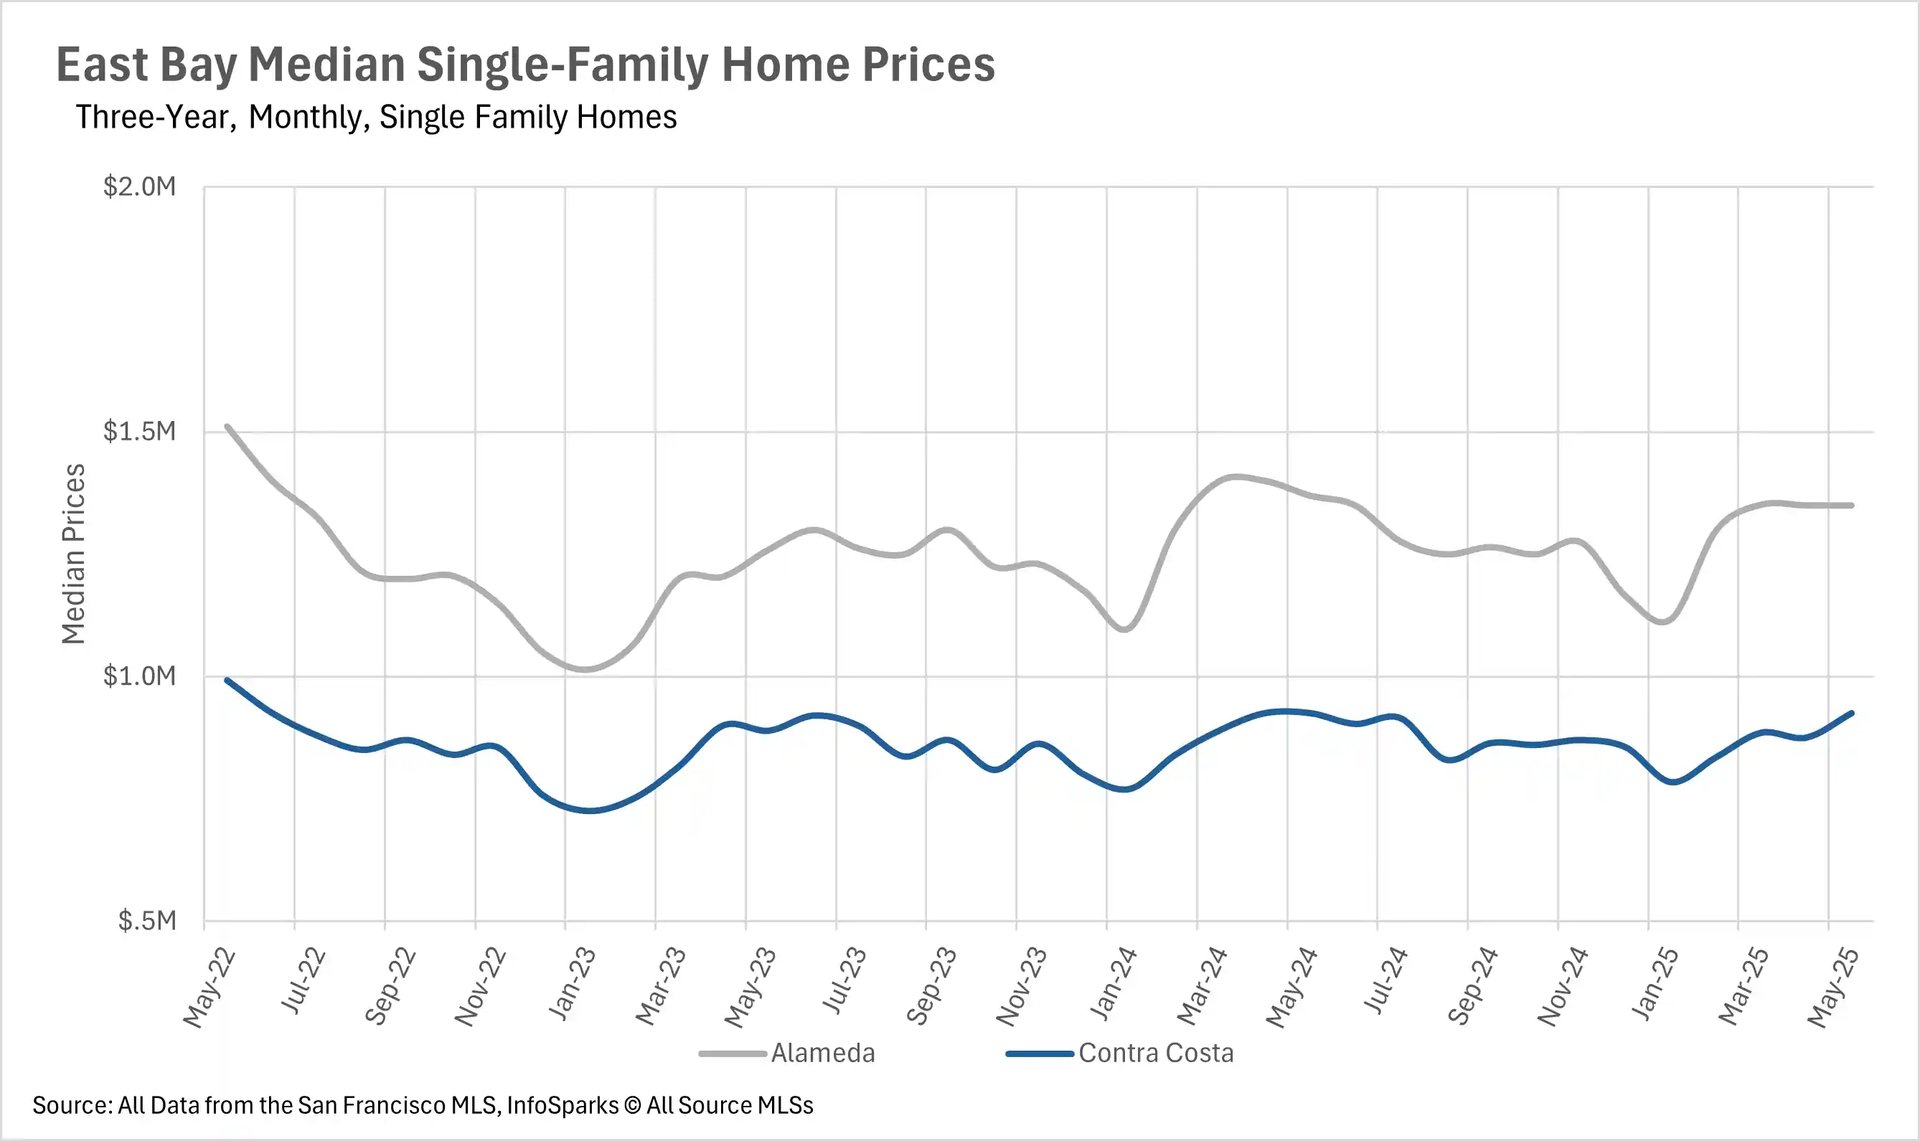
Over the course of the past two years, single-family homes in the East Bay have had shockingly little movement in median sale prices, making it one of the least volatile counties within the Bay Area. Last month, the East Bay extended this streak, as median sale prices for single-family homes decreased by 0.01% in Contra Costa County, and 1.46% in Alameda County. On the flip side, the condo market hasn’t enjoyed this stability so far this year. Median sale prices for condos in Alameda County were down 16.43% on a year-over-year basis in Alameda County, while median sale prices in Contra Costa County were down just 0.71%.

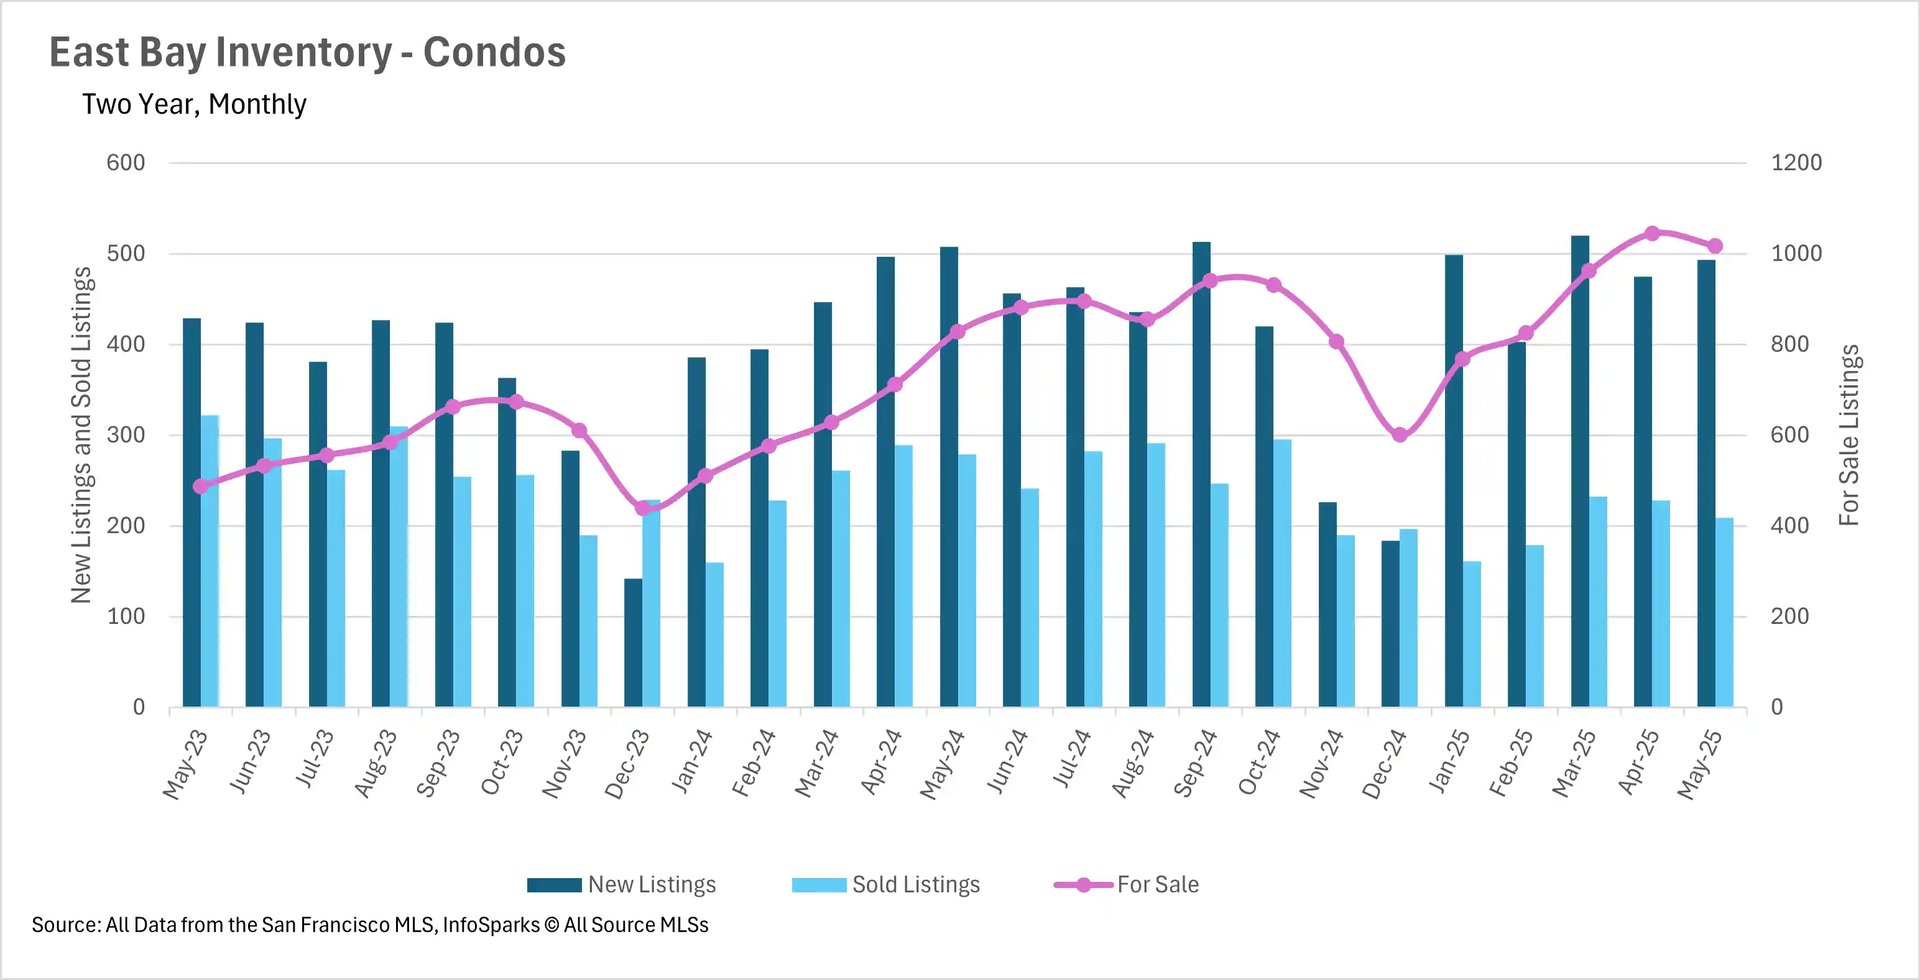
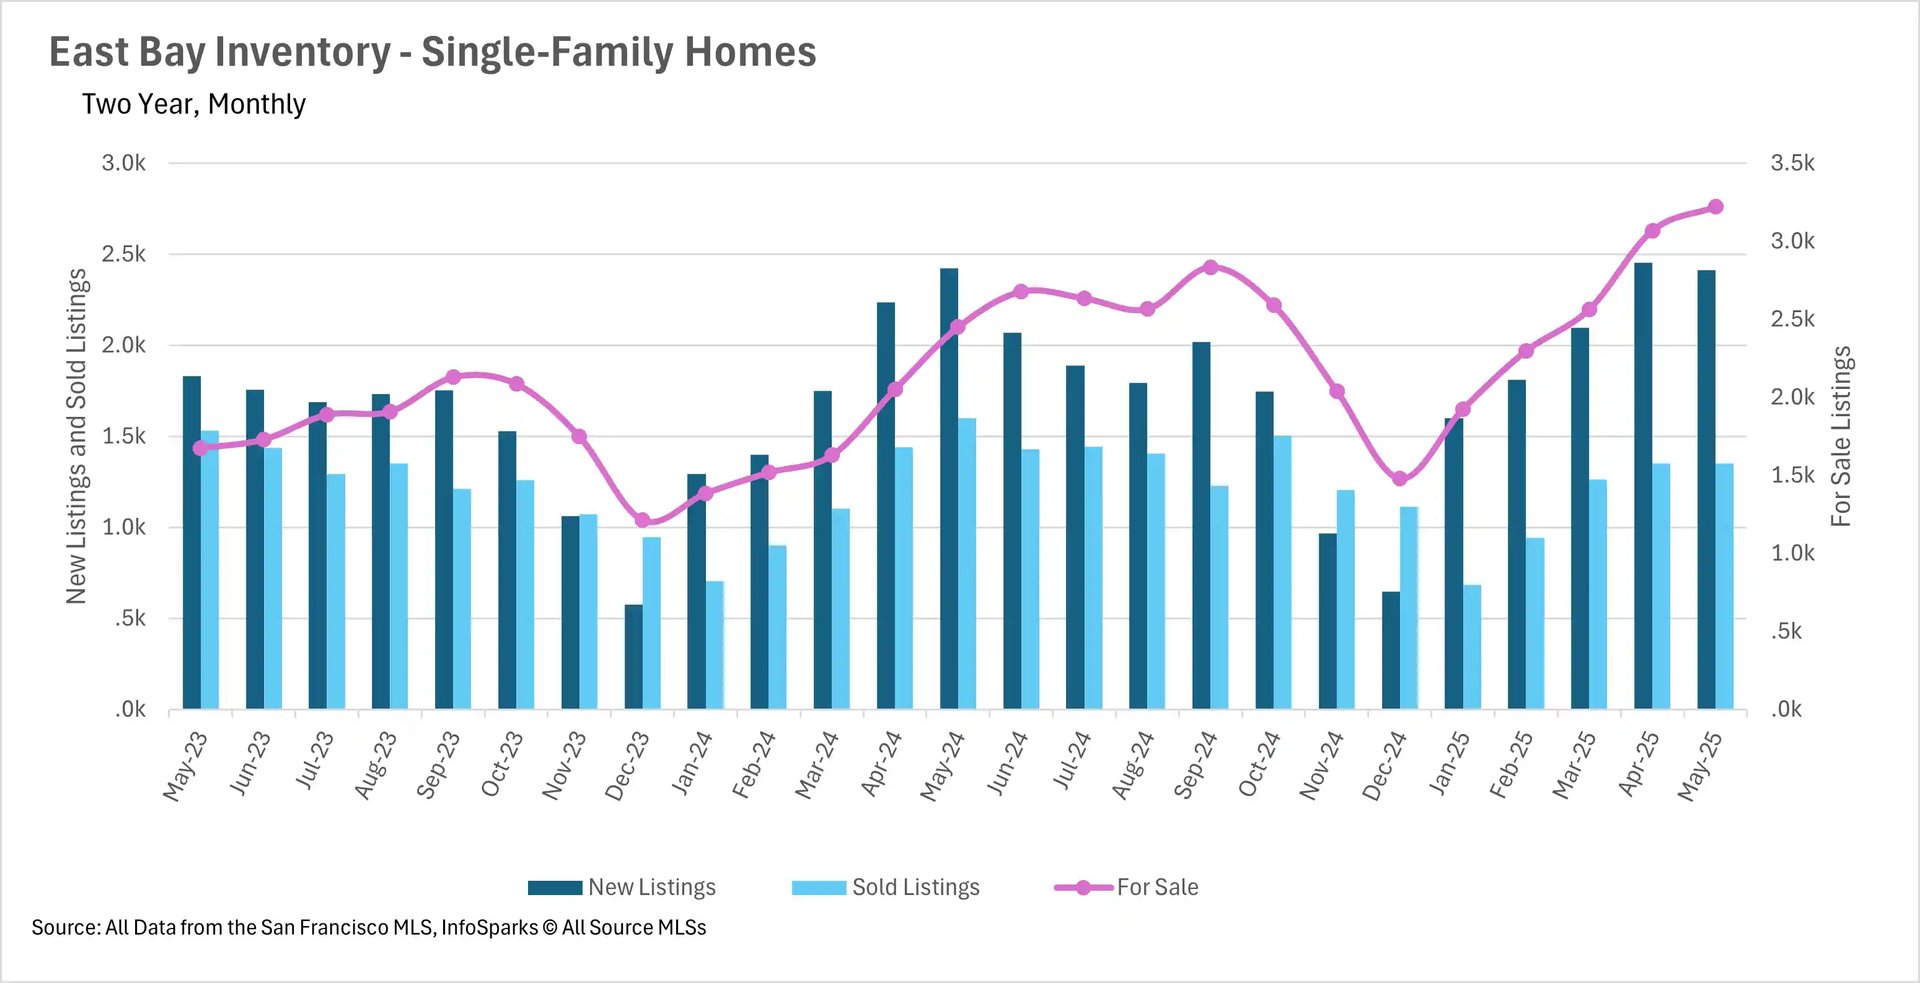
Inventory levels continue to surge upward throughout the East Bay

Although prices have been incredibly resilient in the East Bay, the future of this stability is very uncertain, as inventories have been growing at a tremendous rate. In the single-family home market, the East Bay saw a new 2-year high in terms of inventory, as the number of active listings grew by 31.42% on a year-over-year basis. Condo inventories pulled back from their 2-year high this month, but still grew by 22.80% on a year-over-year basis.

While there are roughly the same number of single-family homes and condos hitting the market, what’s causing inventories to spike is the fact that fewer listings are being sold. We saw 15.57% fewer single-family homes and 25.09% fewer condos sold in the month of May when compared to a year ago.

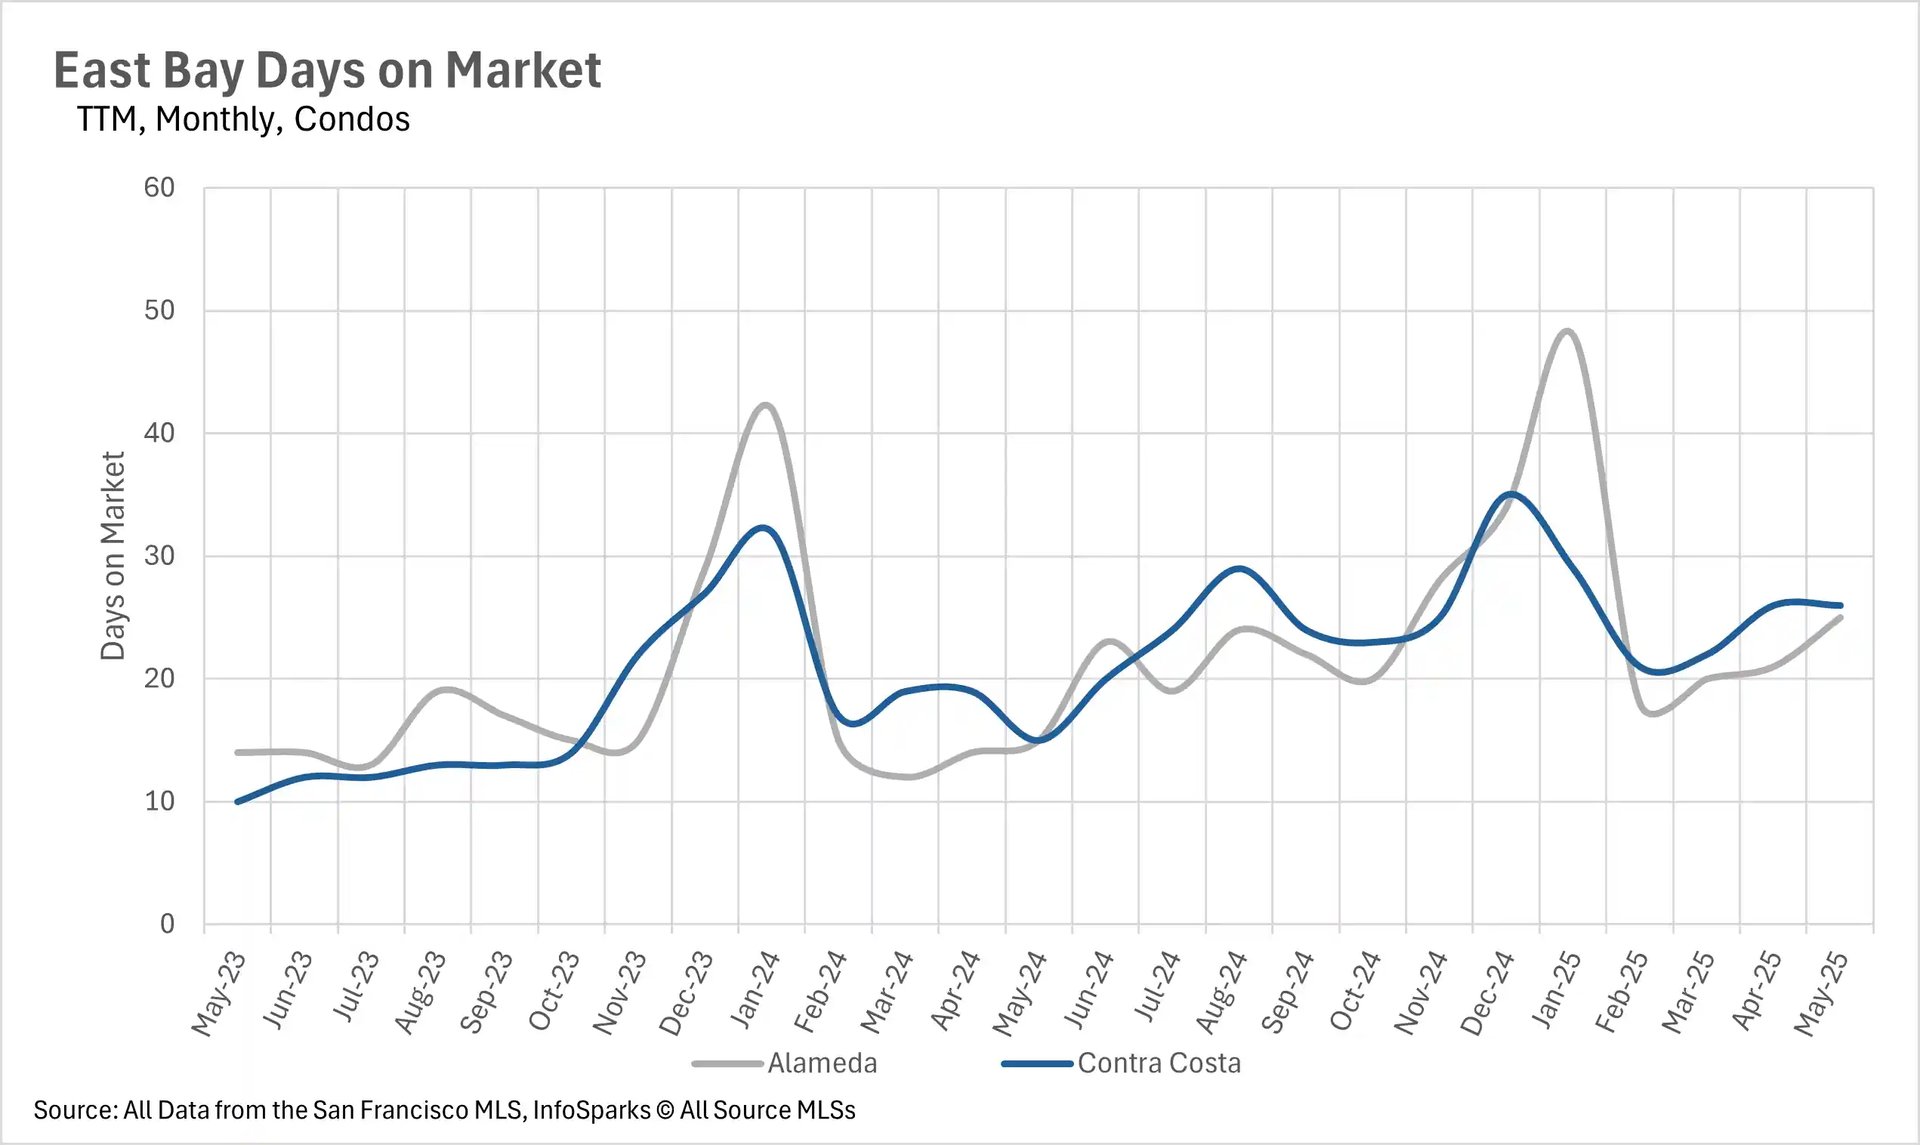
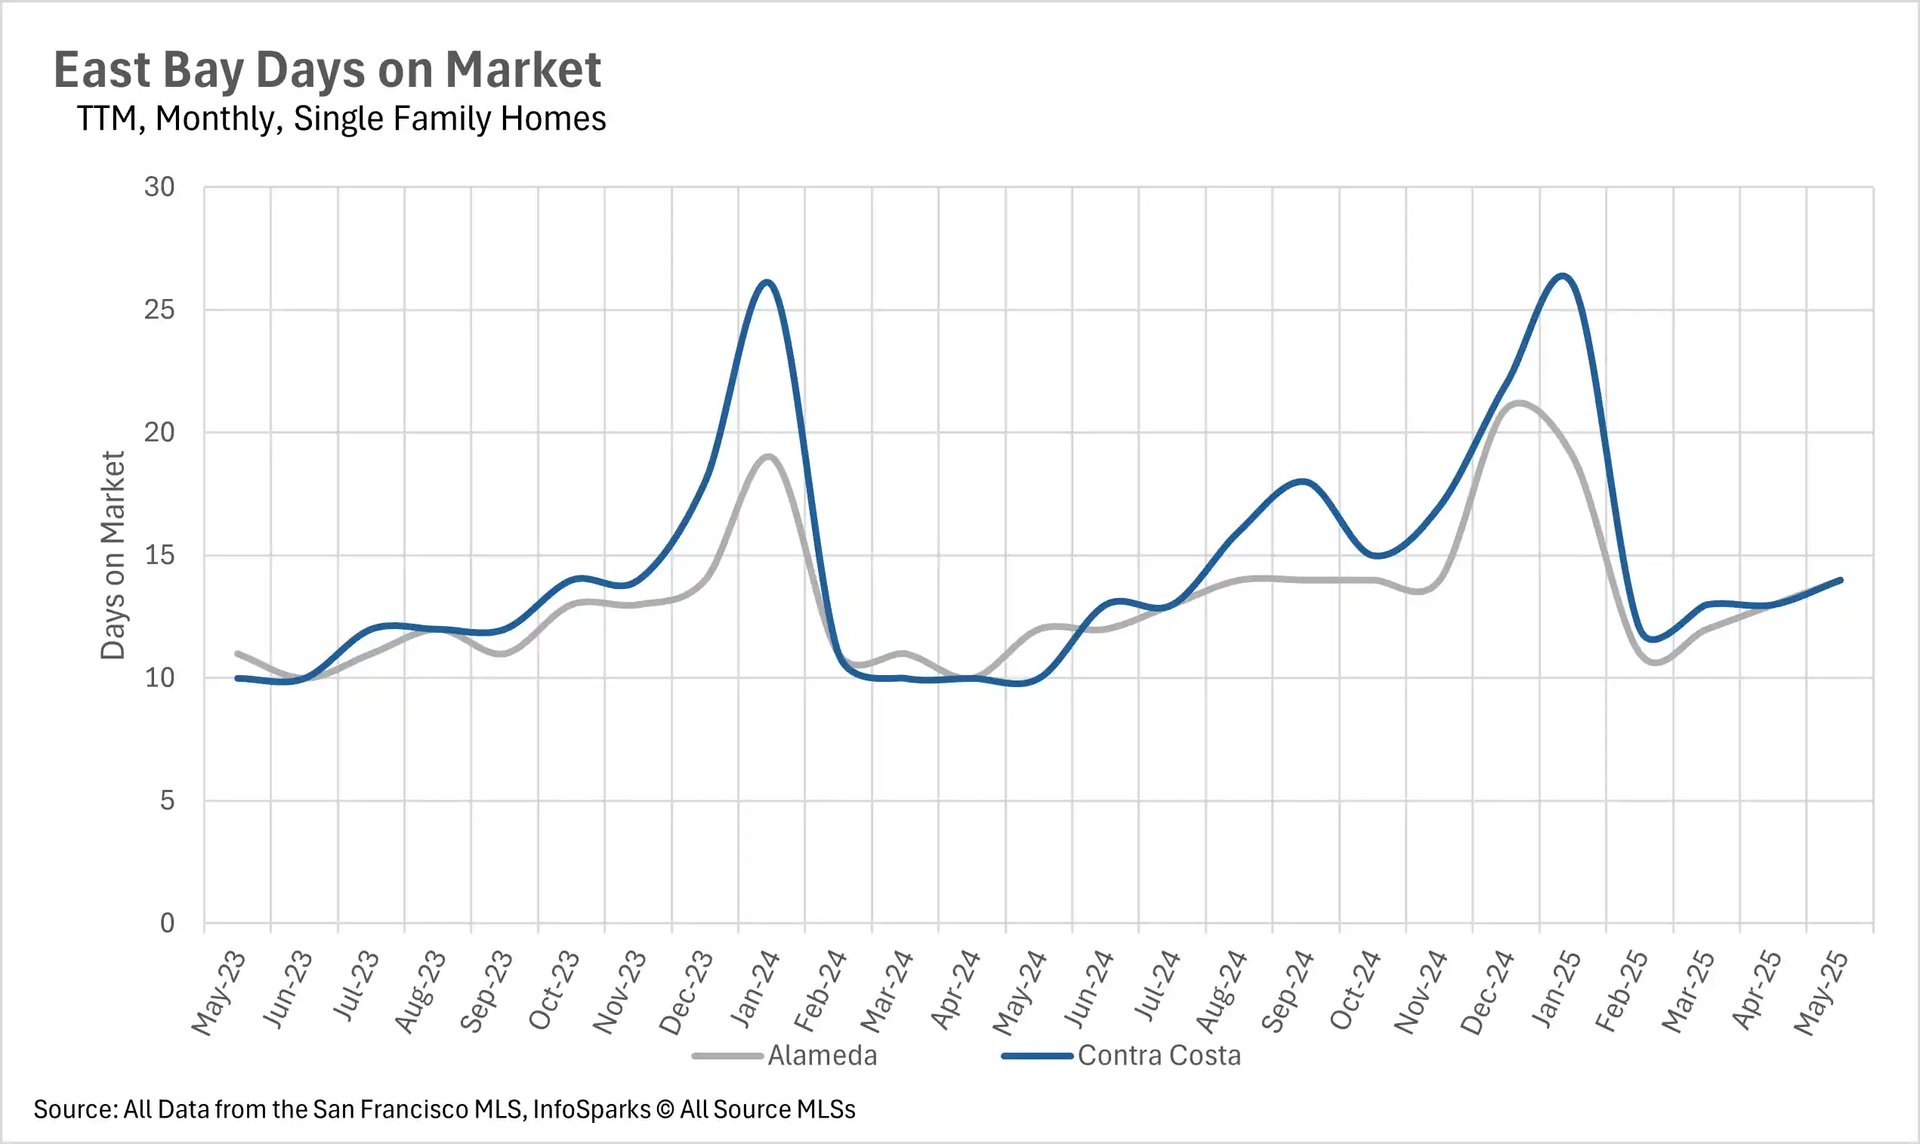
Listings are spending comparatively more time on the market

The East Bay is quite interesting when you look at the amount of time listings are spending on the market. If I told you that the average single-family home in Contra Costa County is spending 40% more time on the market now than it was last year, you’d probably assume that listings are sitting for weeks on end. However, homes are still moving incredibly quickly. Despite spending 40% more time on the market, the average single-family home in Contra Costa County is taken off the market in just 14 days.

The single-family market is dominated by sellers, while the condo market is controlled by buyers

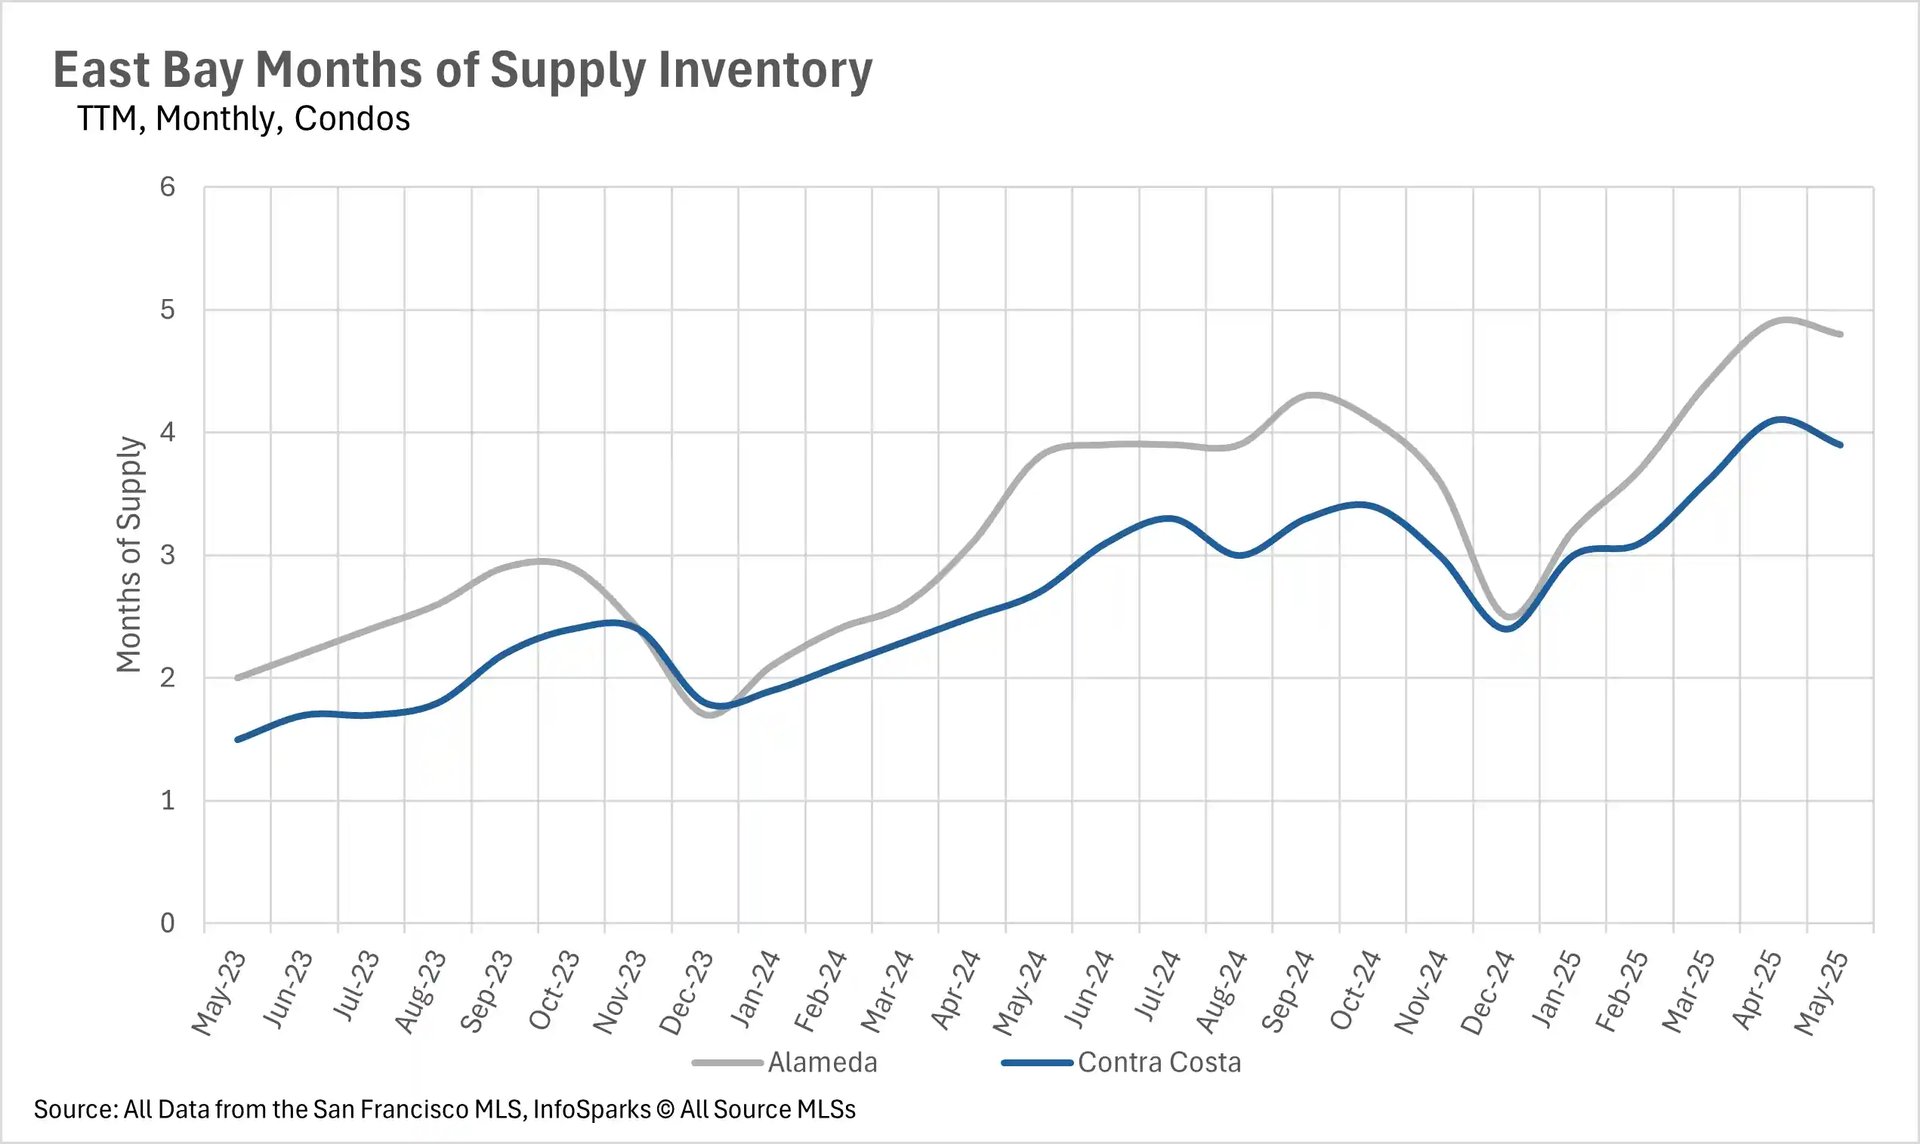
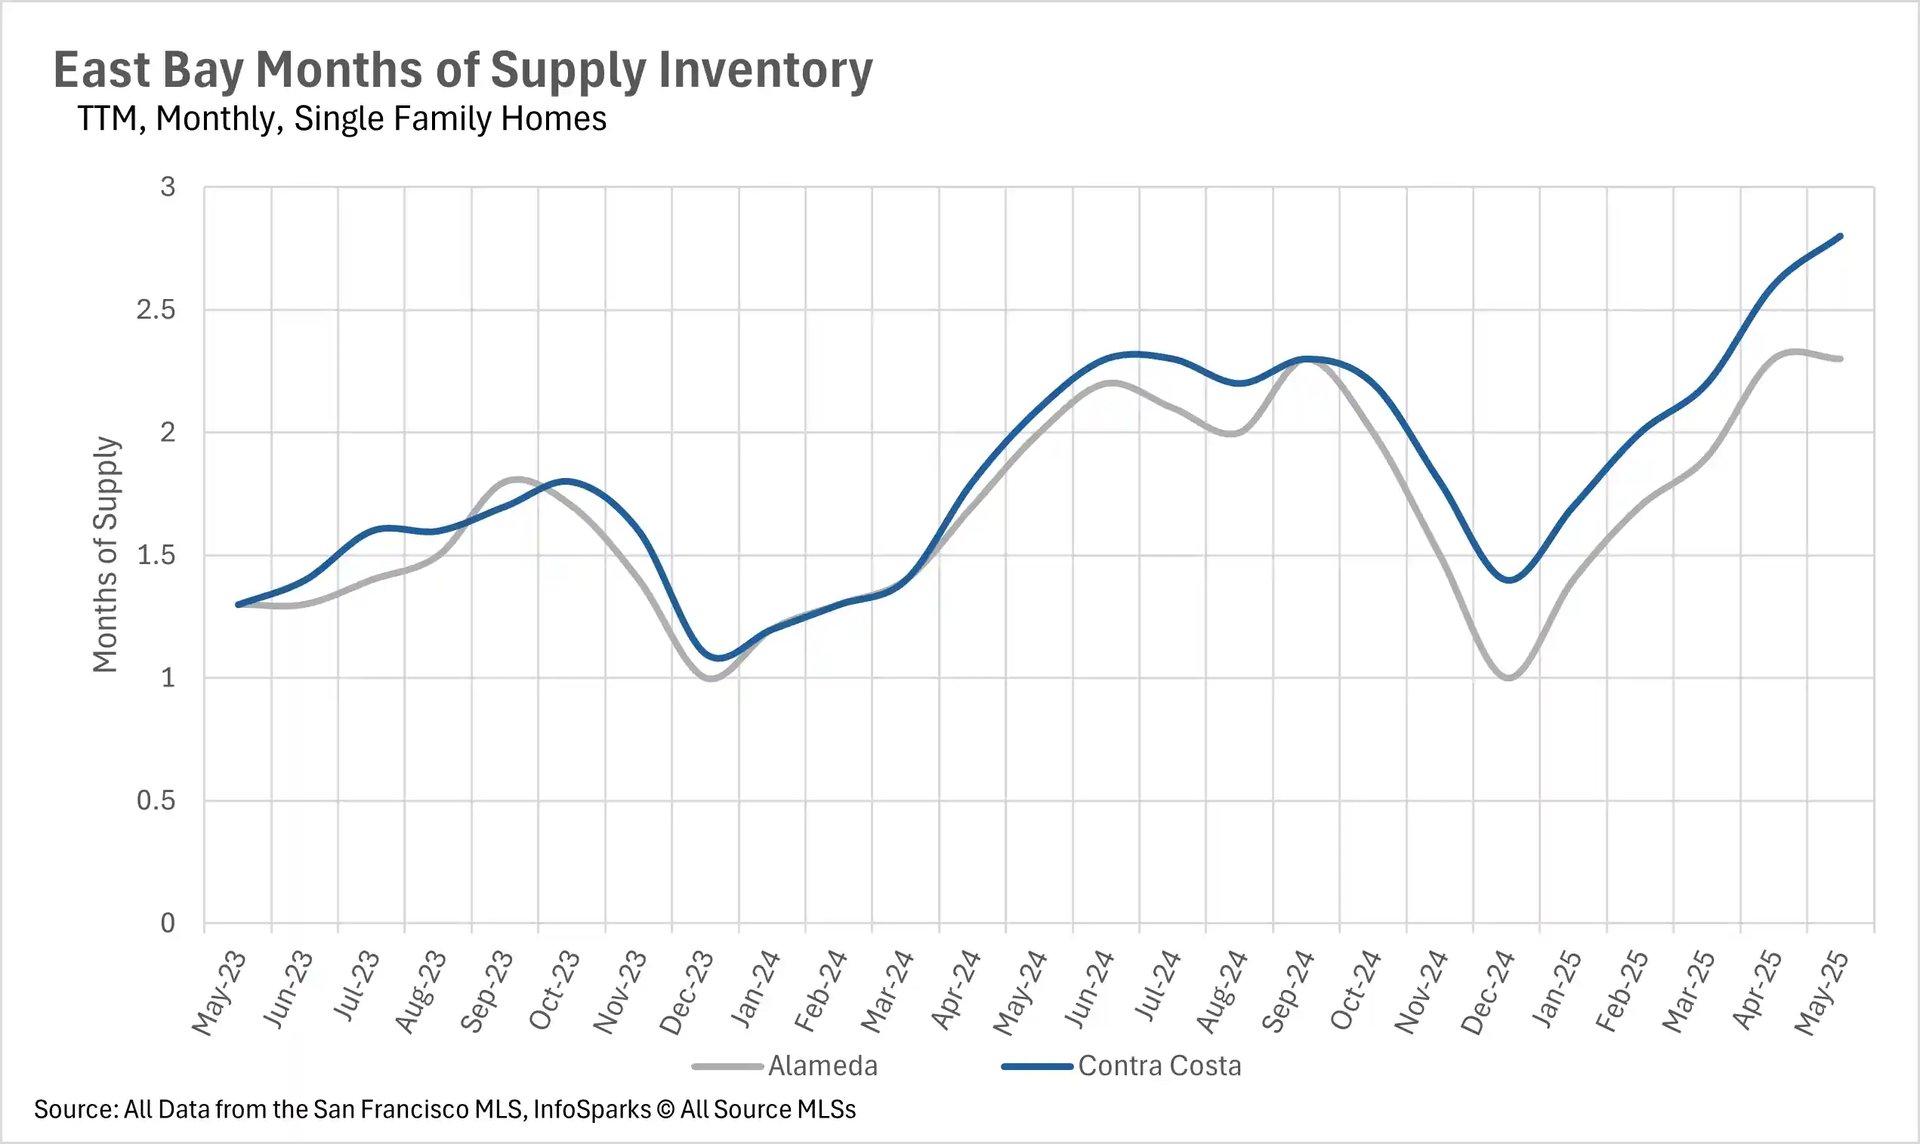
When determining whether a market is a buyers’ market or a sellers’ market, we look to the Months of Supply Inventory (MSI) metric. The state of California has historically averaged around three months of MSI, so any area with at or around three months of MSI is considered a balanced market. Any market that has lower than three months of MSI is considered a sellers’ market, whereas markets with more than three months of MSI are considered buyers’ markets.

The East Bay continues to be divided, with buyers having more control of the condo market, and sellers having more control of the single-family market. In terms of single-family homes, there are 2.3 months and 2.8 months worth of supply on the market in Alameda and Contra Costa Counties, respectively. Whereas there are 4.8 and 3.9 months worth of condo supply on the market in those same areas.

Local Lowdown Data

A line graph titled 'East Bay Days on Market TTM, Monthly, Condos' showing the average days on market for condos in Alameda and Contra Costa from May 2023 to May 2025. The y-axis represents days on market (0 to 60), and the x-axis shows months. Alameda data is in gray, and Contra Costa data is in blue, with both lines fluctuating over time. Source: San Francisco MLS, InfoSparks © AllSource MLSs.

A line graph titled 'East Bay Days on Market TTM, Monthly, Single Family Homes' showing the average days on market for single-family homes in Alameda and Contra Costa from May 2023 to May 2025. The y-axis represents days on market (0 to 30), and the x-axis shows months. Alameda data is in gray, and Contra Costa data is in blue, with both lines varying over time. Source: San Francisco MLS, InfoSparks © AllSource MLSs.

A combination bar and line graph titled 'East Bay Inventory - Condos Two Year, Monthly' displaying new listings, sold listings, and for-sale inventory for condos from May 2023 to May 2025. The y-axis on the left shows new and sold listings (0 to 600), and the y-axis on the right shows for-sale listings (0 to 1200). New listings are in dark blue bars, sold listings in light blue bars, and for-sale inventory in a pink line. Source: San Francisco MLS, InfoSparks © AllSource MLSs.

A combination bar and line graph titled 'East Bay Inventory - Single-Family Homes Two Year, Monthly' displaying new listings, sold listings, and for-sale inventory for single-family homes from May 2023 to May 2025. The y-axis on the left shows new and sold listings (0 to 3k), and the y-axis on the right shows for-sale listings (0 to 3.5k). New listings are in dark blue bars, sold listings in light blue bars, and for-sale inventory in a pink line. Source: San Francisco MLS, InfoSparks © AllSource MLSs.

A bar graph titled 'East Bay Median Condo Price Changes TTM, Year-Over-Year, Condos' showing percentage changes in median condo prices for Alameda and Contra Costa from June 2024 to May 2025. The y-axis represents price changes (-20.00% to 20.00%), and the x-axis shows months. Alameda data is in gray bars, and Contra Costa data is in blue bars, with fluctuations over time. Source: San Francisco MLS, InfoSparks © AllSource MLSs.

A line graph titled 'East Bay Median Condo Prices Three-Year, Monthly, Condos' showing median condo prices in Alameda and Contra Costa from May 2022 to May 2025. The y-axis represents median prices ($2M to $8M), and the x-axis shows months. Alameda data is in gray, and Contra Costa data is in blue, with both lines showing price trends over time. Source: San Francisco MLS, InfoSparks © AllSource MLSs.

A bar graph titled 'East Bay Median Single-Family Home Price Changes TTM, Year-Over-Year, Single Family Homes' showing percentage changes in median single-family home prices for Alameda and Contra Costa from June 2024 to May 2025. The y-axis represents price changes (-8.00% to 8.00%), and the x-axis shows months. Alameda data is in gray bars, and Contra Costa data is in blue bars, with variations over time. Source: San Francisco MLS, InfoSparks © AllSource MLSs.

A line graph titled 'East Bay Median Single-Family Home Prices Three-Year, Monthly, Single Family Homes' showing median single-family home prices in Alameda and Contra Costa from May 2022 to May 2025. The y-axis represents median prices ($0.5M to $2M), and the x-axis shows months. Alameda data is in gray, and Contra Costa data is in blue, with both lines depicting price trends over time. Source: San Francisco MLS, InfoSparks © AllSource MLSs.

A line graph titled 'East Bay Months of Supply Inventory TTM, Monthly, Condos' showing the months of supply inventory for condos in Alameda and Contra Costa from May 2023 to May 2025. The y-axis represents months of supply (0 to 6), and the x-axis shows months. Alameda data is in gray, and Contra Costa data is in blue, with both lines fluctuating over time. Source: San Francisco MLS, InfoSparks © AllSource MLSs.

A line graph titled 'East Bay Months of Supply Inventory TTM, Monthly, Single Family Homes' showing the months of supply inventory for single-family homes in Alameda and Contra Costa from May 2023 to May 2025. The y-axis represents months of supply (0 to 3), and the x-axis shows months. Alameda data is in gray, and Contra Costa data is in blue, with both lines varying over time. Source: San Francisco MLS, InfoSparks © AllSource MLSs.

Let’s Talk

You’ve got questions and we can’t wait to answer them.

Follow Us on Instagram