The Local Lowdown
Quick Take:
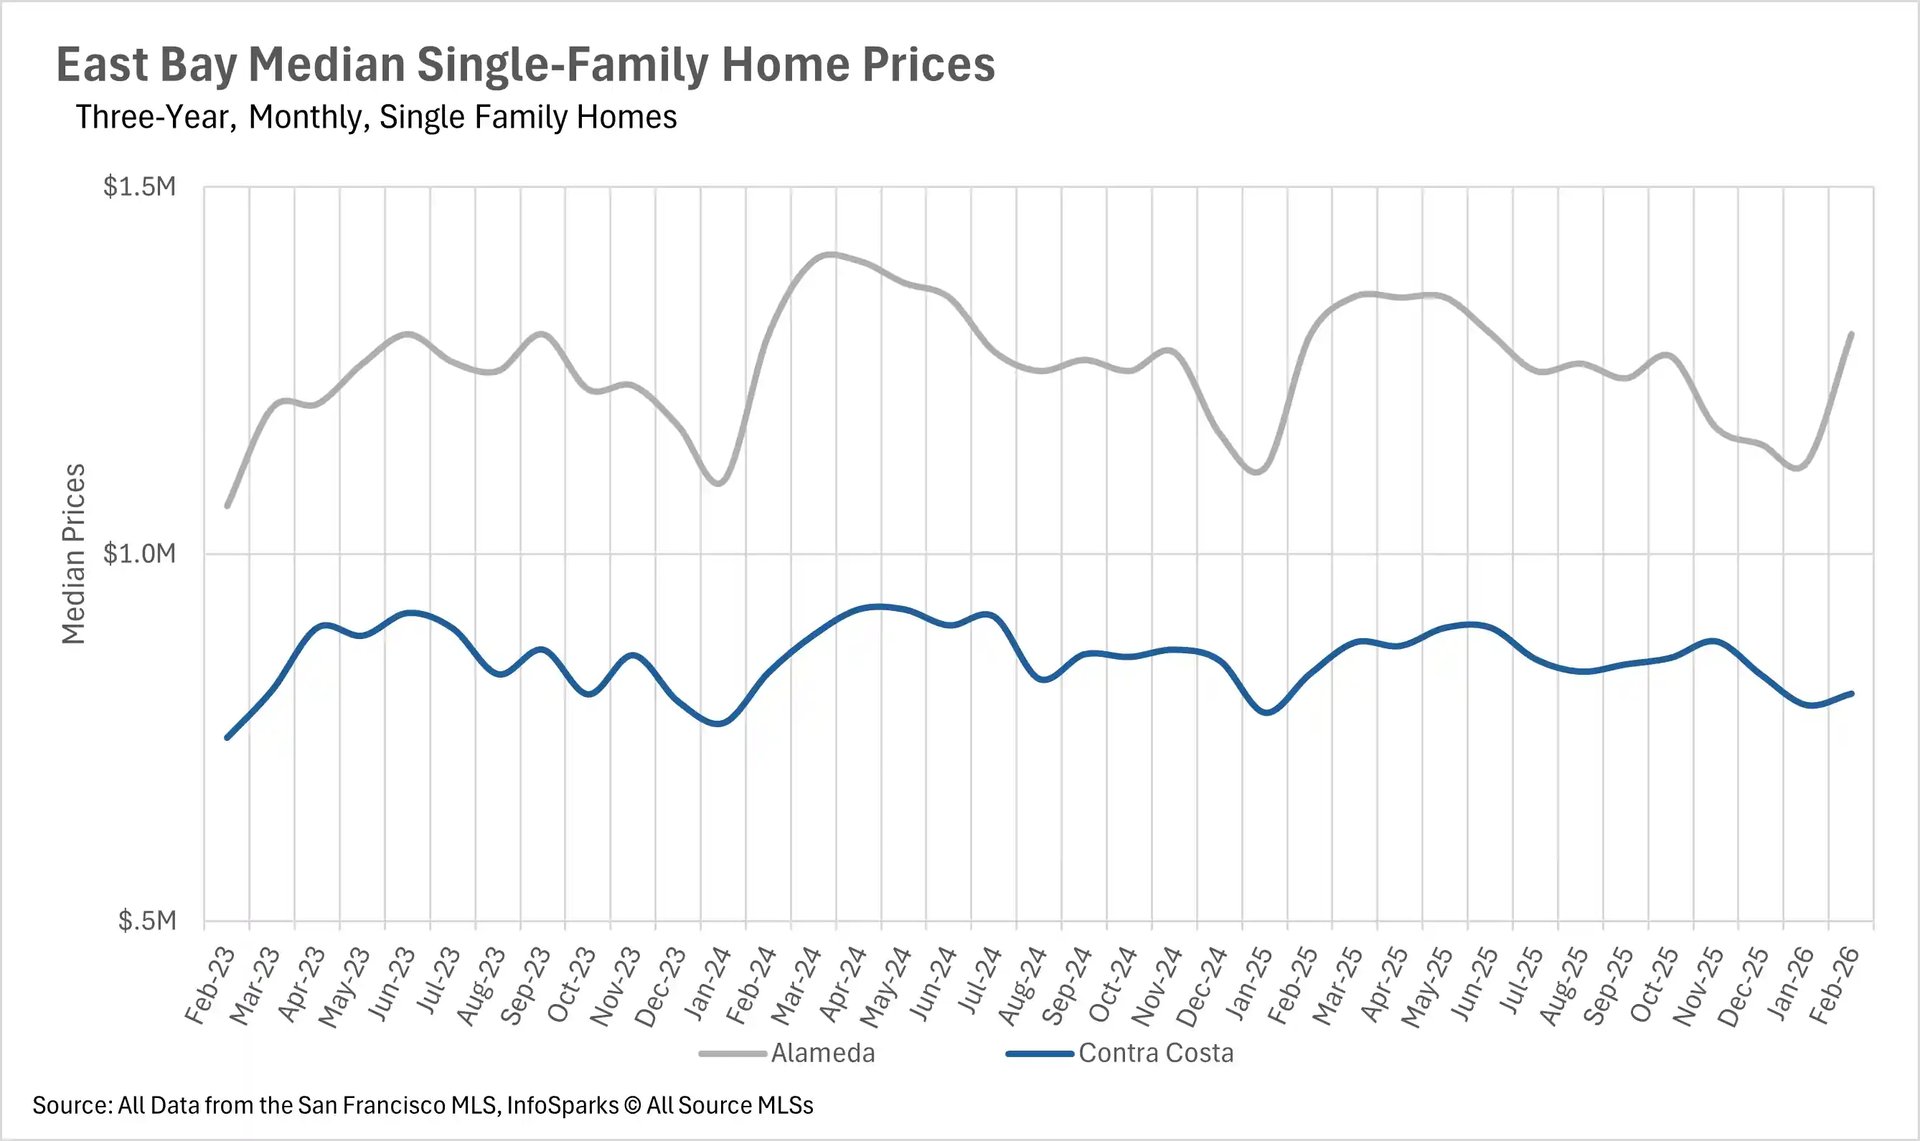
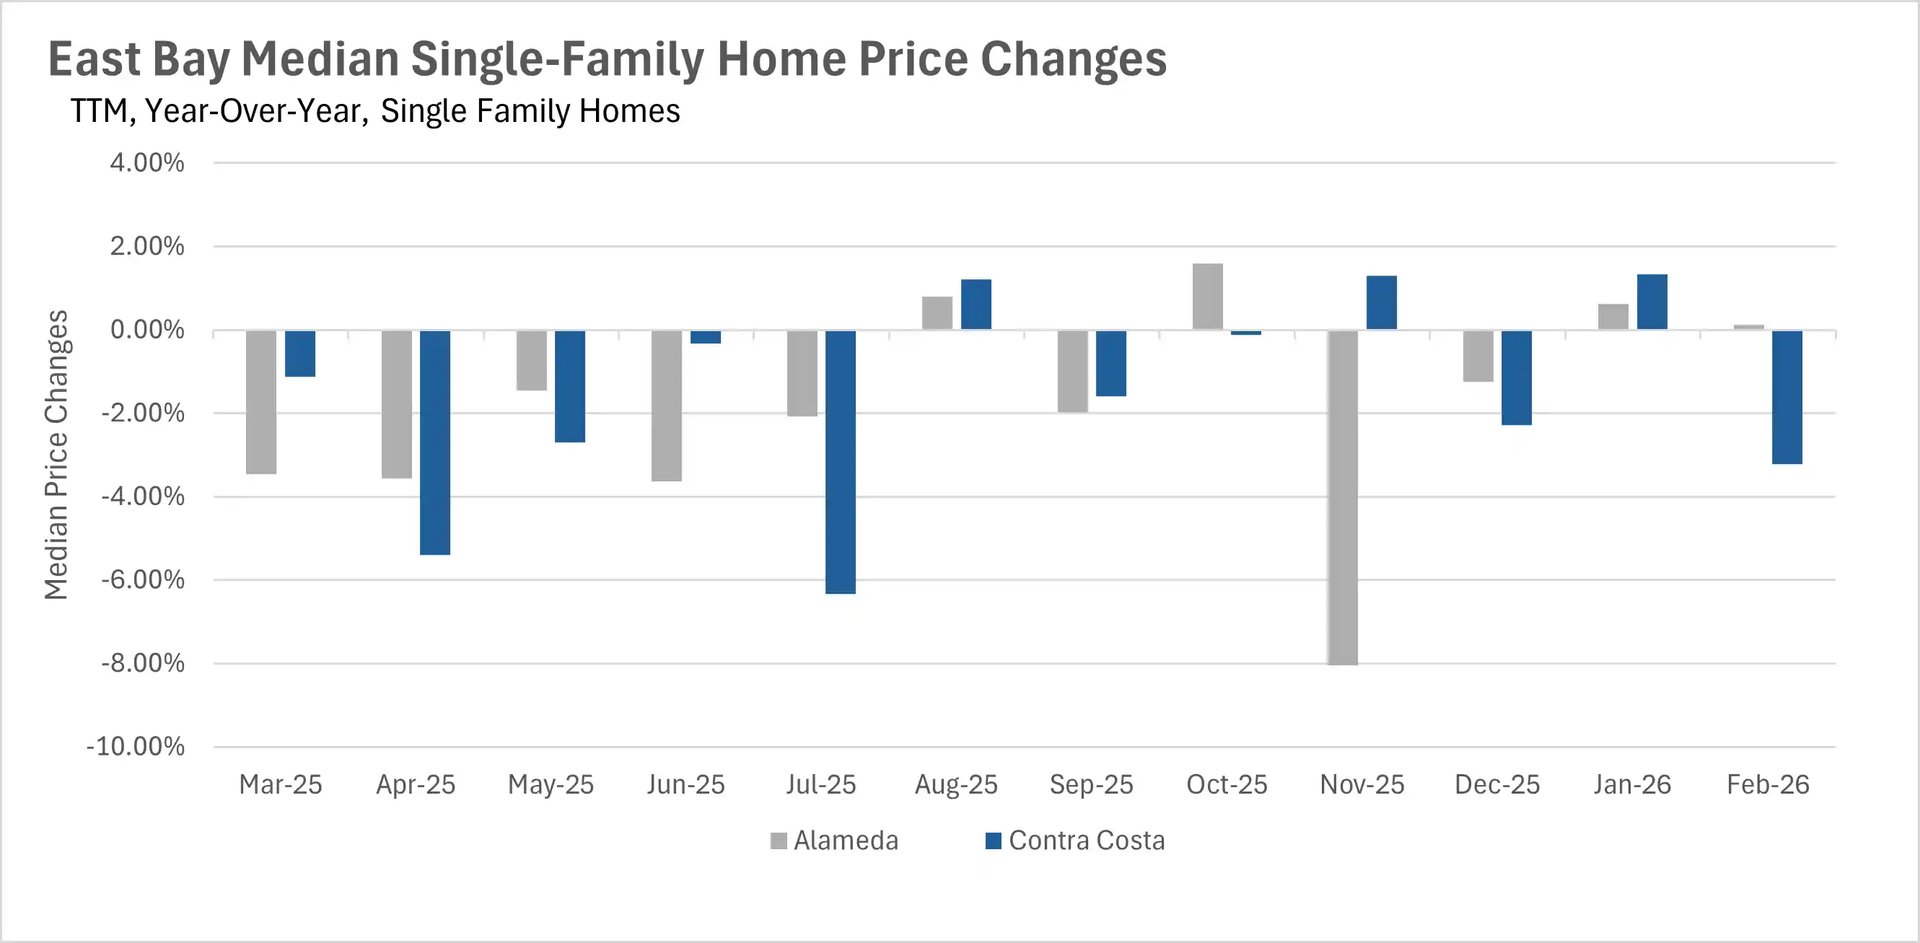
- Single-family home prices in Alameda County bounced back to $1.3 million, while
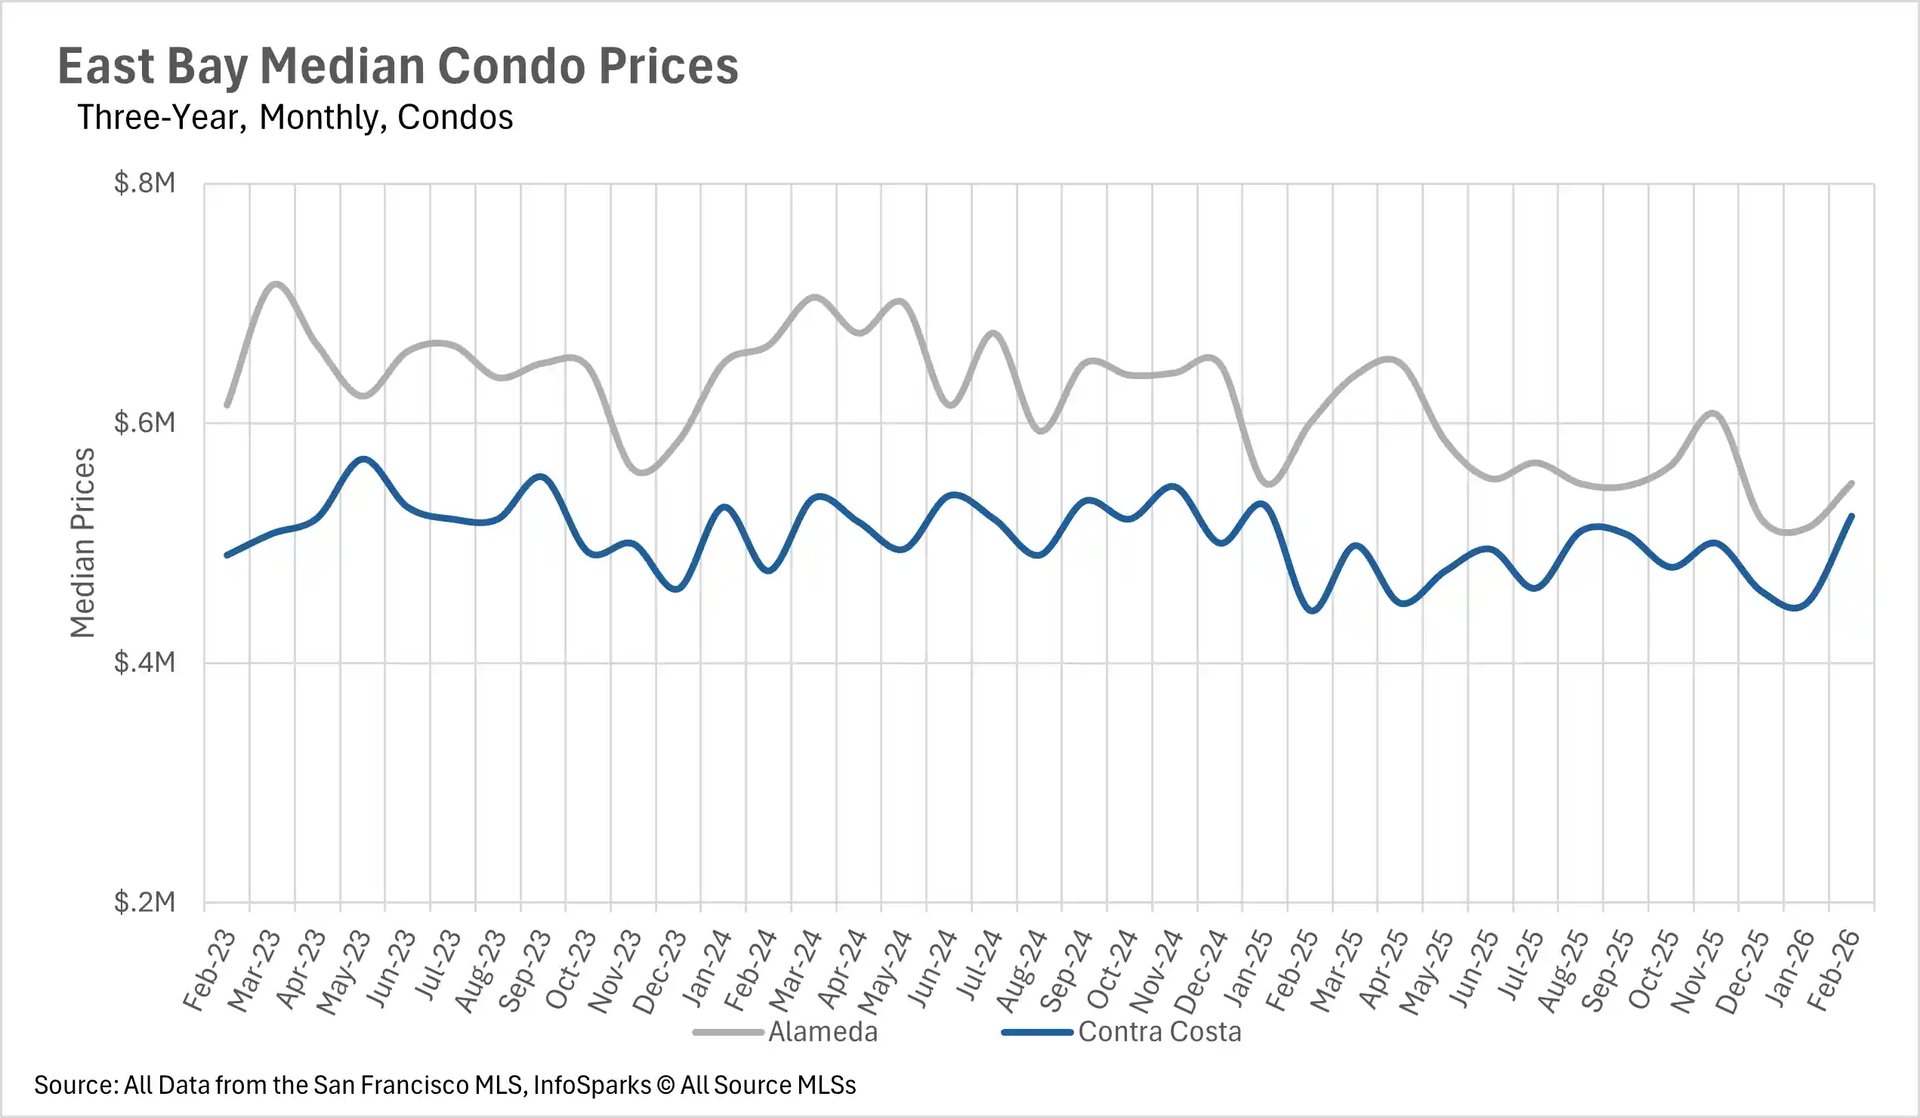
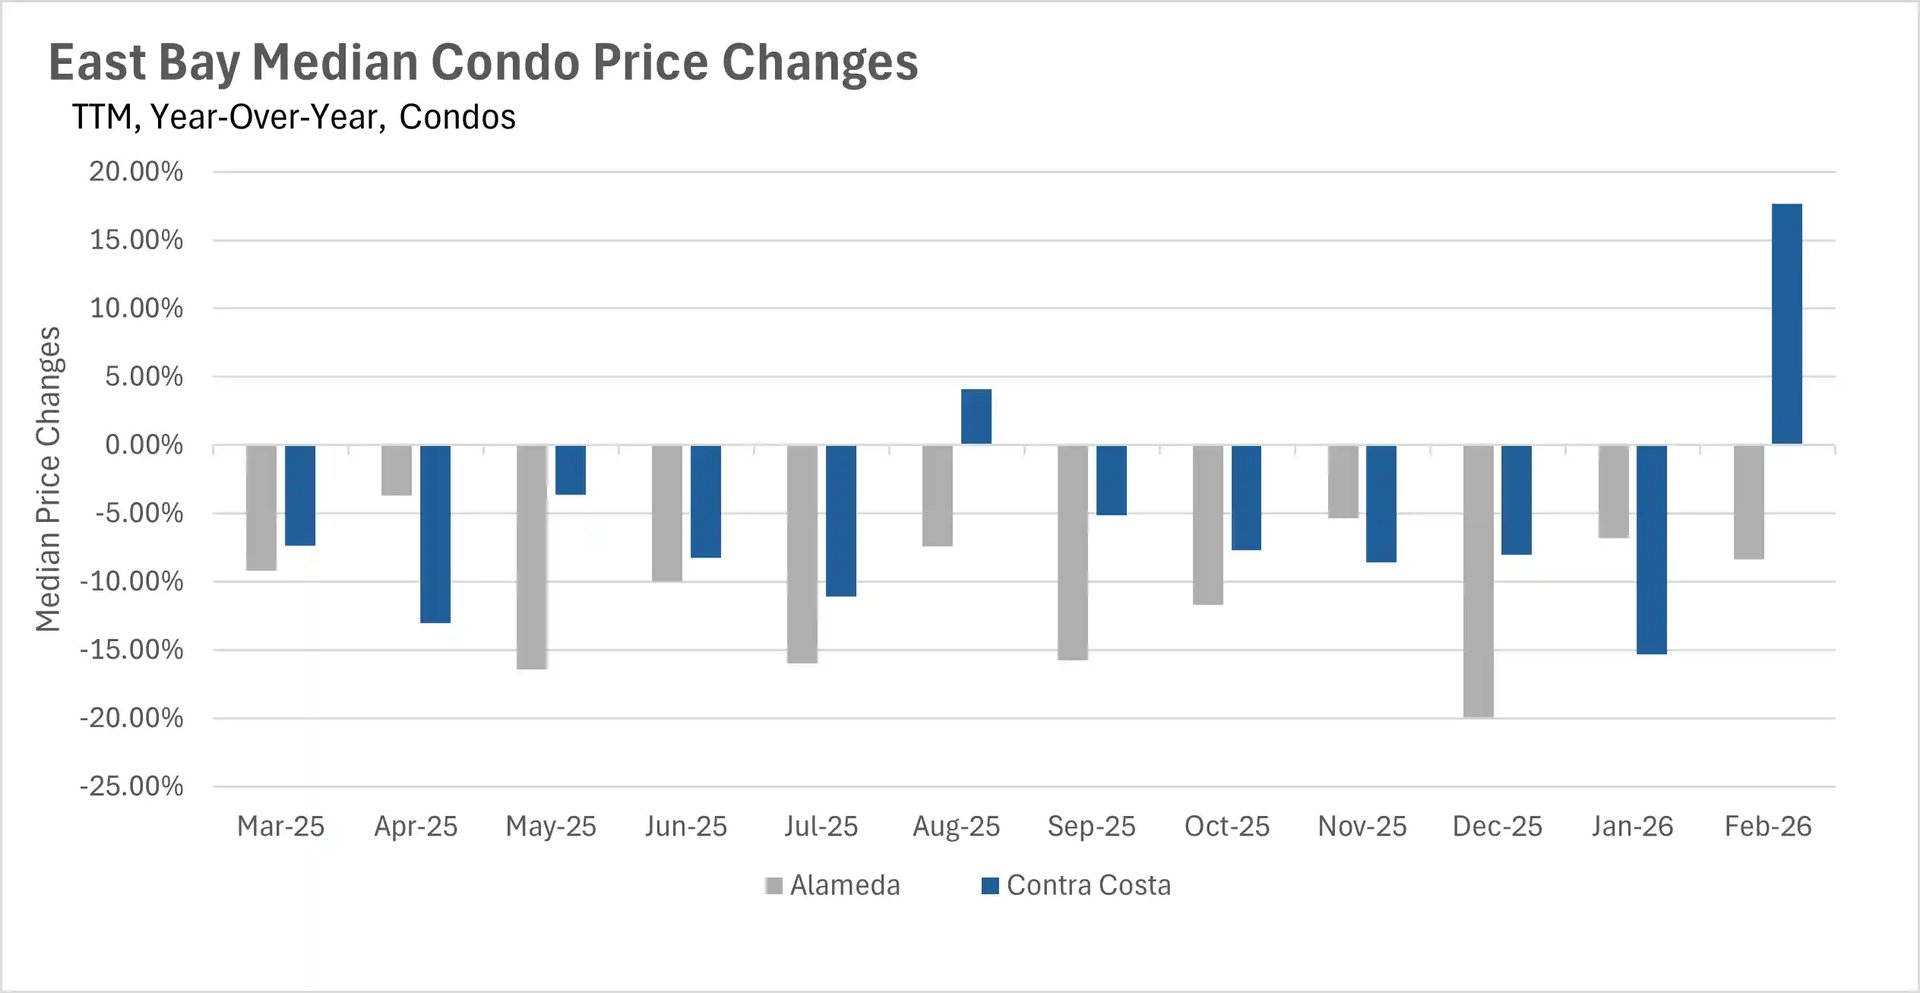
- condo prices remain mixed with a notable rebound in Contra Costa County.
- Inventories remain more than 20% below last year's levels for single-family homes, keeping the market tight heading into spring.
- Listings are moving quickly across the board, with single-family homes selling in under two weeks in both counties.
Note: You can find the charts/graphs for the Local Lowdown at the end of this section.
Single-family homes in Alameda County return to the $1.3 million mark
February brought some welcome news for Alameda County homeowners, as the median single-family home sale price climbed back to $1,300,000, essentially flat on a year-over-year basis at +0.12%. Contra Costa County saw a slight decline, with the median single-family home selling for $810,000, representing a 3.23% year-over-year decrease. The condo market presented an interesting split this month. Alameda County condos continued their downward trend, with the median condo selling for $550,000, an 8.33% decline compared to last year. However, Contra Costa County condos saw a significant rebound, with the median sale price jumping to $522,500, a 17.68% year-over-year increase. This volatility in the condo market is not unusual, as the smaller number of transactions can lead to larger swings in median prices from month to month.
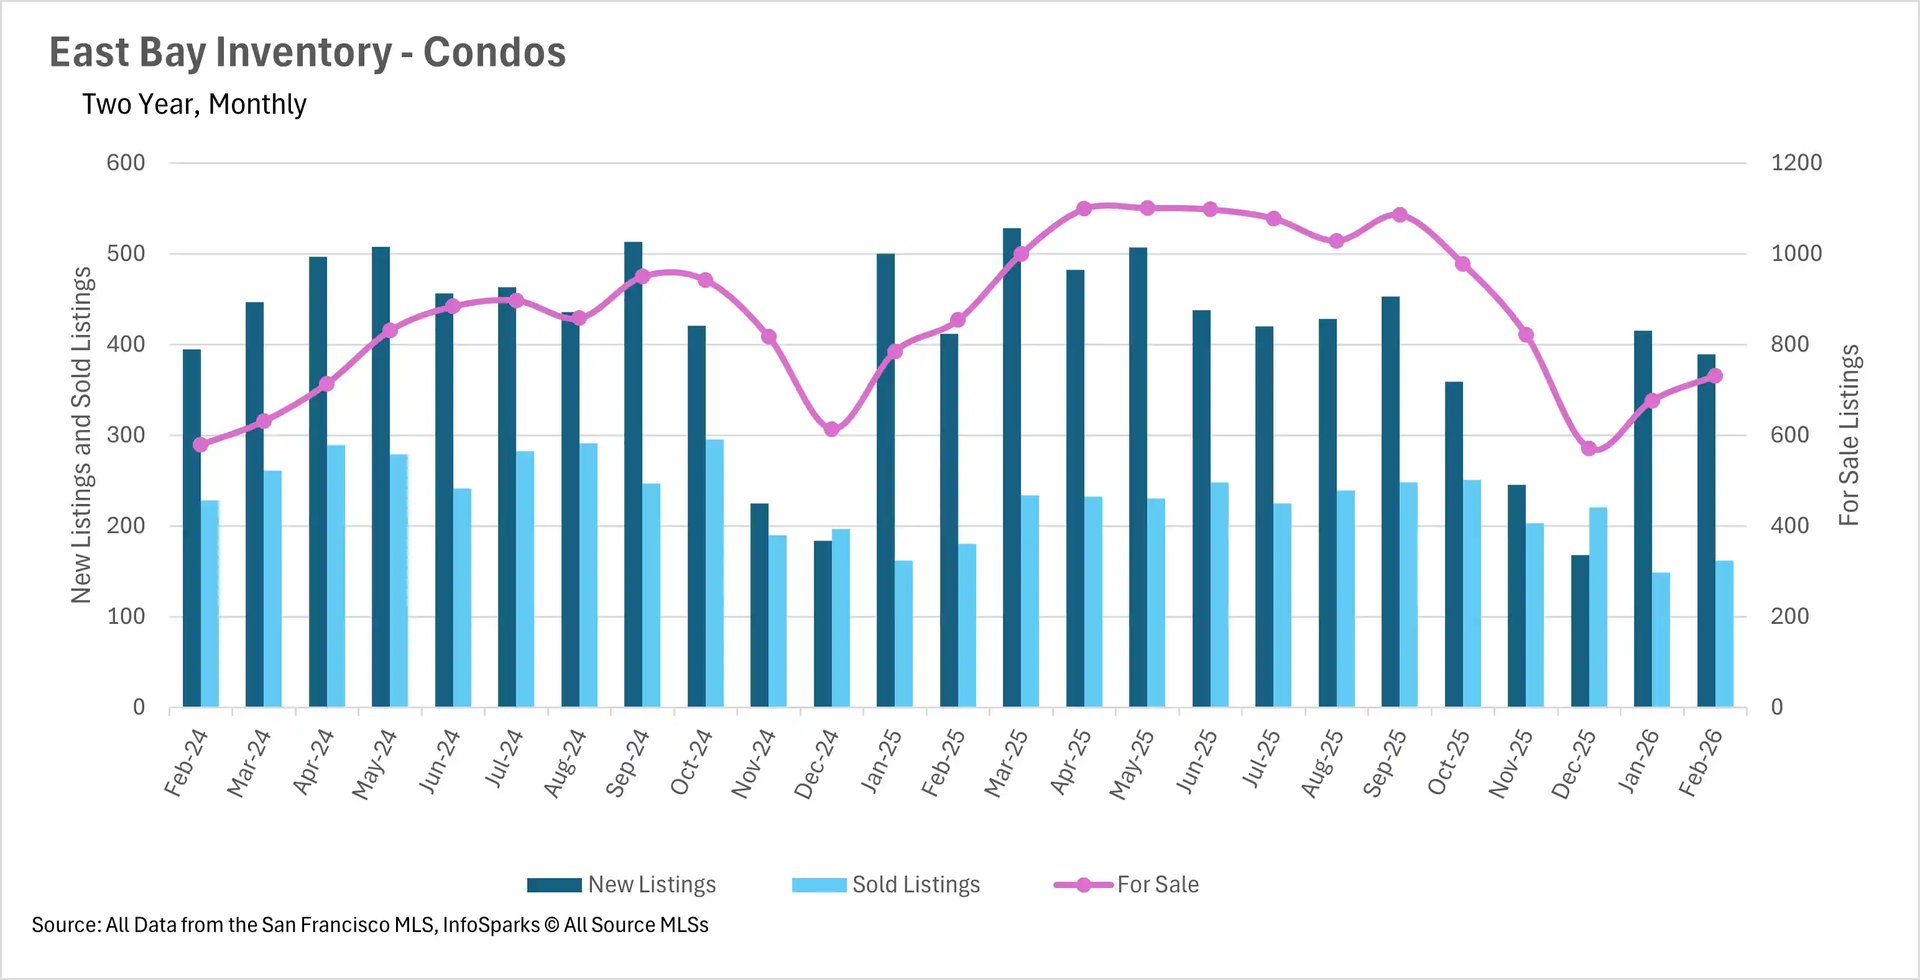
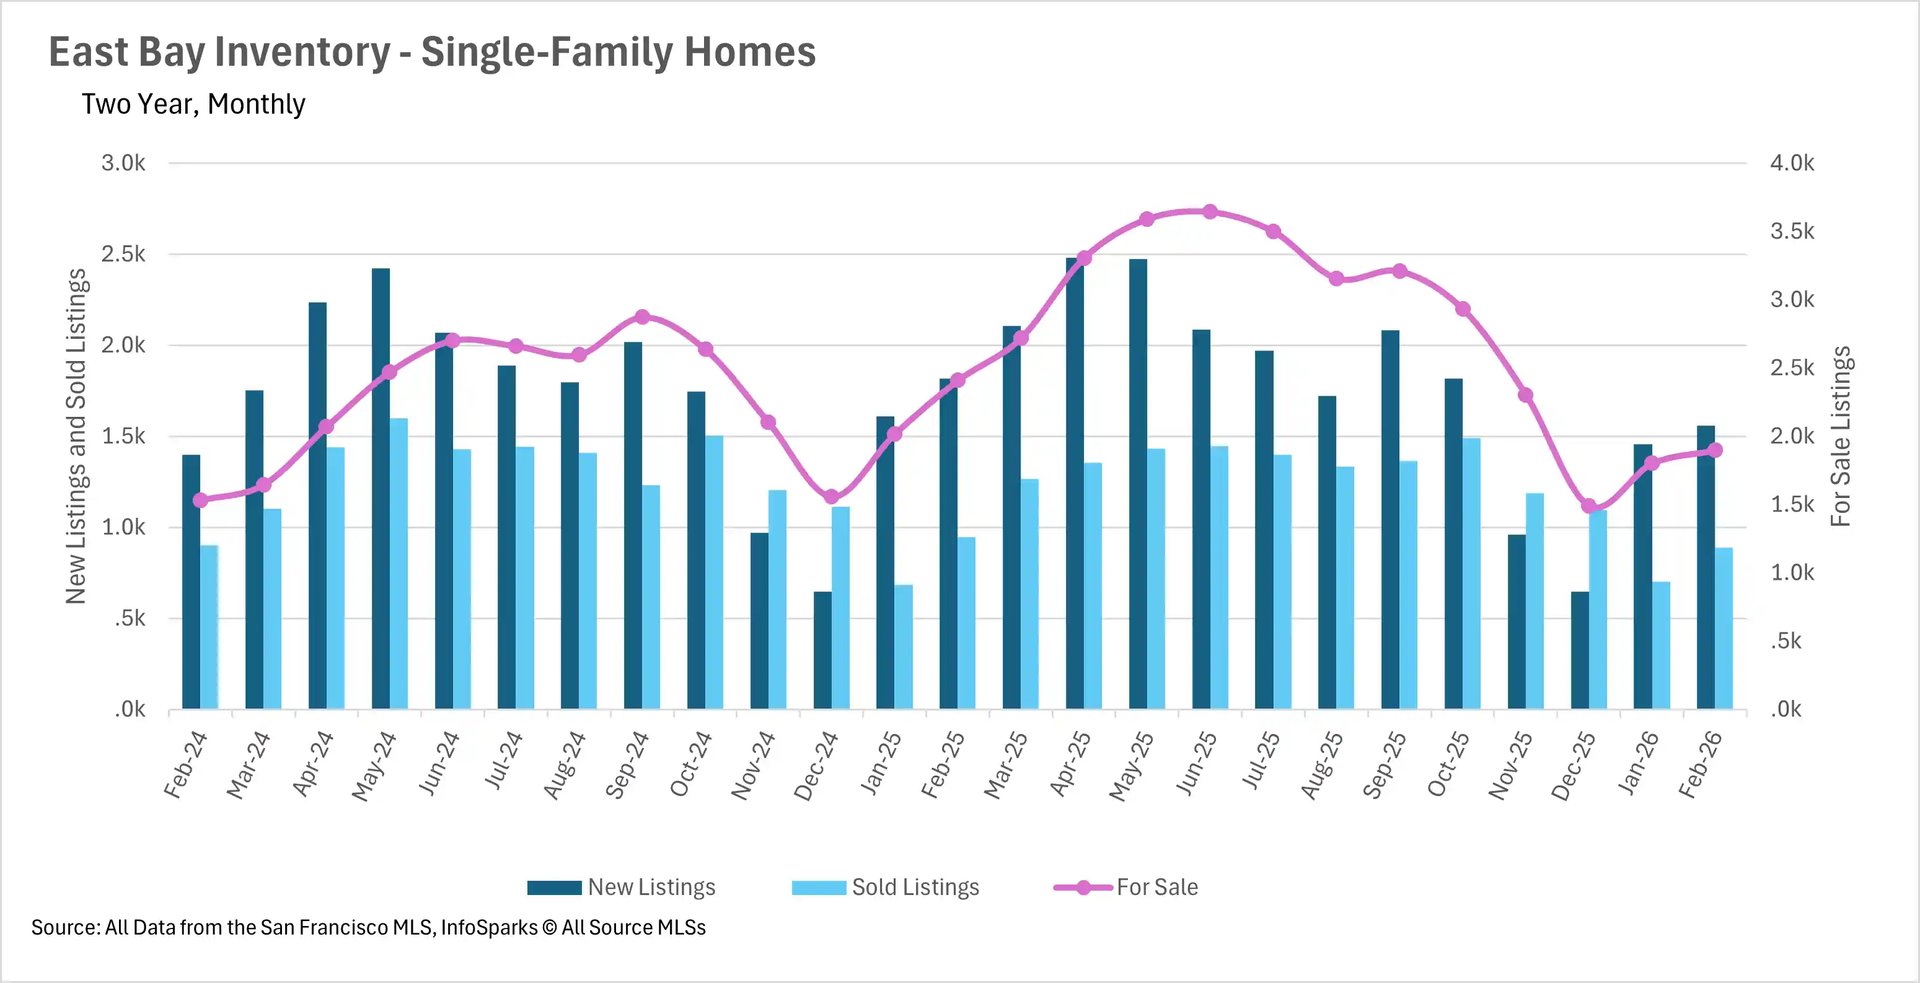
Inventory remains constrained as spring approaches
As we move into the spring selling season, inventory levels in the East Bay remain well below where they were a year ago. Single-family home inventory stood at just 1,898 units in February, representing a 21.24% decline on a year-over-year basis. The condo market saw a similar trend, with inventory down 14.40% to just 731 units. This persistent lack of inventory continues to be a defining feature of the East Bay market and is likely contributing to the relative stability in single-family home prices. As we move deeper into spring, we'll be watching closely to see whether new listings can keep pace with buyer demand.
Homes are flying off the shelves as the spring market heats up
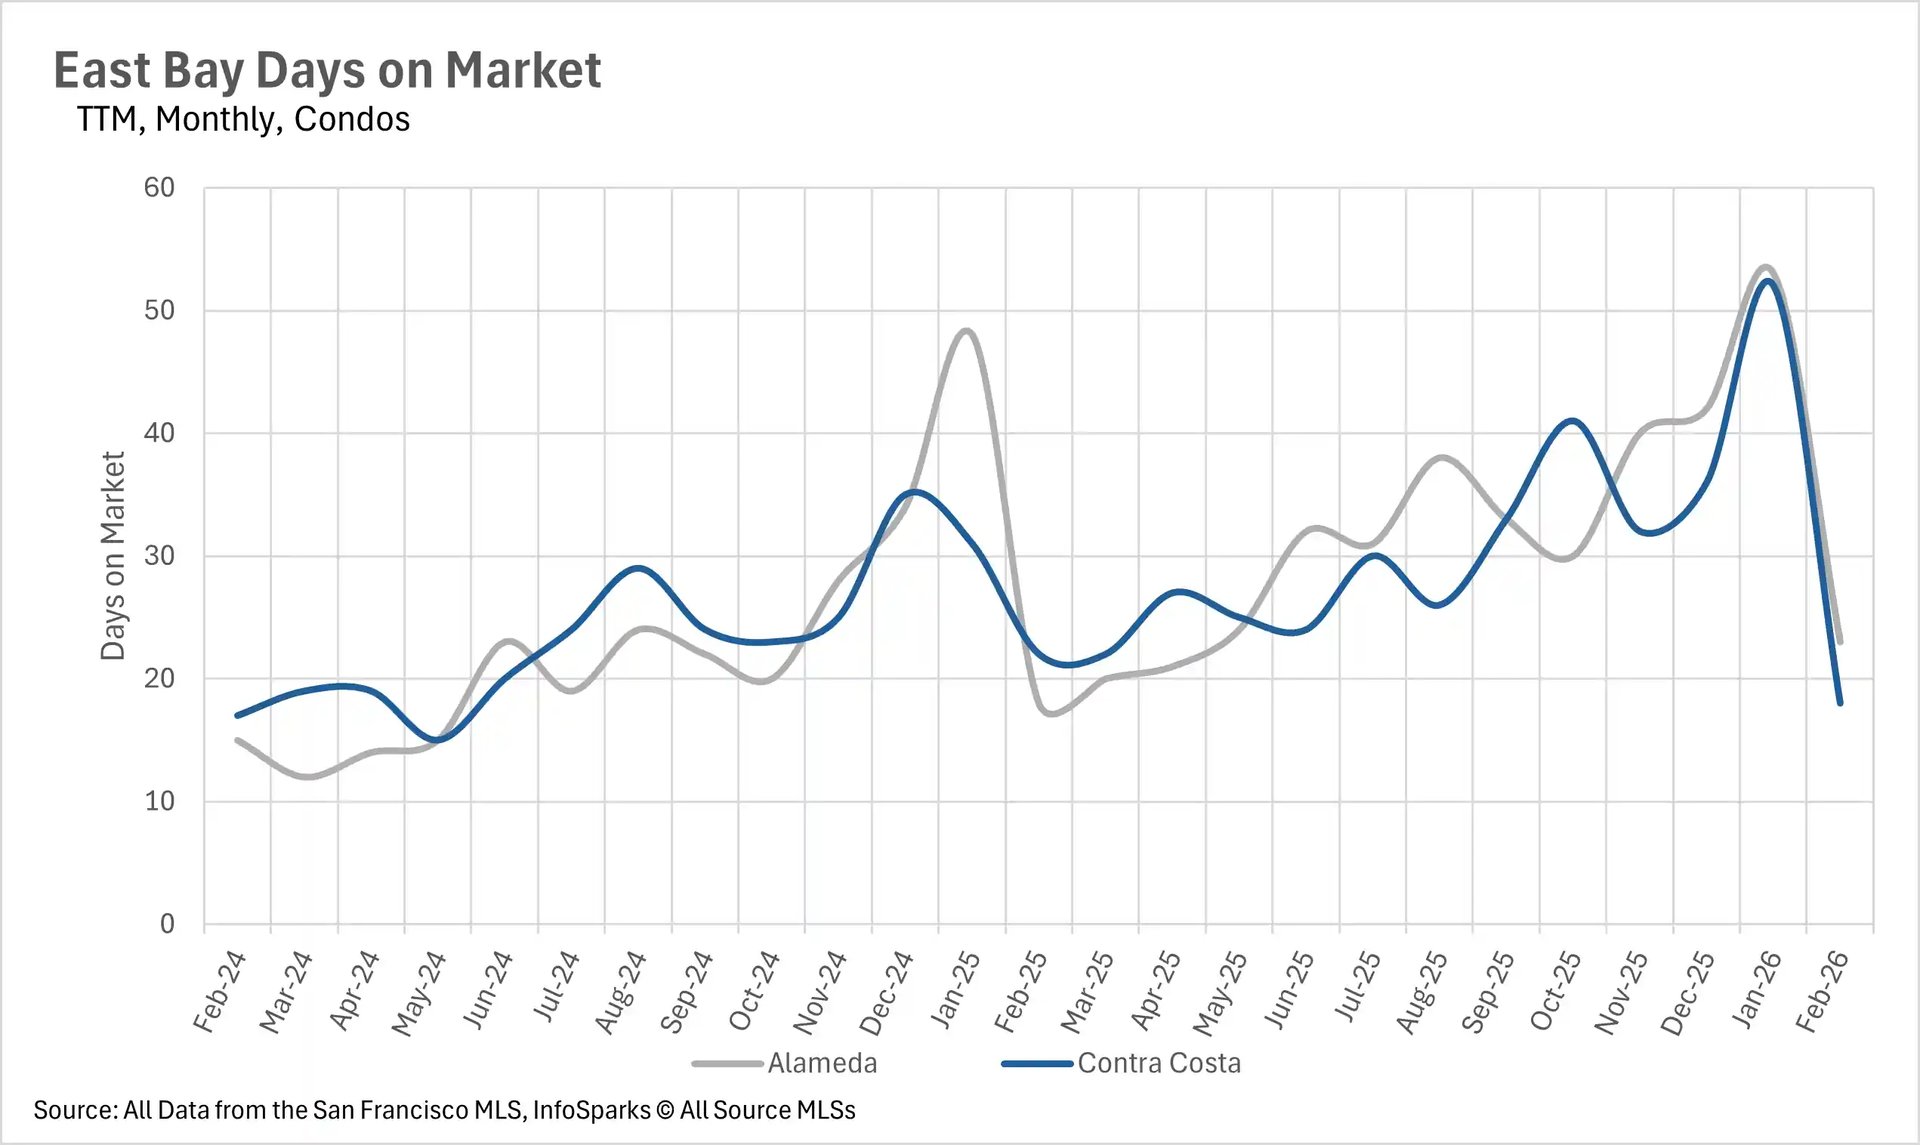
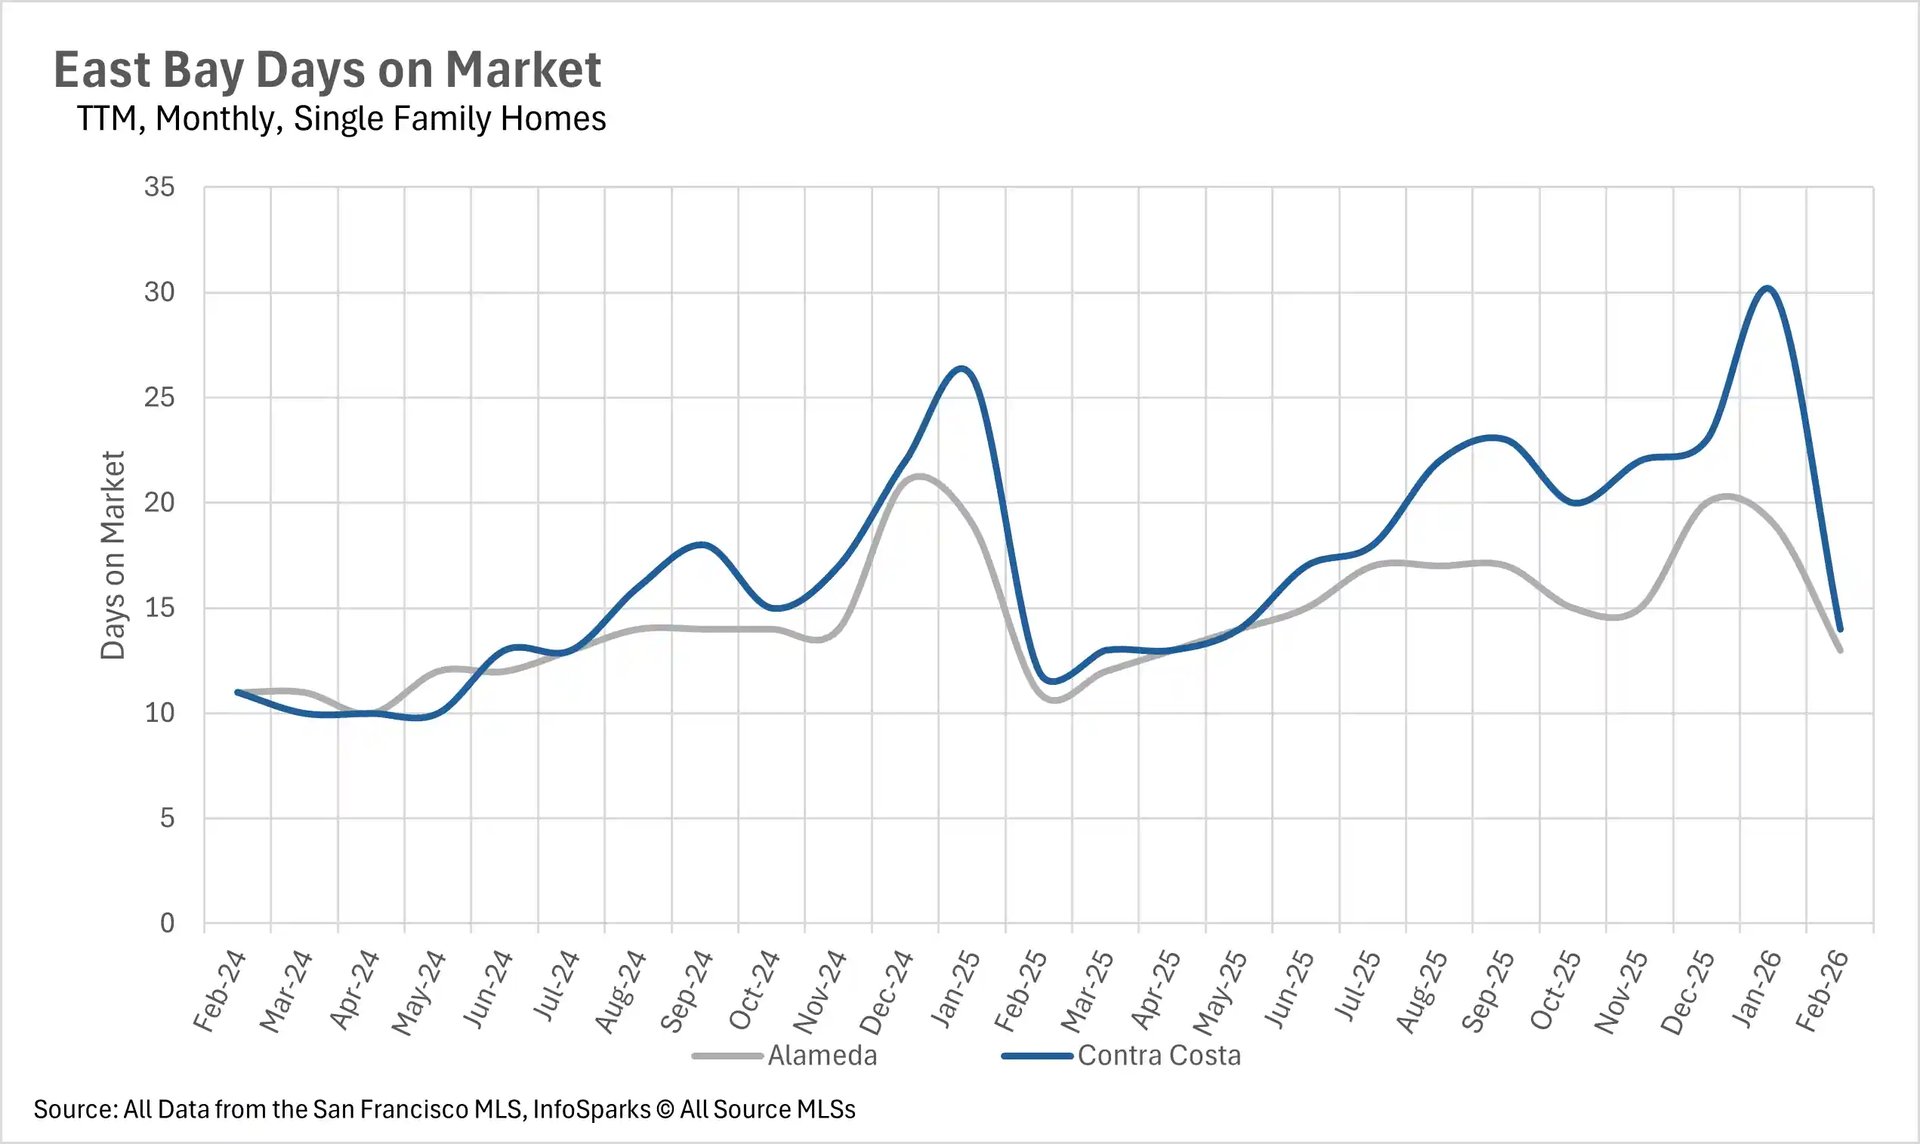
The pace of sales picked up considerably in February, with single-family homes selling remarkably quickly across both counties. The average single-family home in Alameda County sold in just 13 days, while homes in Contra Costa County sold in just 14 days. While these figures represent year-over-year increases of 18.18% and 16.67% respectively, listings are still moving at a very brisk pace by historical standards. The condo market also saw improved velocity, with the average condo in Alameda County selling in 23 days and Contra Costa County condos selling in just 18 days. This represents a sharp month-over-month improvement, as buyers appear to be taking advantage of the spring selling season.
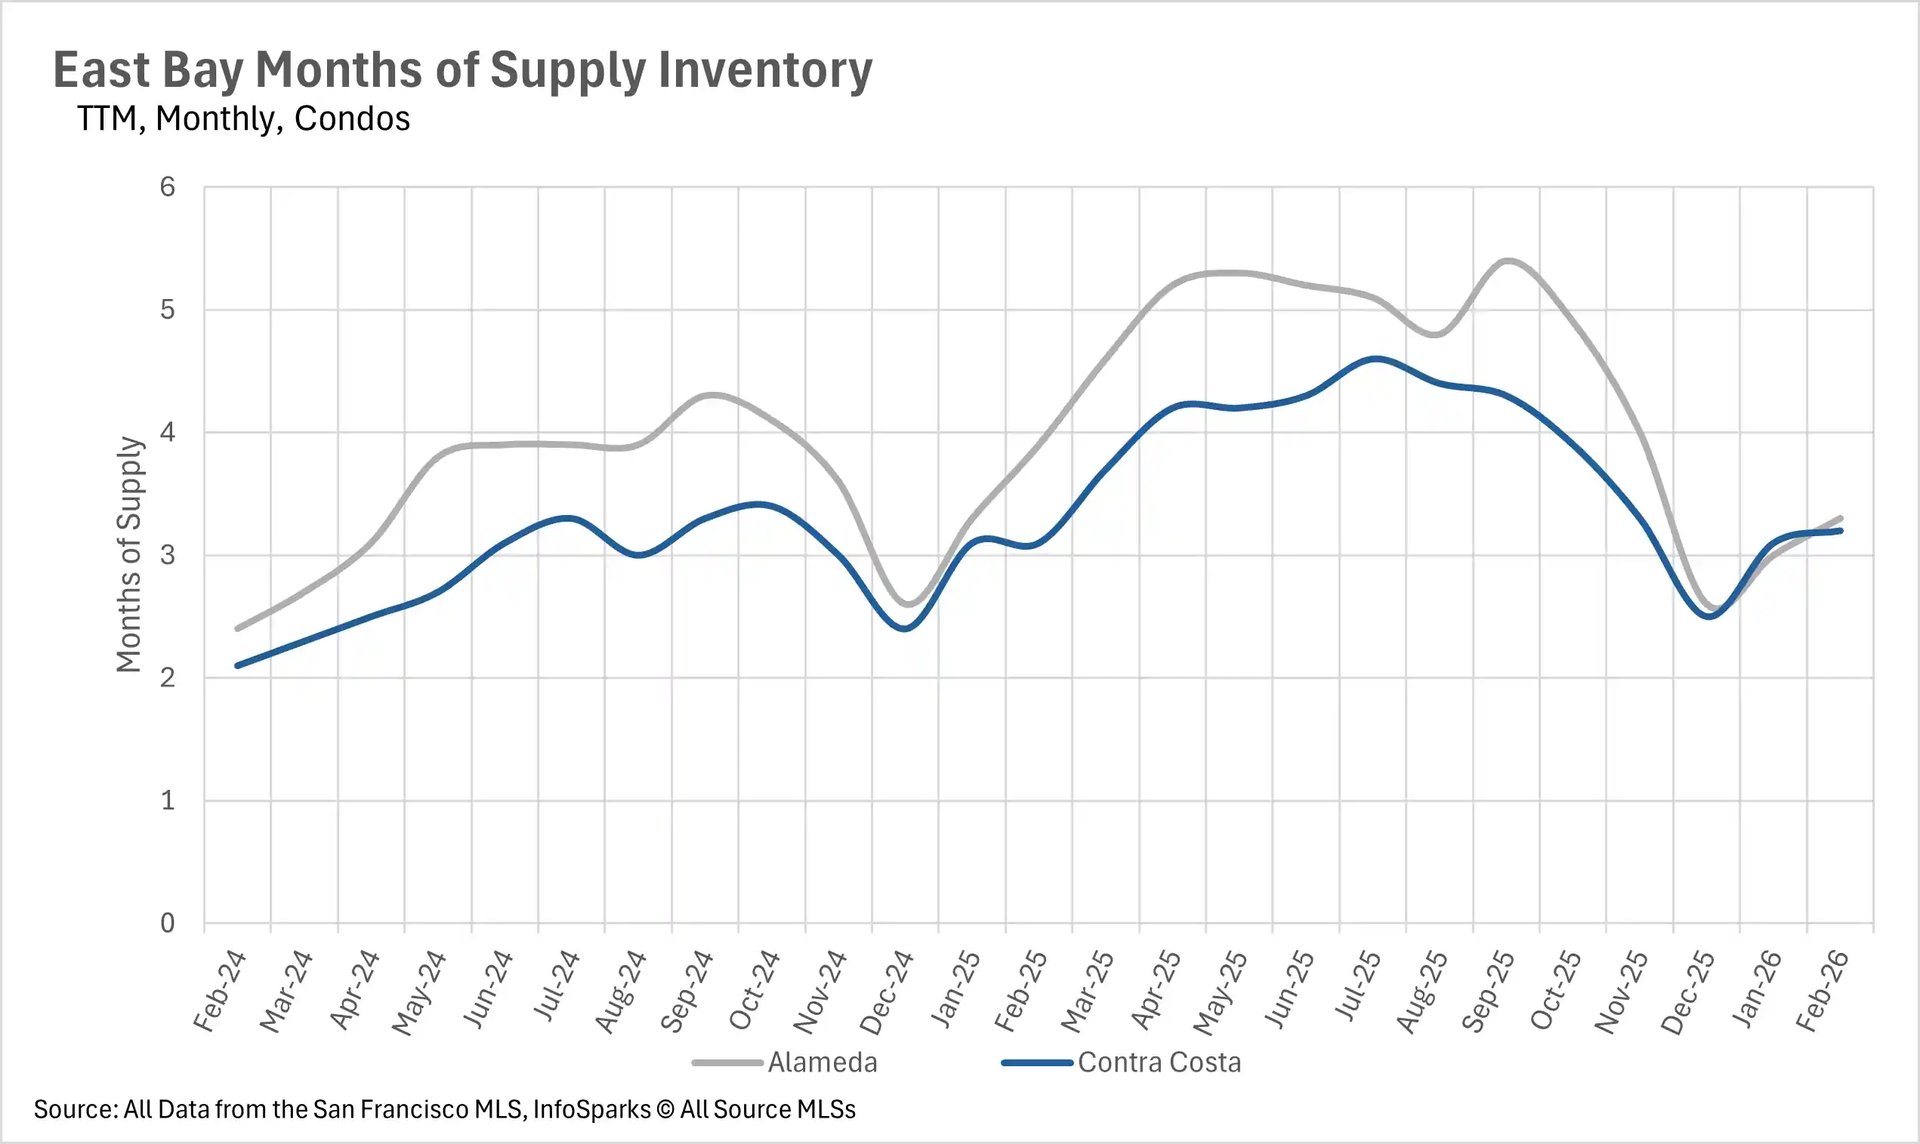
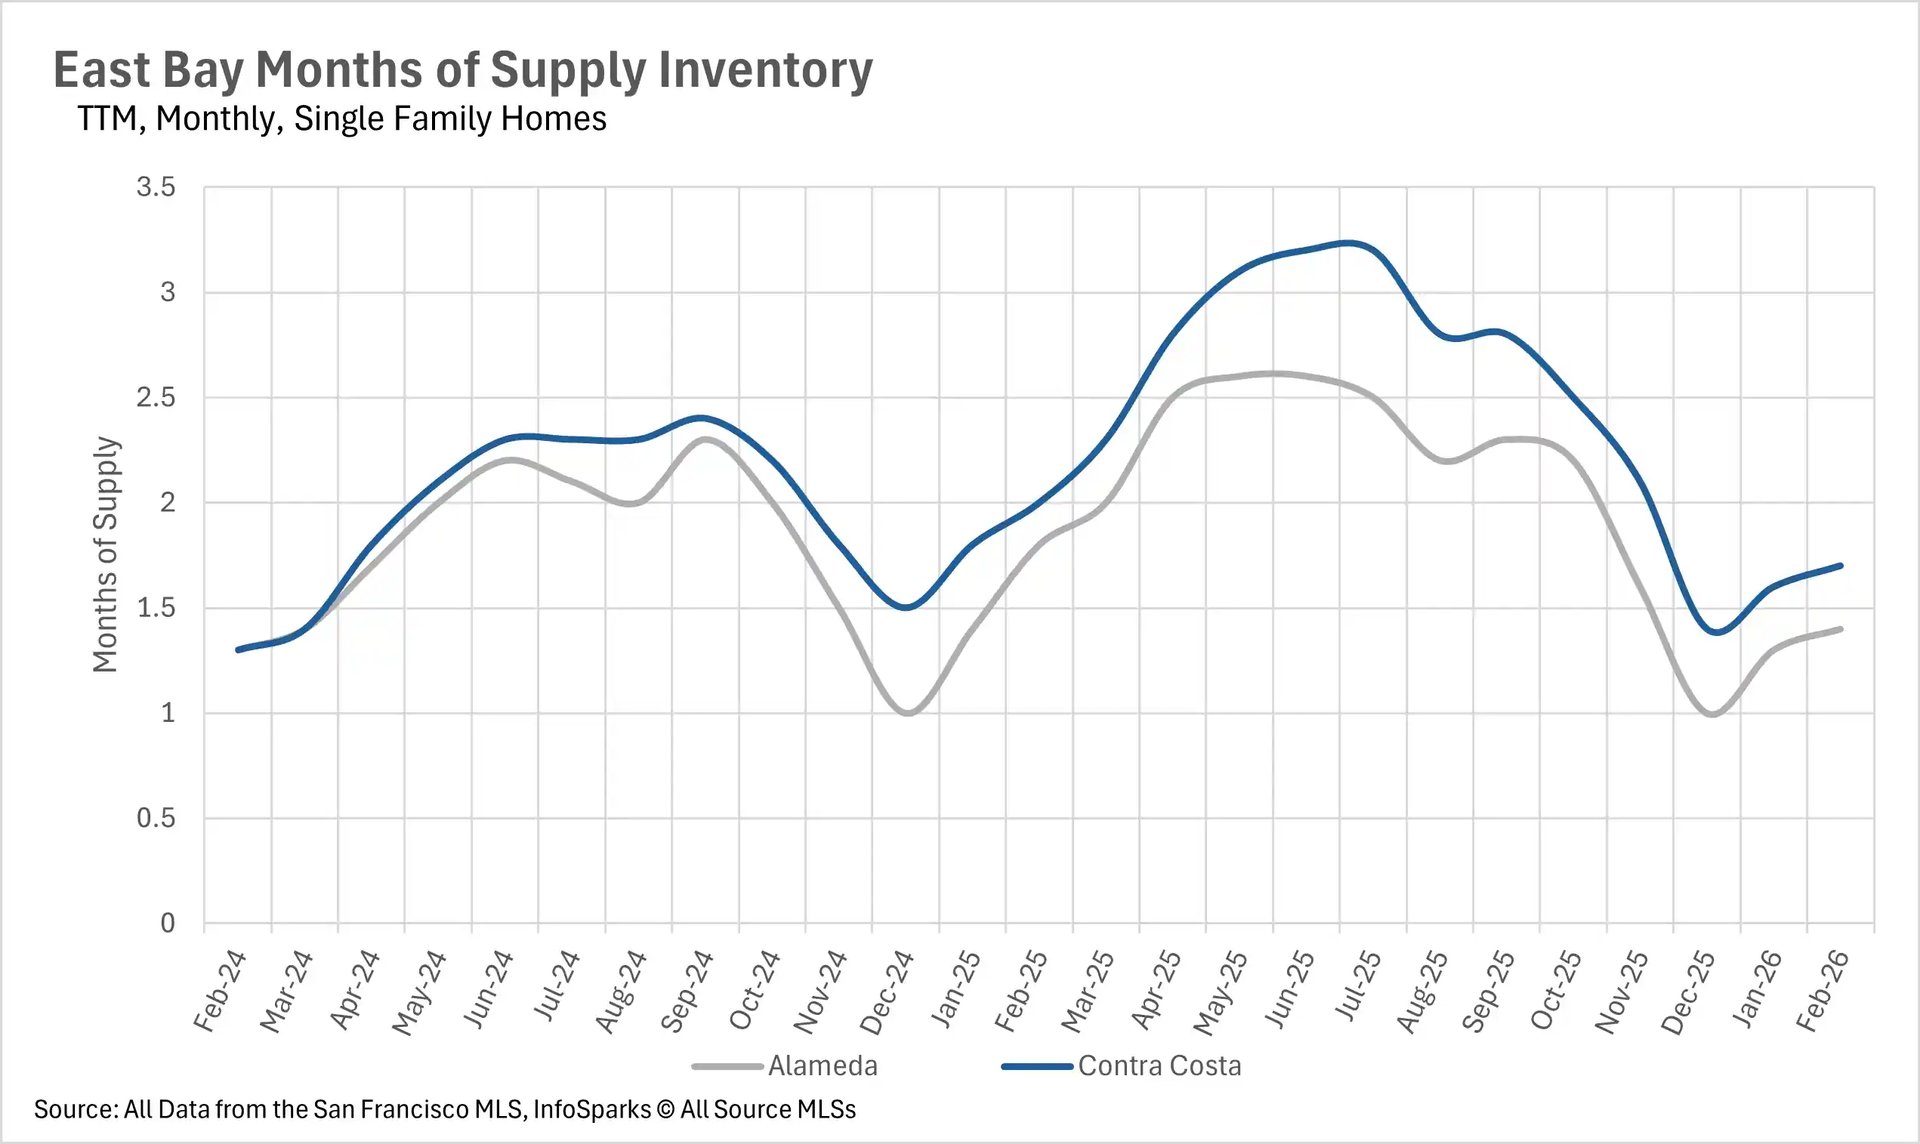
The single-family market remains firmly in seller's territory
When determining whether a market is a buyers' market or a sellers' market, we look to the Months of Supply Inventory (MSI) metric. The state of California has historically averaged around three months of MSI, so any area with at or around three months of MSI is considered a balanced market. Any market that has lower than three months of MSI is considered a seller's market, whereas markets with more than three months of MSI are considered buyers' markets.
The single-family home market remains a strong seller's market, with just 1.4 months of inventory in Alameda County and 1.7 months in Contra Costa County. These figures represent year-over-year declines of 22.22% and 15.00%, respectively, indicating that competition among buyers remains fierce. The condo market, on the other hand, has shifted into more balanced territory. Alameda County ended February with 3.3 months of condo inventory, while Contra Costa County had 3.2 months. This places the condo market right around the historical average for California, giving both buyers and sellers relatively equal footing in negotiations.