The Local Lowdown
Quick Take:
Prices are rising across the board, with the condo market posting its strongest year-over-year gains in years.
Inventory remains nearly 27% below last year for single-family homes, keeping competition fierce among buyers.
Single-family homes are selling significantly faster than last year, with listings moving in under two weeks.
Note: You can find the charts/graphs for the Local Lowdown at the end of this section.
The condo market roars back to life
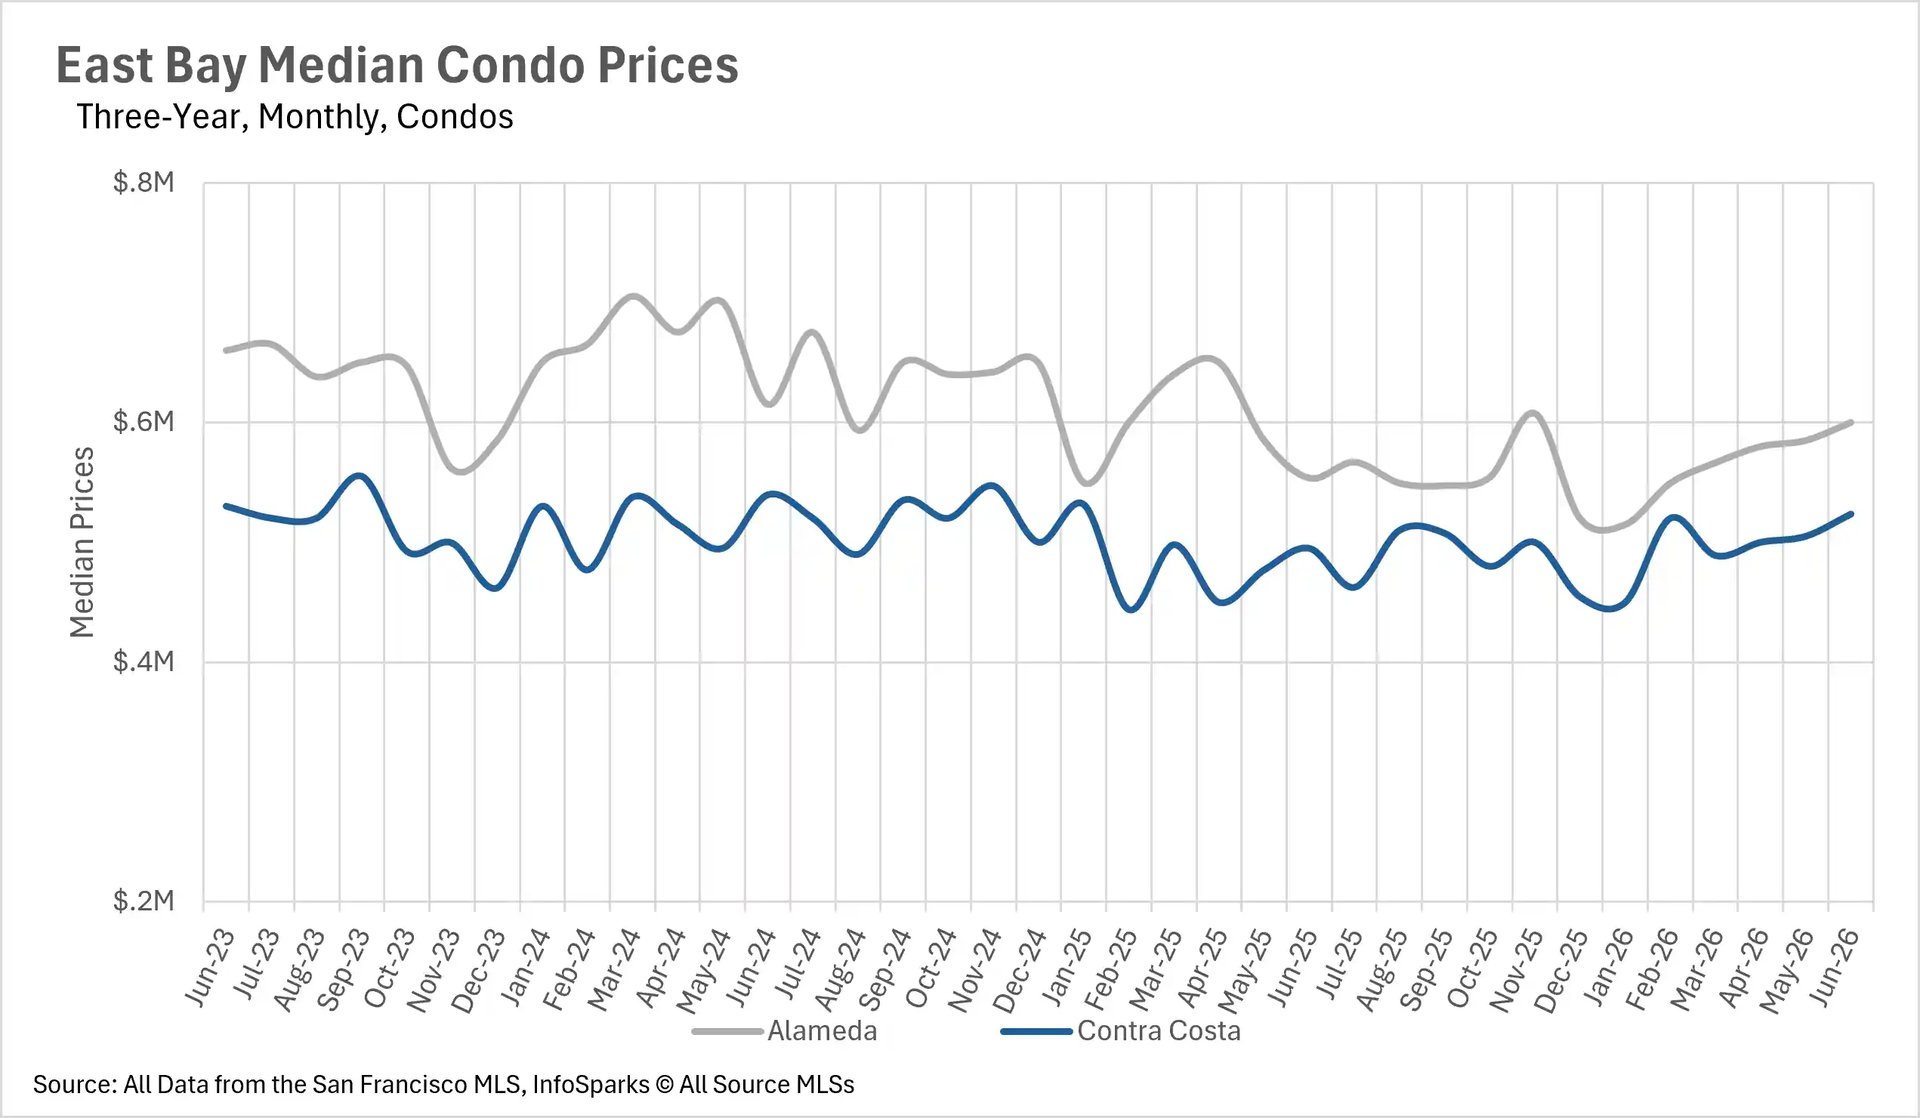
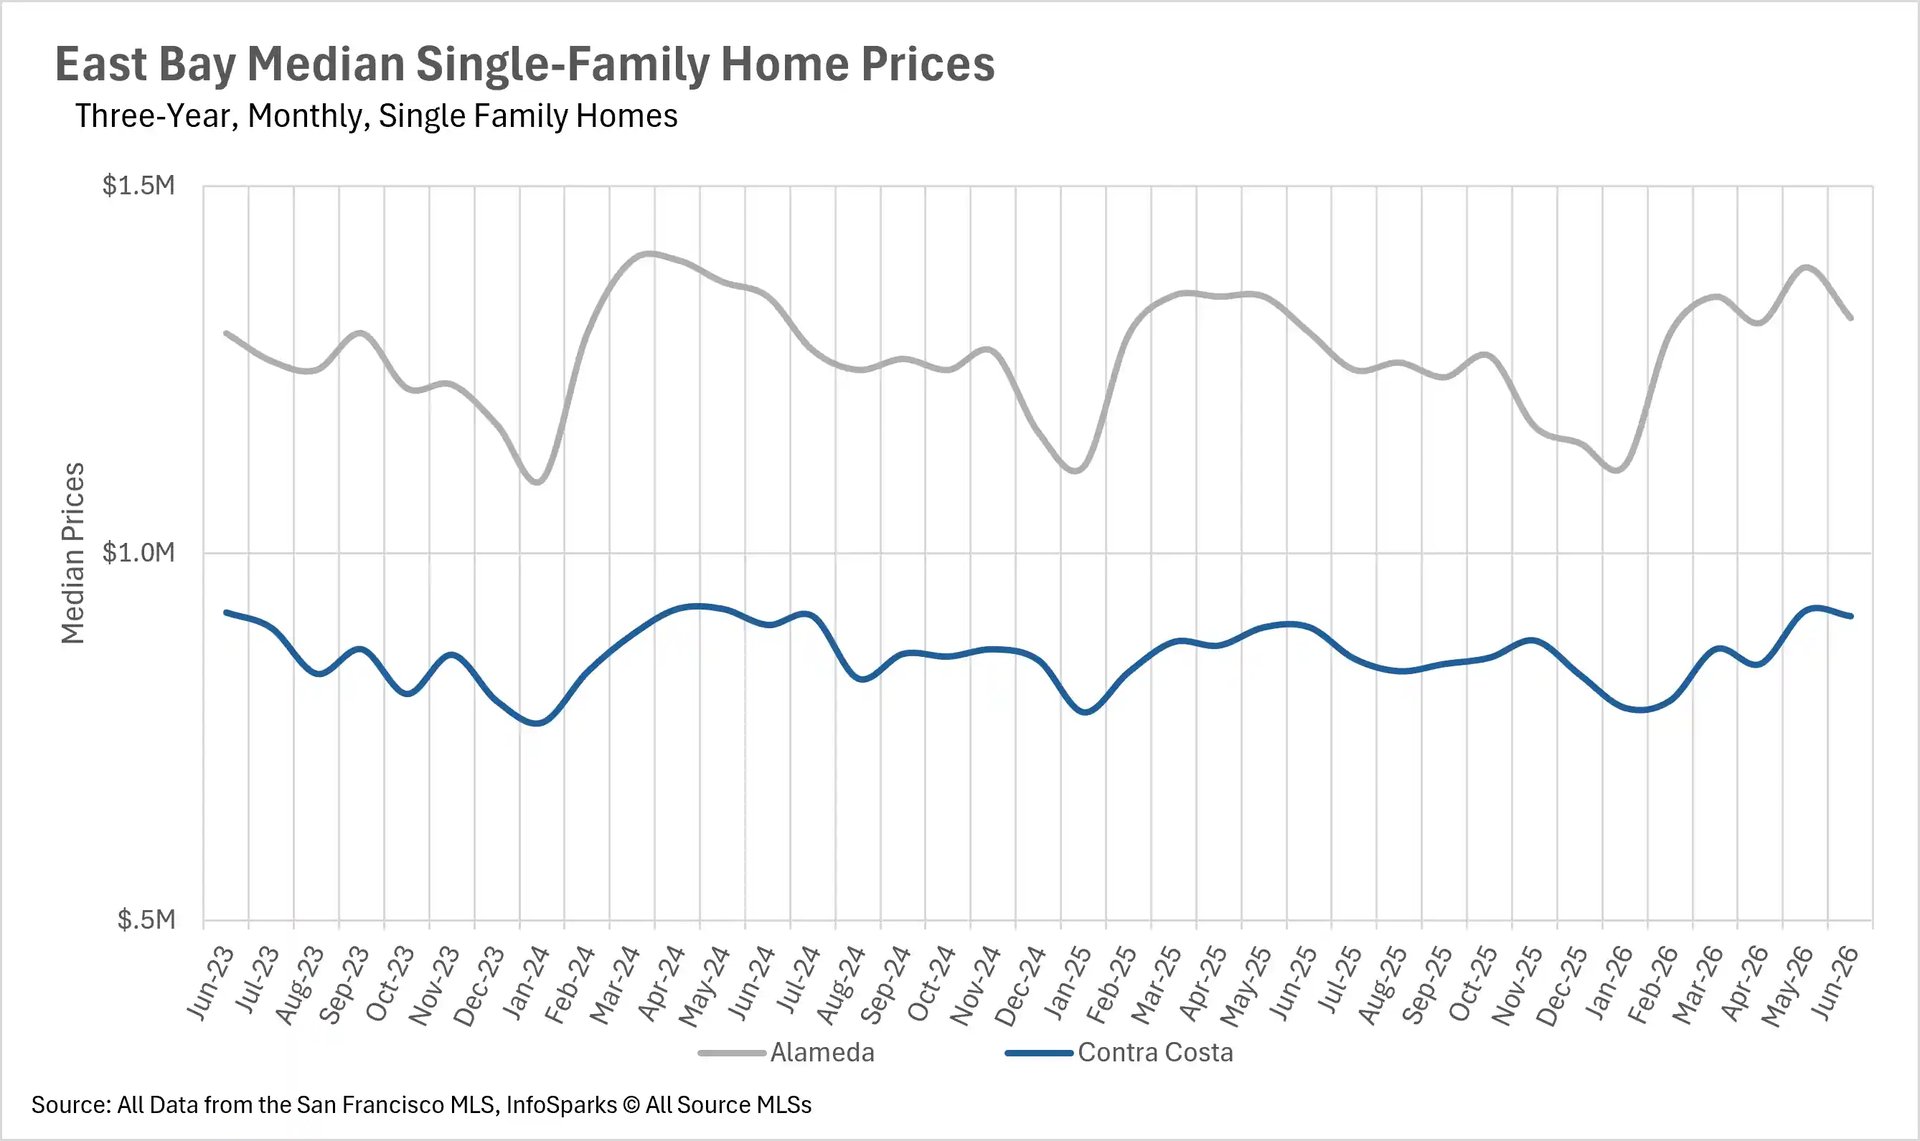
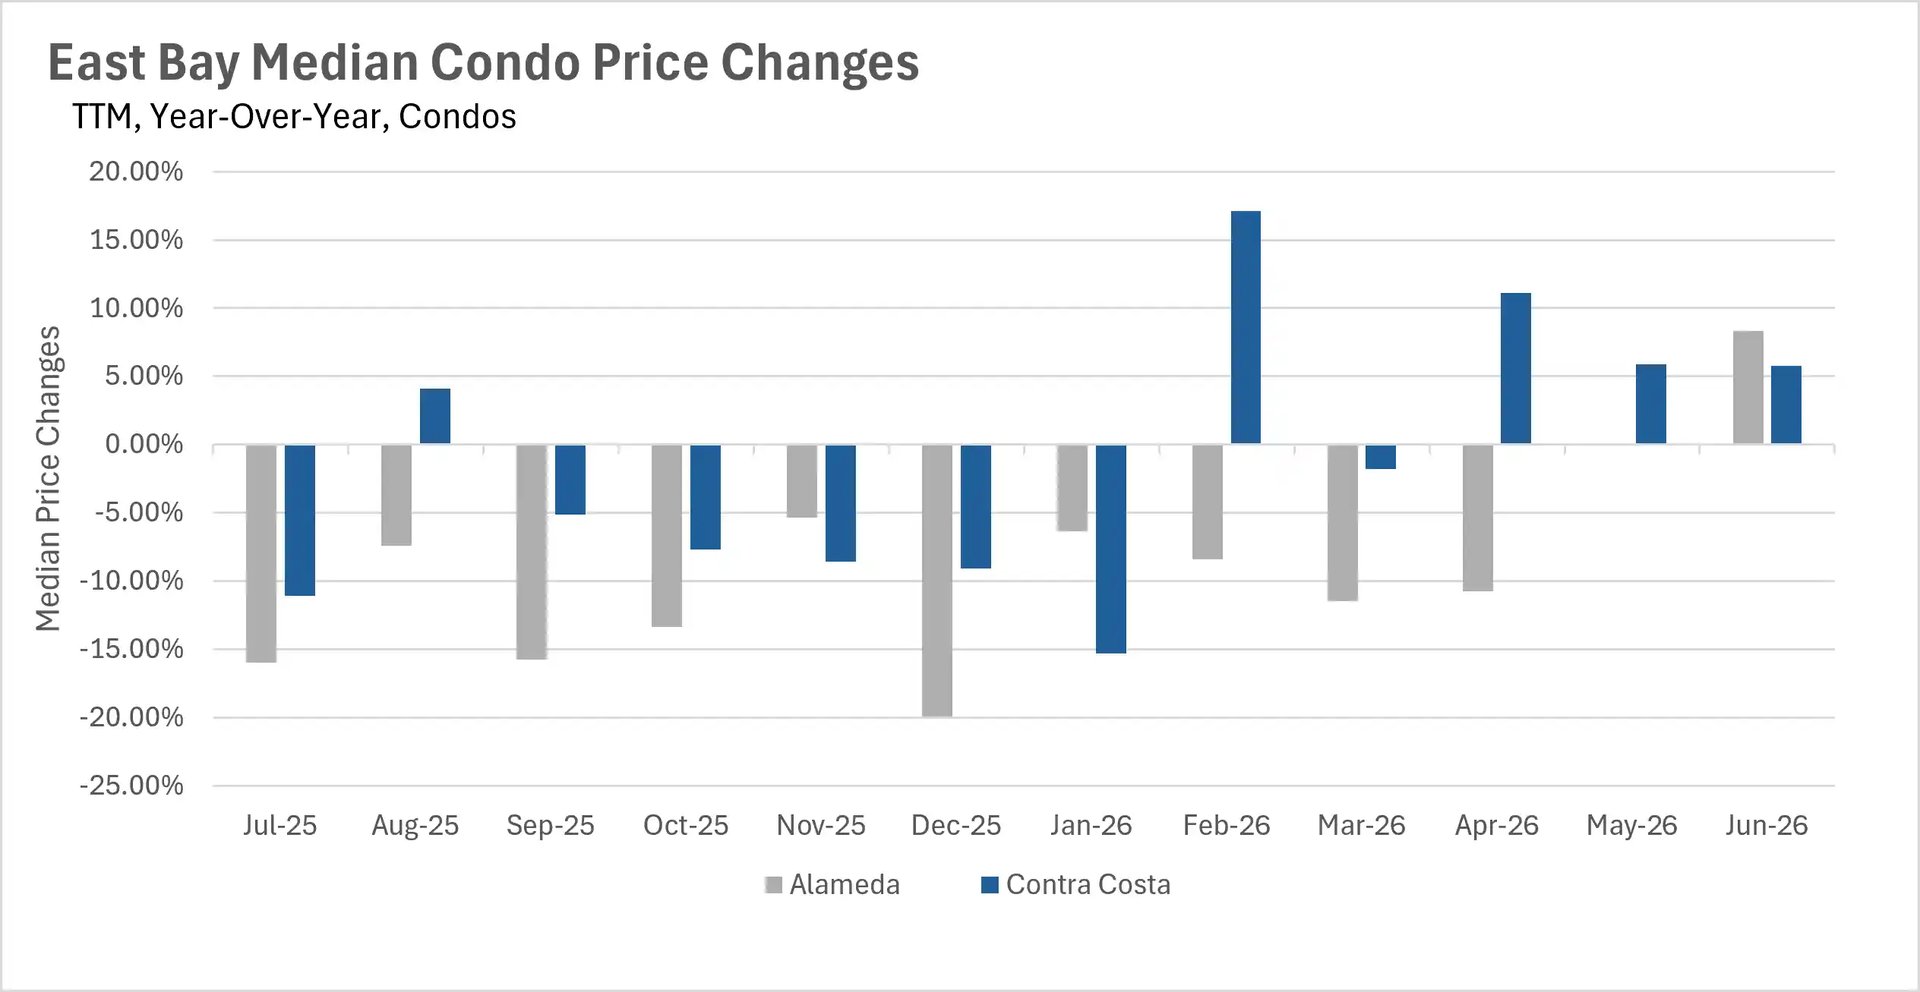
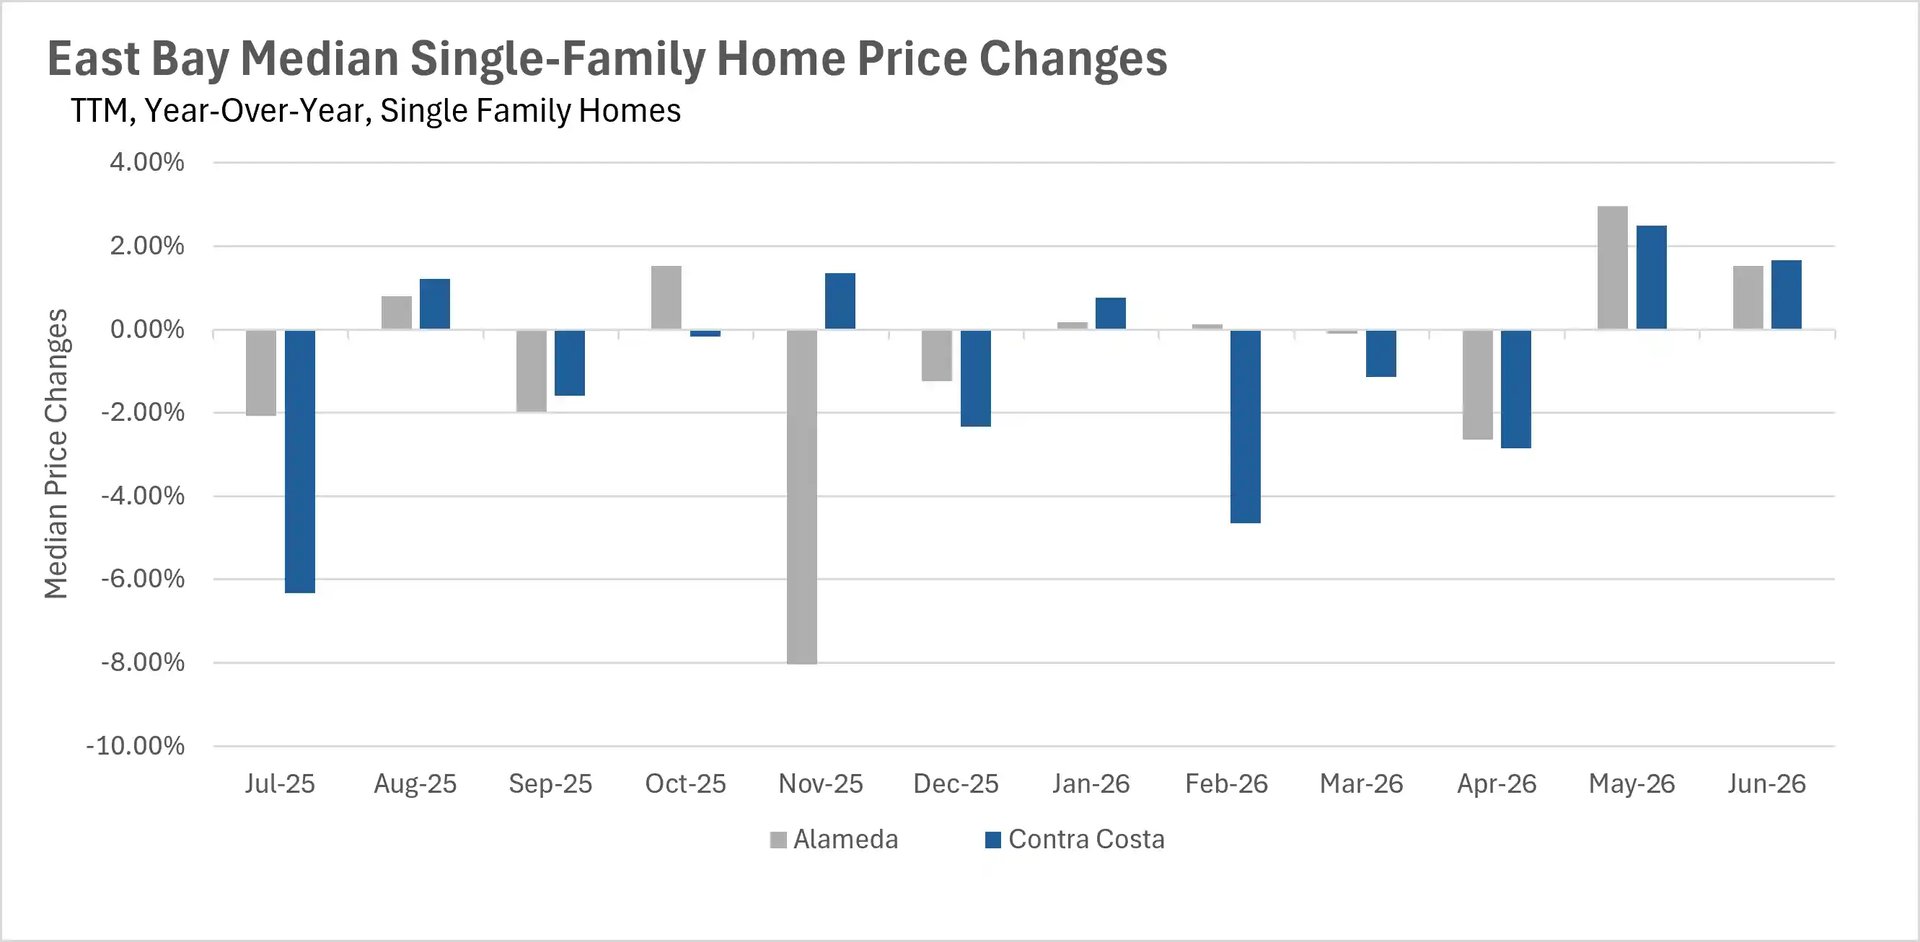
June brought even more good news for East Bay homeowners, as prices continued to climb across both the single-family and condo markets. In Alameda County, the median single-family home sold for $1,320,750, representing a 1.52% increase on a year-over-year basis. Contra Costa County saw similar gains, with the median single-family home selling for $915,000, up 1.67% compared to last year. The real story this month, however, is the remarkable turnaround in the condo market. Alameda County condos surged 8.35% year-over-year, with the median condo selling for $600,000. This is a dramatic reversal from the double-digit declines we were seeing just a few months ago. Contra Costa County condos also performed well, rising 5.76% to a median sale price of $523,500. After a prolonged period of weakness, the condo market appears to have turned the corner.
Inventory remains exceptionally tight heading into summer
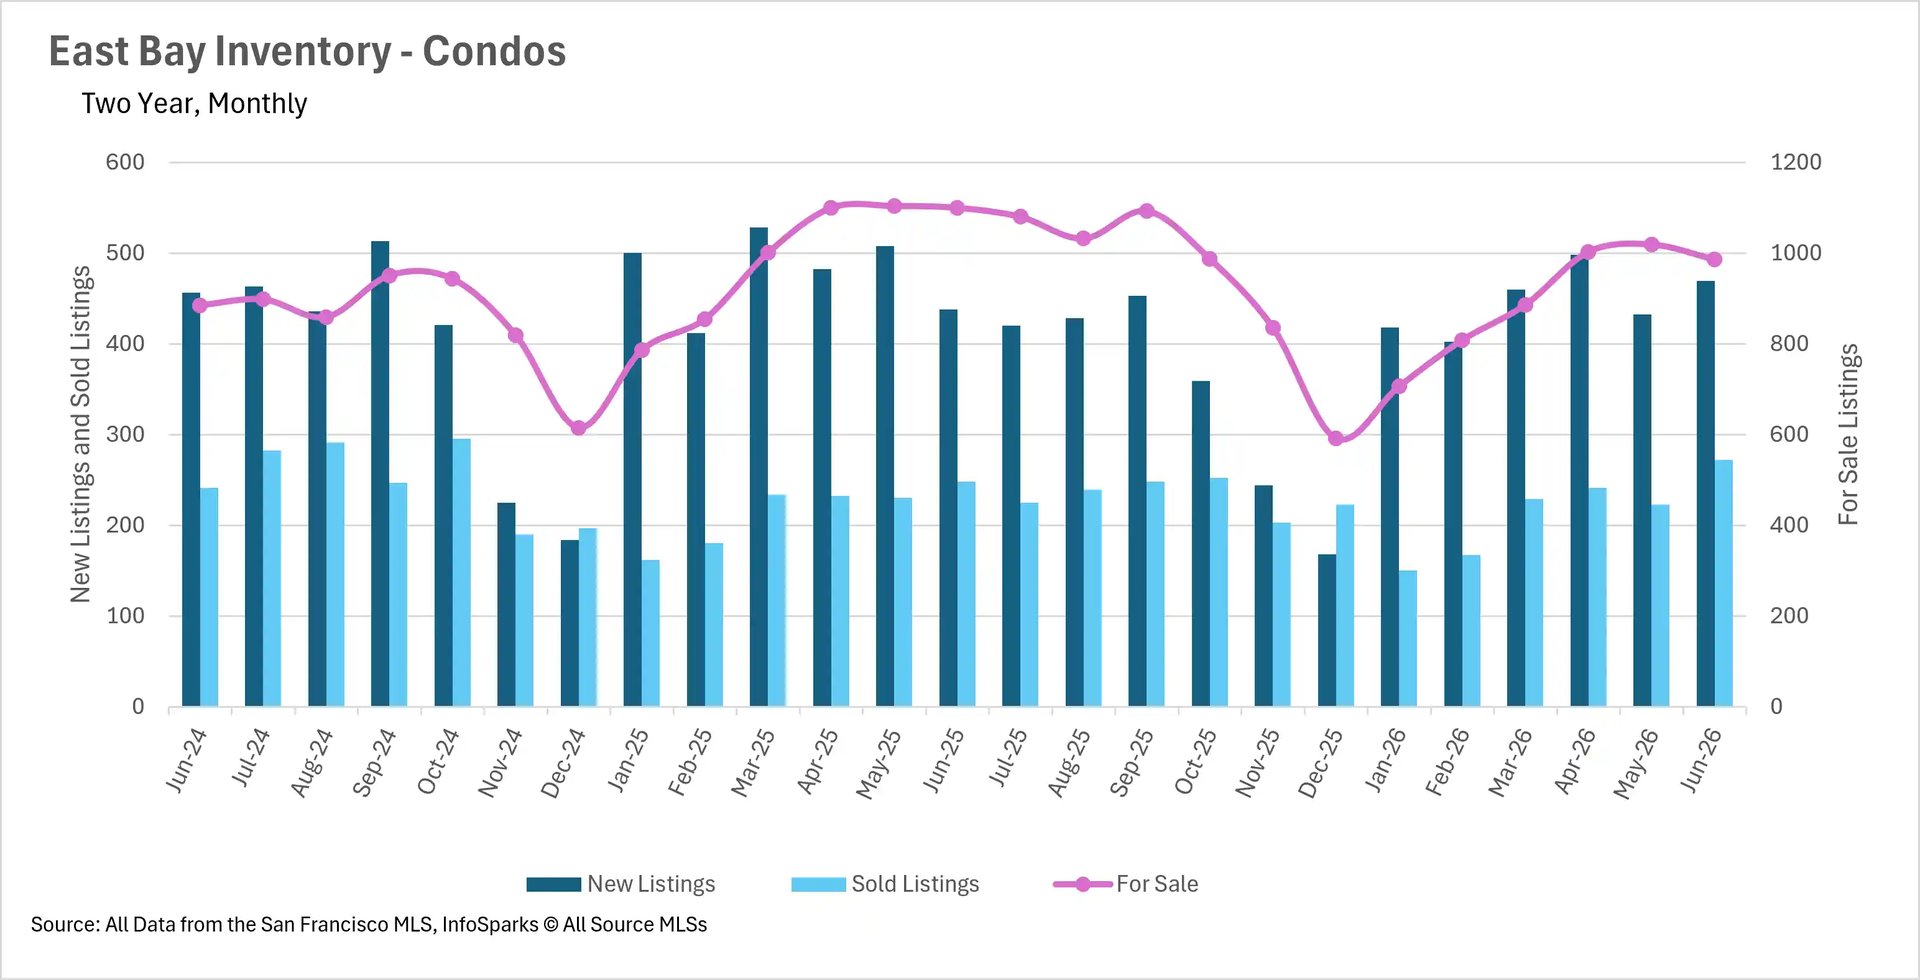
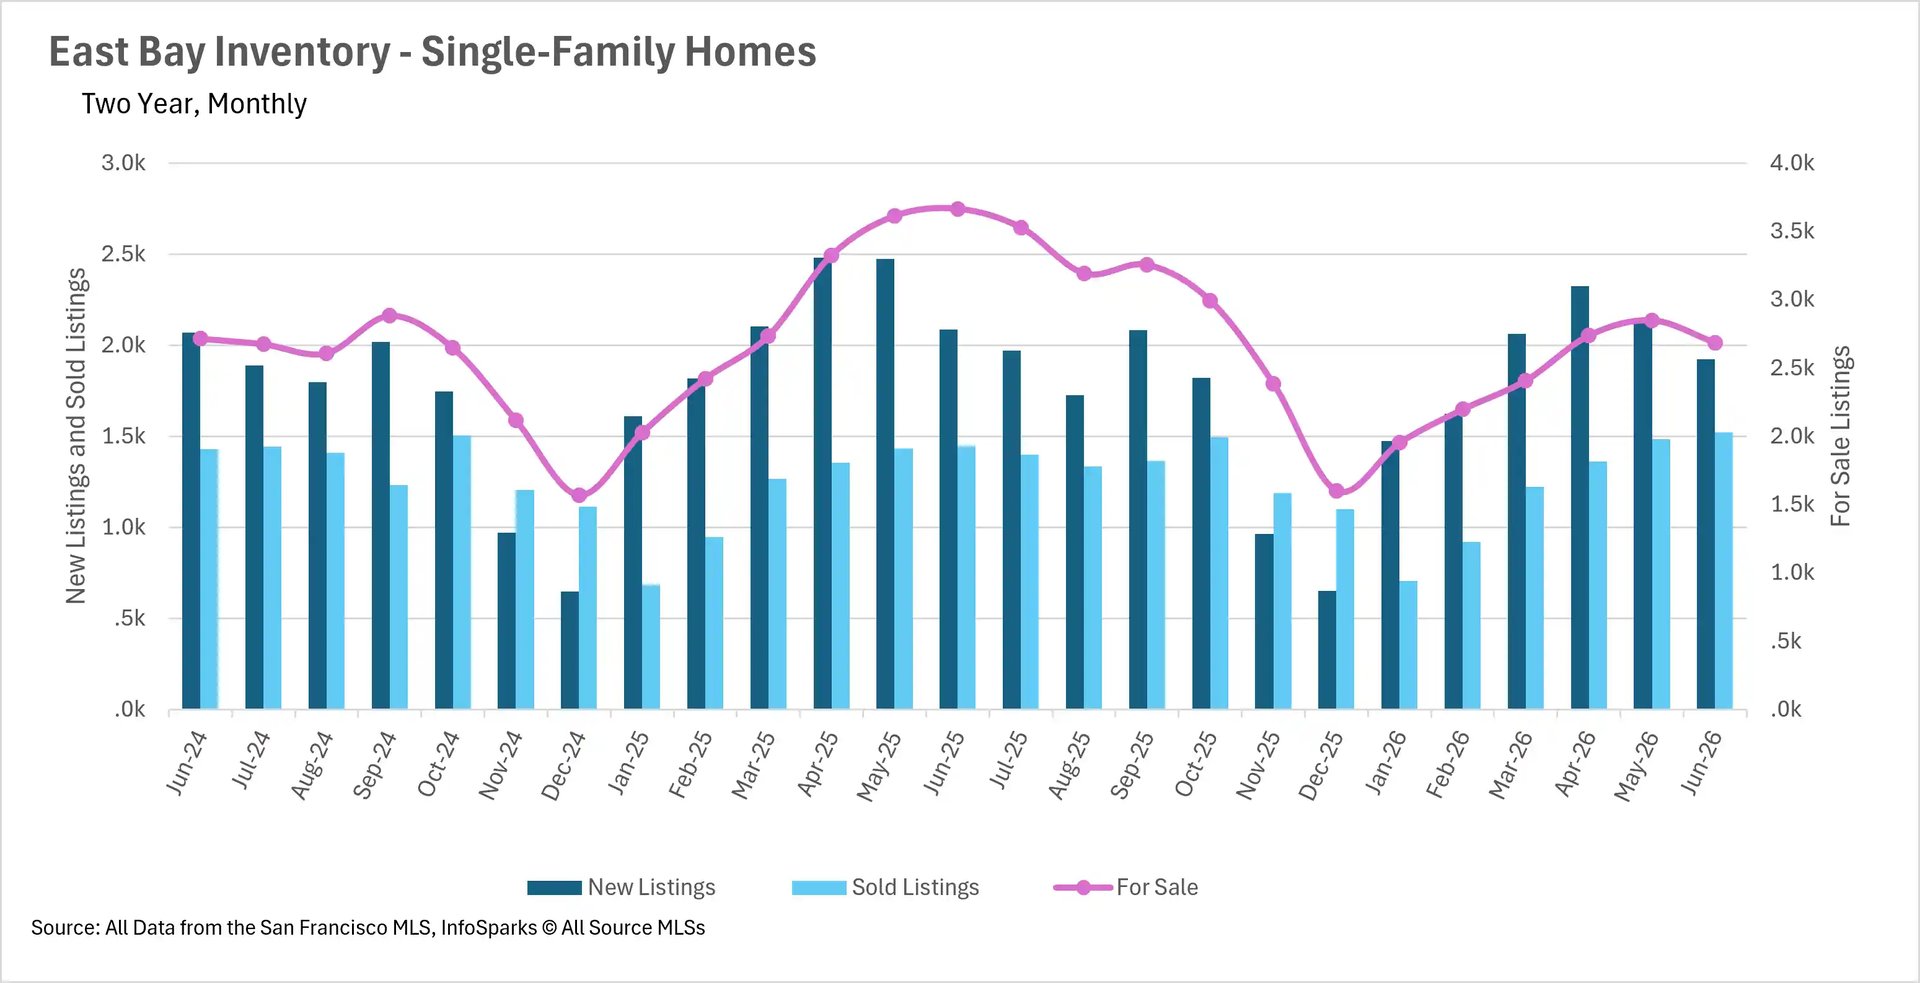
Despite the arrival of summer, inventory levels in the East Bay remain well below where they were a year ago. Single-family home inventory stood at just 2,684 units in June, representing a 26.79% decline on a year-over-year basis. The condo market saw a similar trend, with inventory down 10.36% year-over-year to 986 units. This persistent lack of supply continues to be the driving force behind the price appreciation we're seeing across both markets. With fewer homes to choose from, buyers are competing aggressively for available listings, which is pushing prices higher.
Single-family homes are moving considerably faster than last year
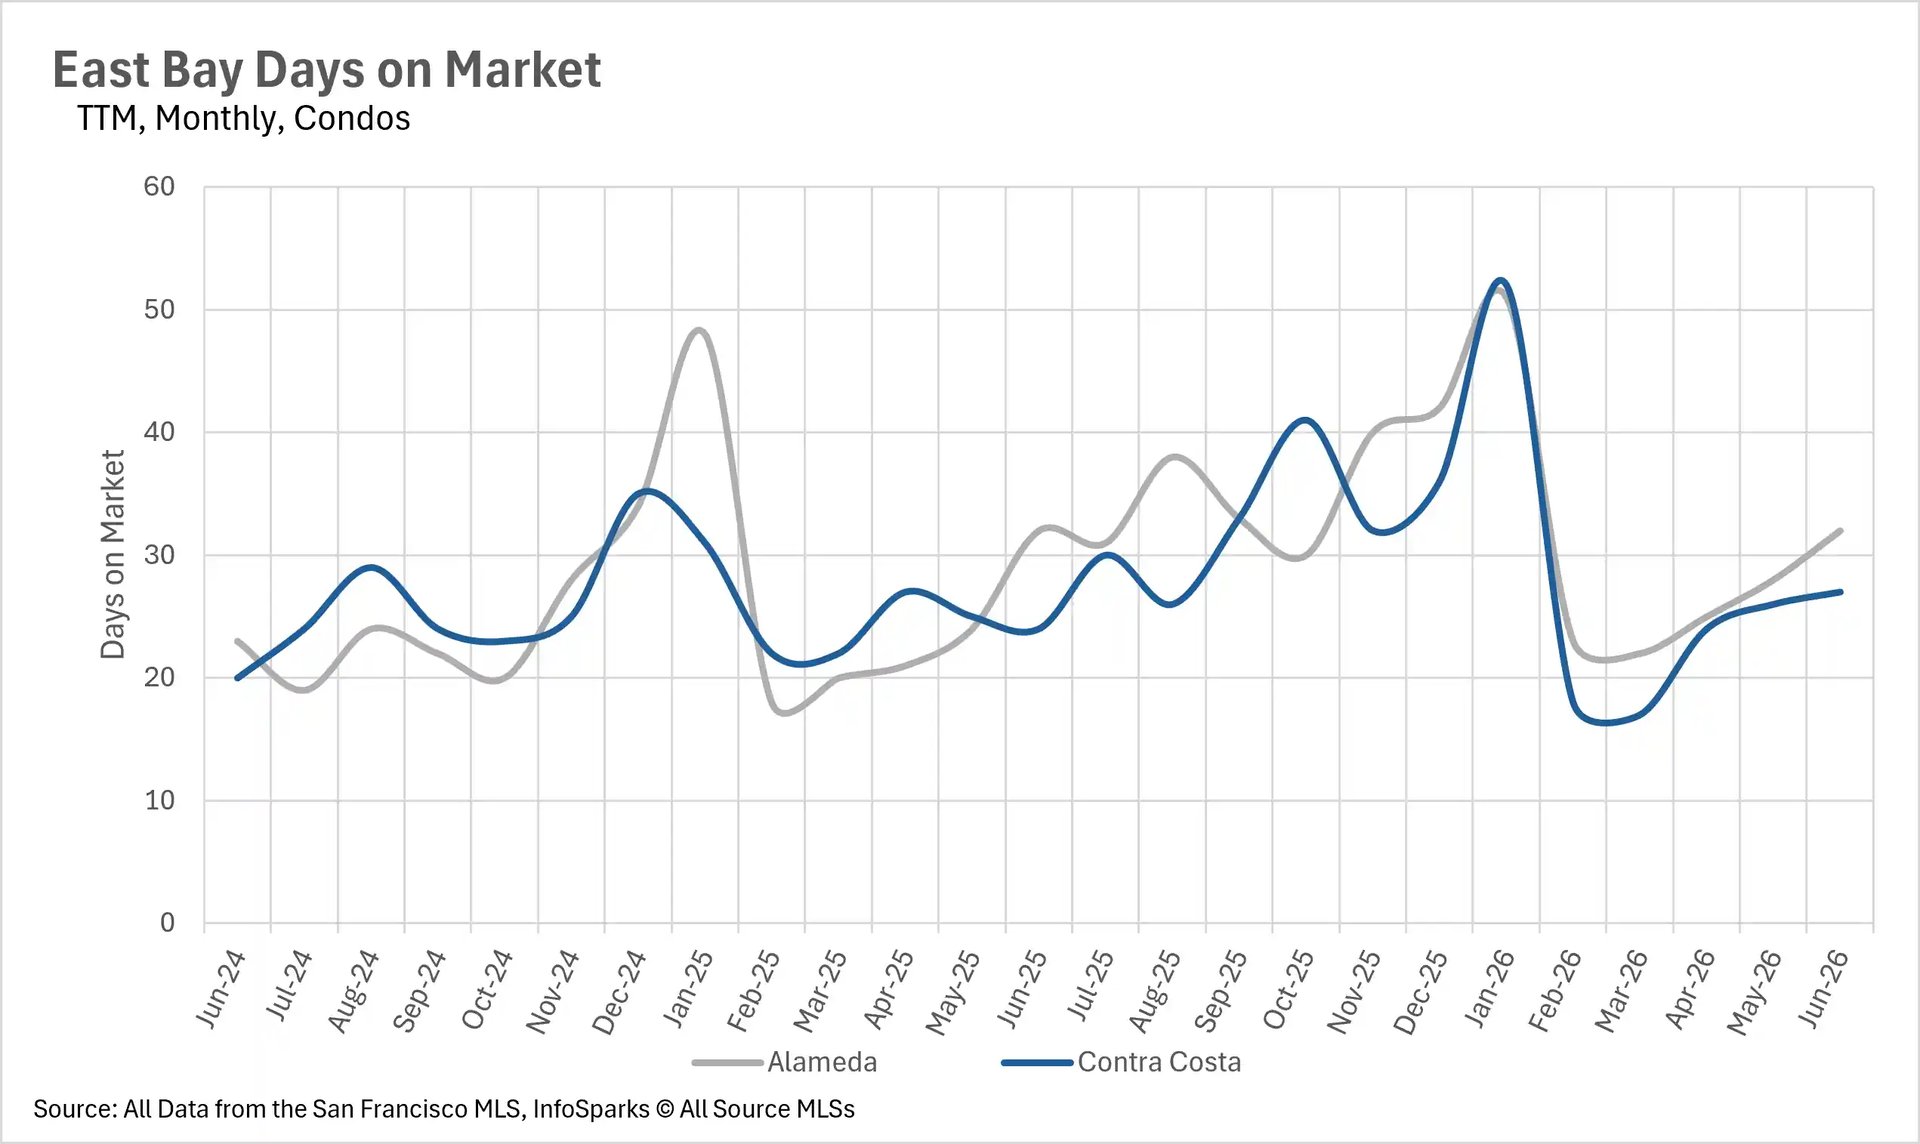
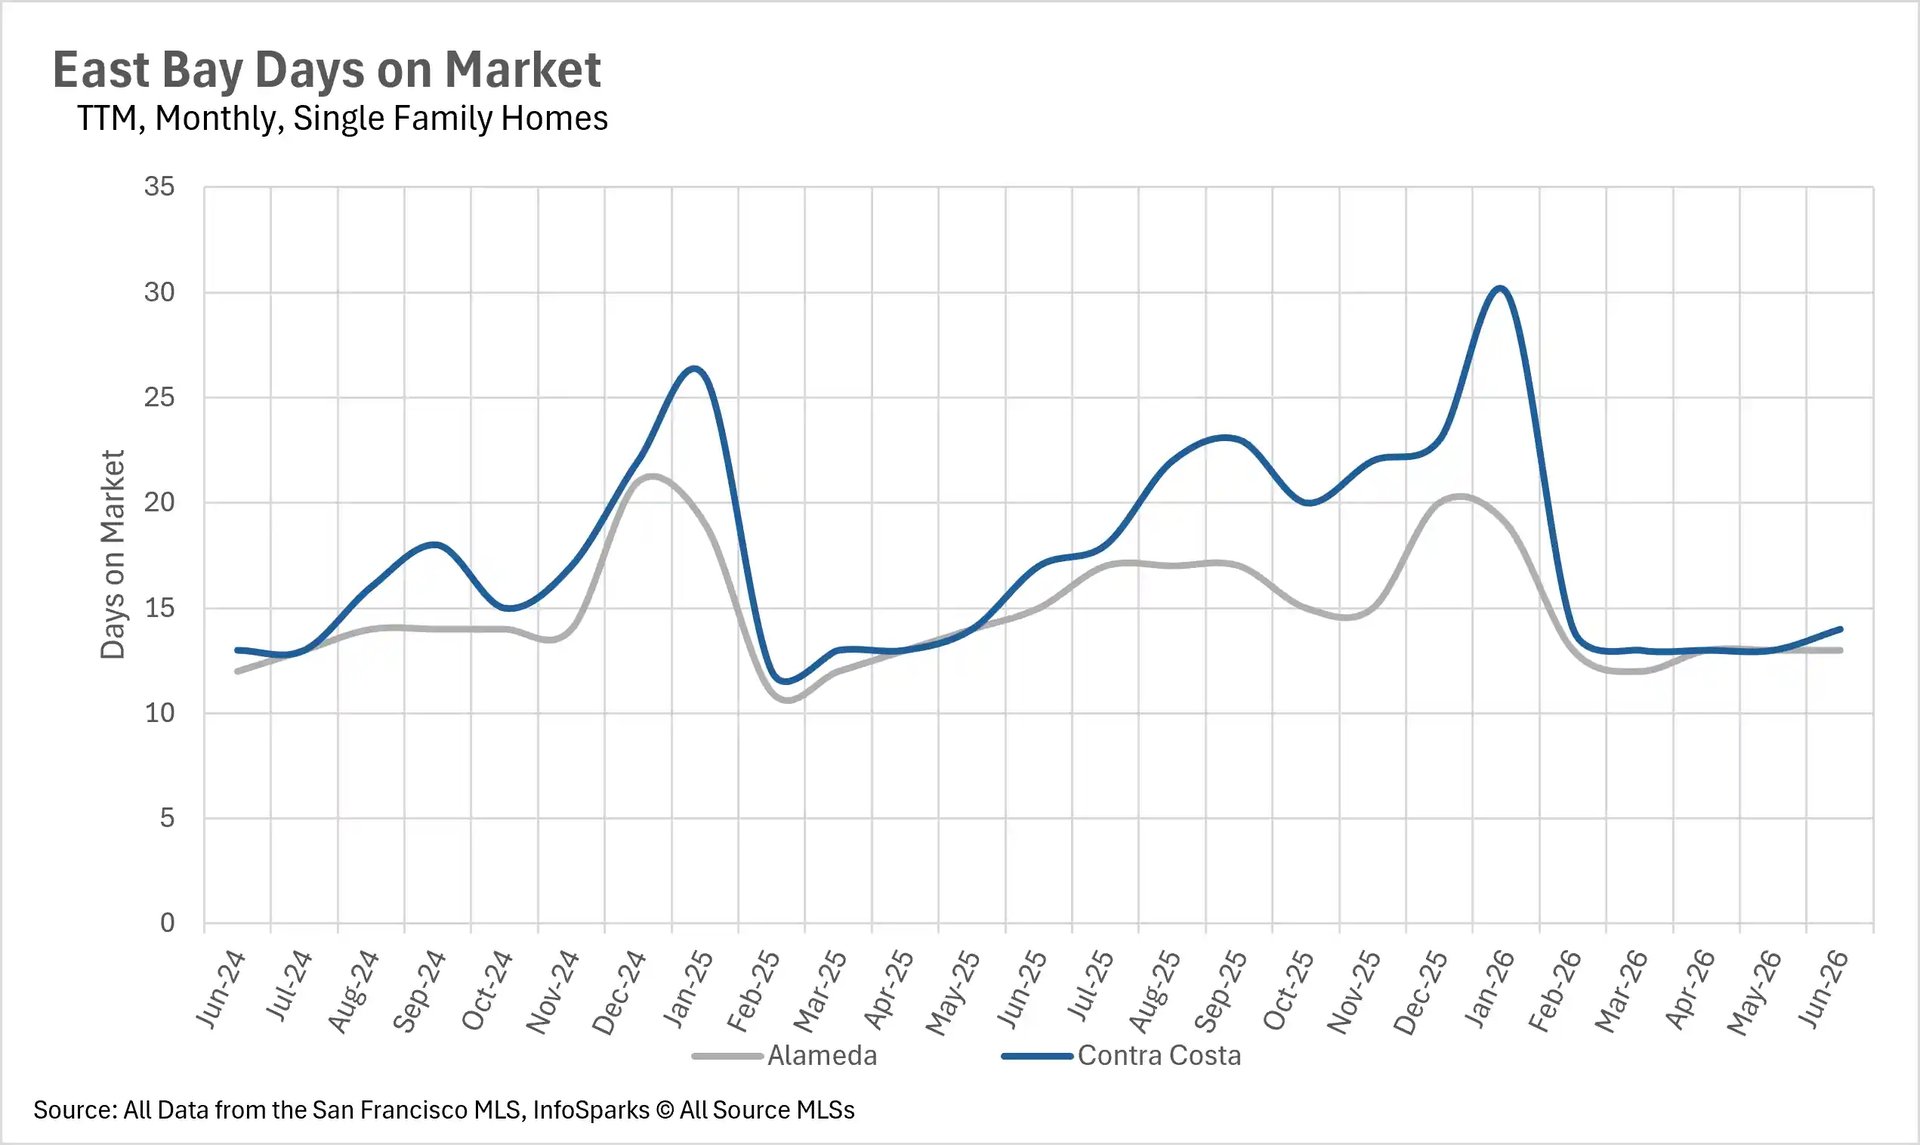
The tight inventory environment is pushing single-family homes to sell at an even faster clip than we saw a year ago. The average single-family home in Alameda County sold in just 13 days, representing a 13.33% improvement on a year-over-year basis. Contra Costa County saw an even bigger improvement, with the average listing selling in 14 days, a 17.65% year-over-year decline in days on market. The condo market is moving a bit more slowly, with the average condo in Alameda County spending 32 days on the market and Contra Costa County condos spending 27 days. While condos are taking longer to sell than single-family homes, they're still moving at a reasonable pace given broader market conditions.
Single-family homes remain a strong seller's market while condos please buyers
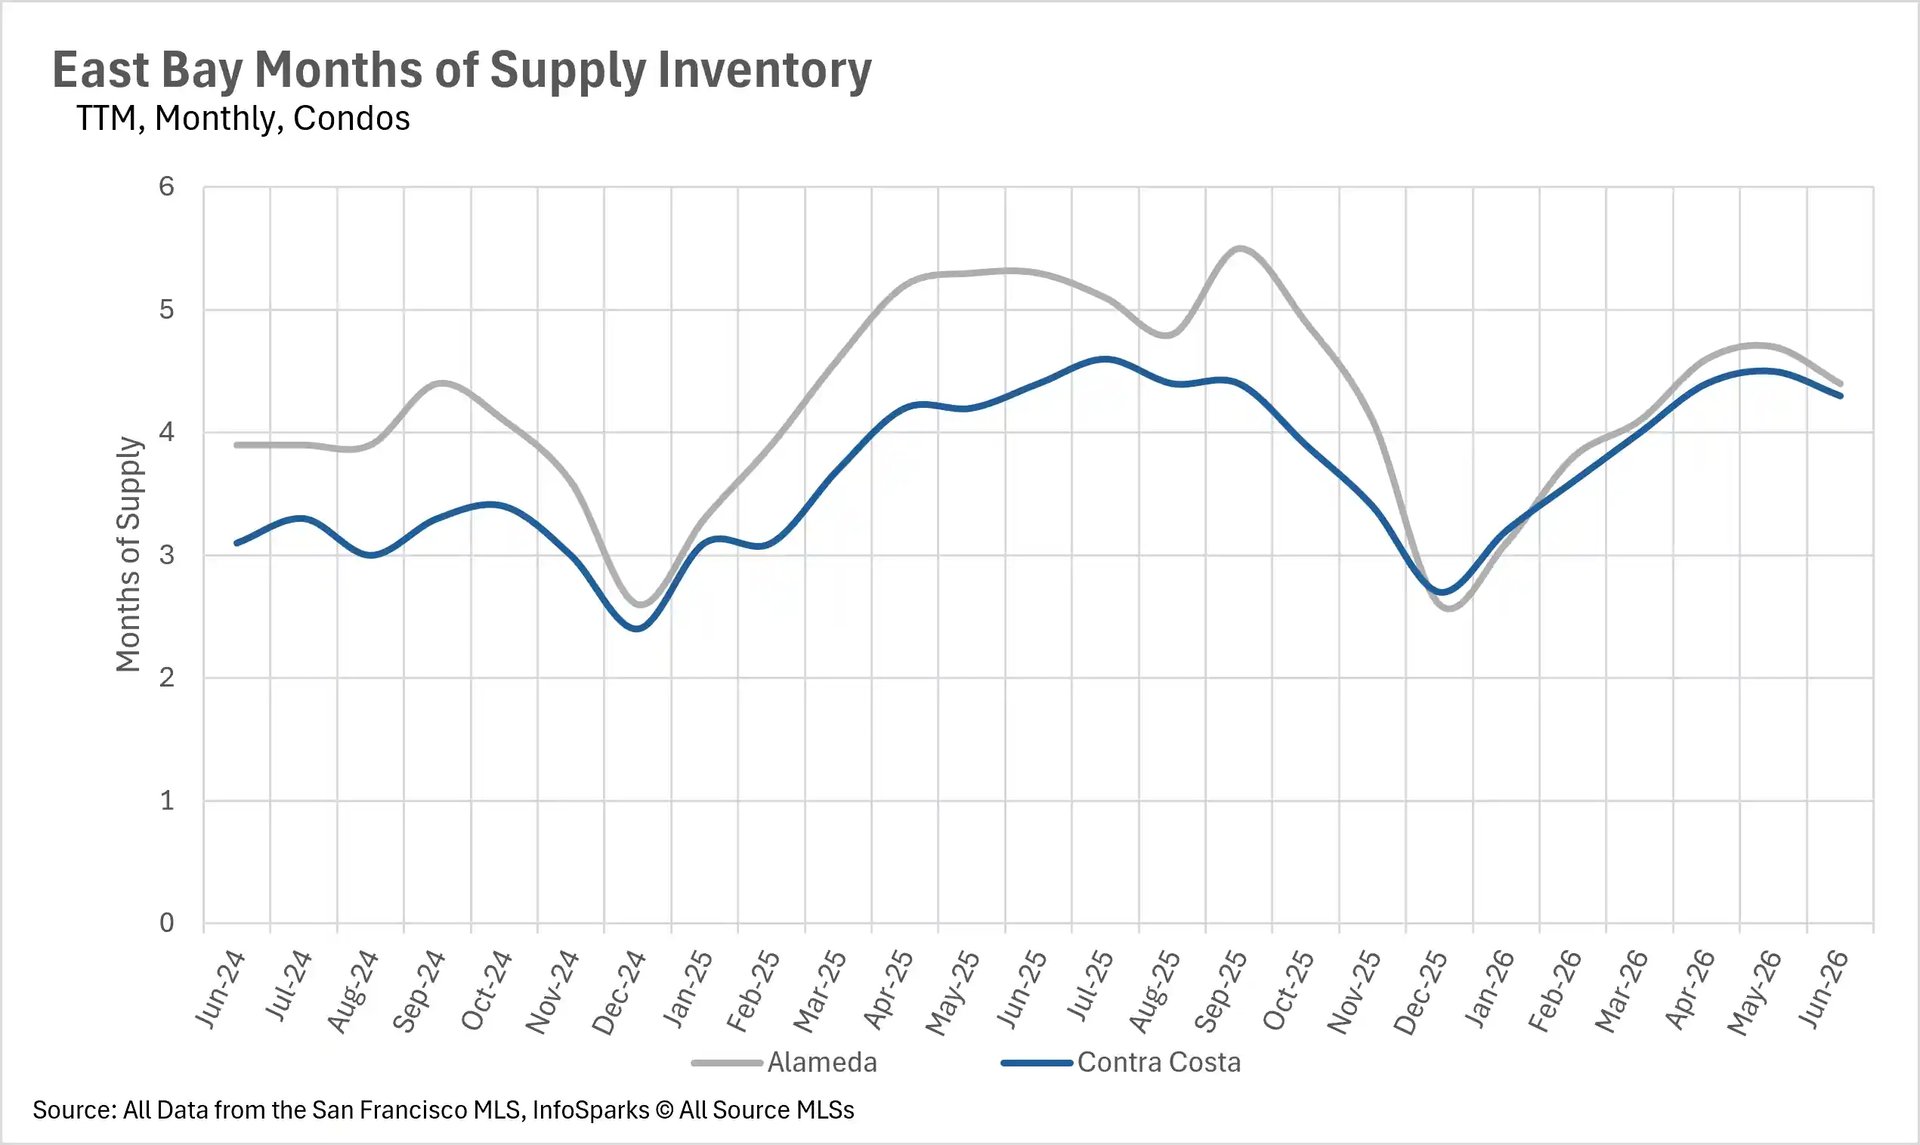
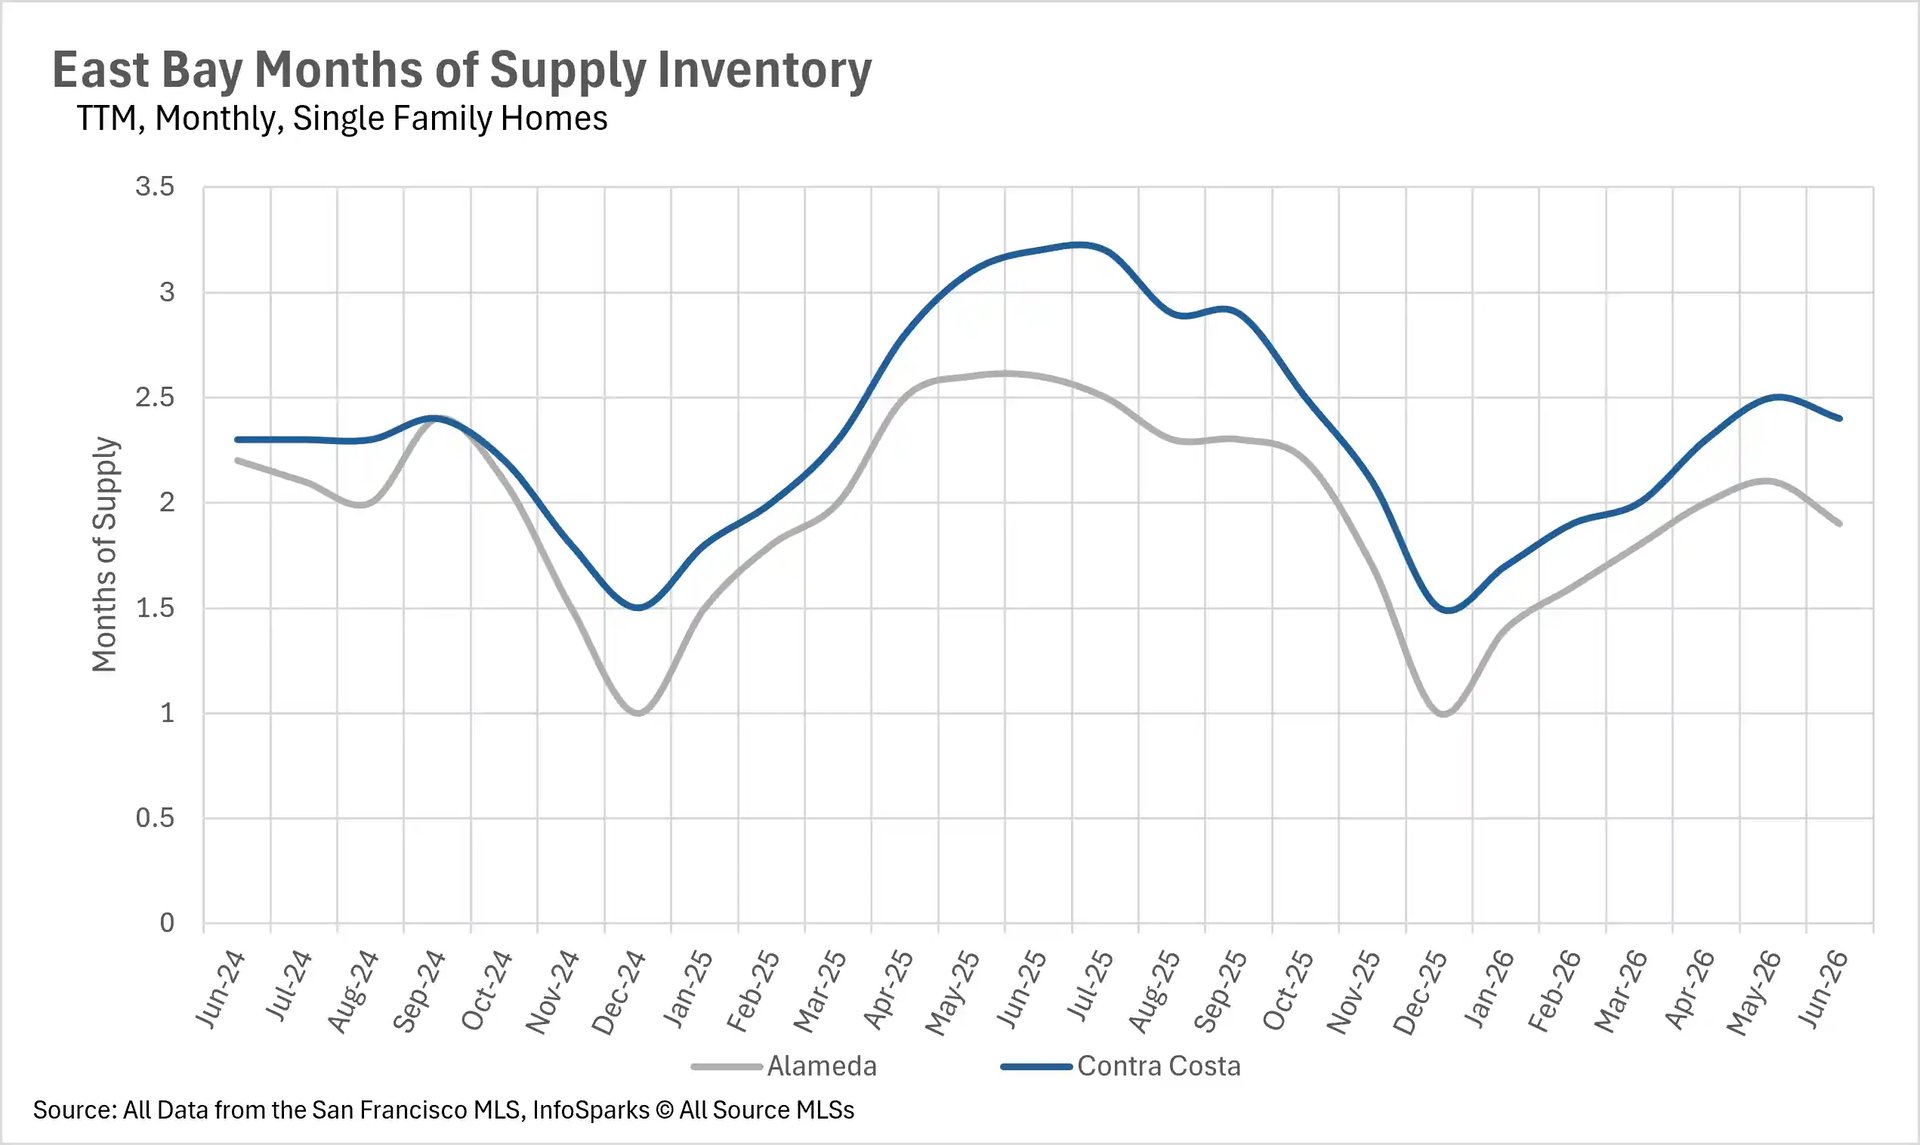
When determining whether a market is a buyers' market or a sellers' market, we look at the Months of Supply Inventory (MSI) metric. The state of California has historically averaged around three months of MSI, so any area with at or around three months of MSI is considered a balanced market. Any market that has less than three months of MSI is considered a seller's market, whereas markets with more than three months of MSI are considered buyers' markets.
The single-family home market remains firmly in seller's market territory, with just 1.9 months of inventory in Alameda County and 2.4 months in Contra Costa County. These figures represent year-over-year declines of 26.92% and 25.00%, respectively, indicating that buyers continue to face stiff competition for available homes. The condo market remains in buyer's market territory, with Alameda County ending June with 4.4 months of inventory and Contra Costa County with 4.3 months. However, these figures have come down from their peaks earlier in the year, suggesting that the condo market is gradually tightening alongside the price appreciation we're seeing.