
Updated October 30, 2026. Data through October 30, 2026.
Are Dogpatch condos selling above asking price?
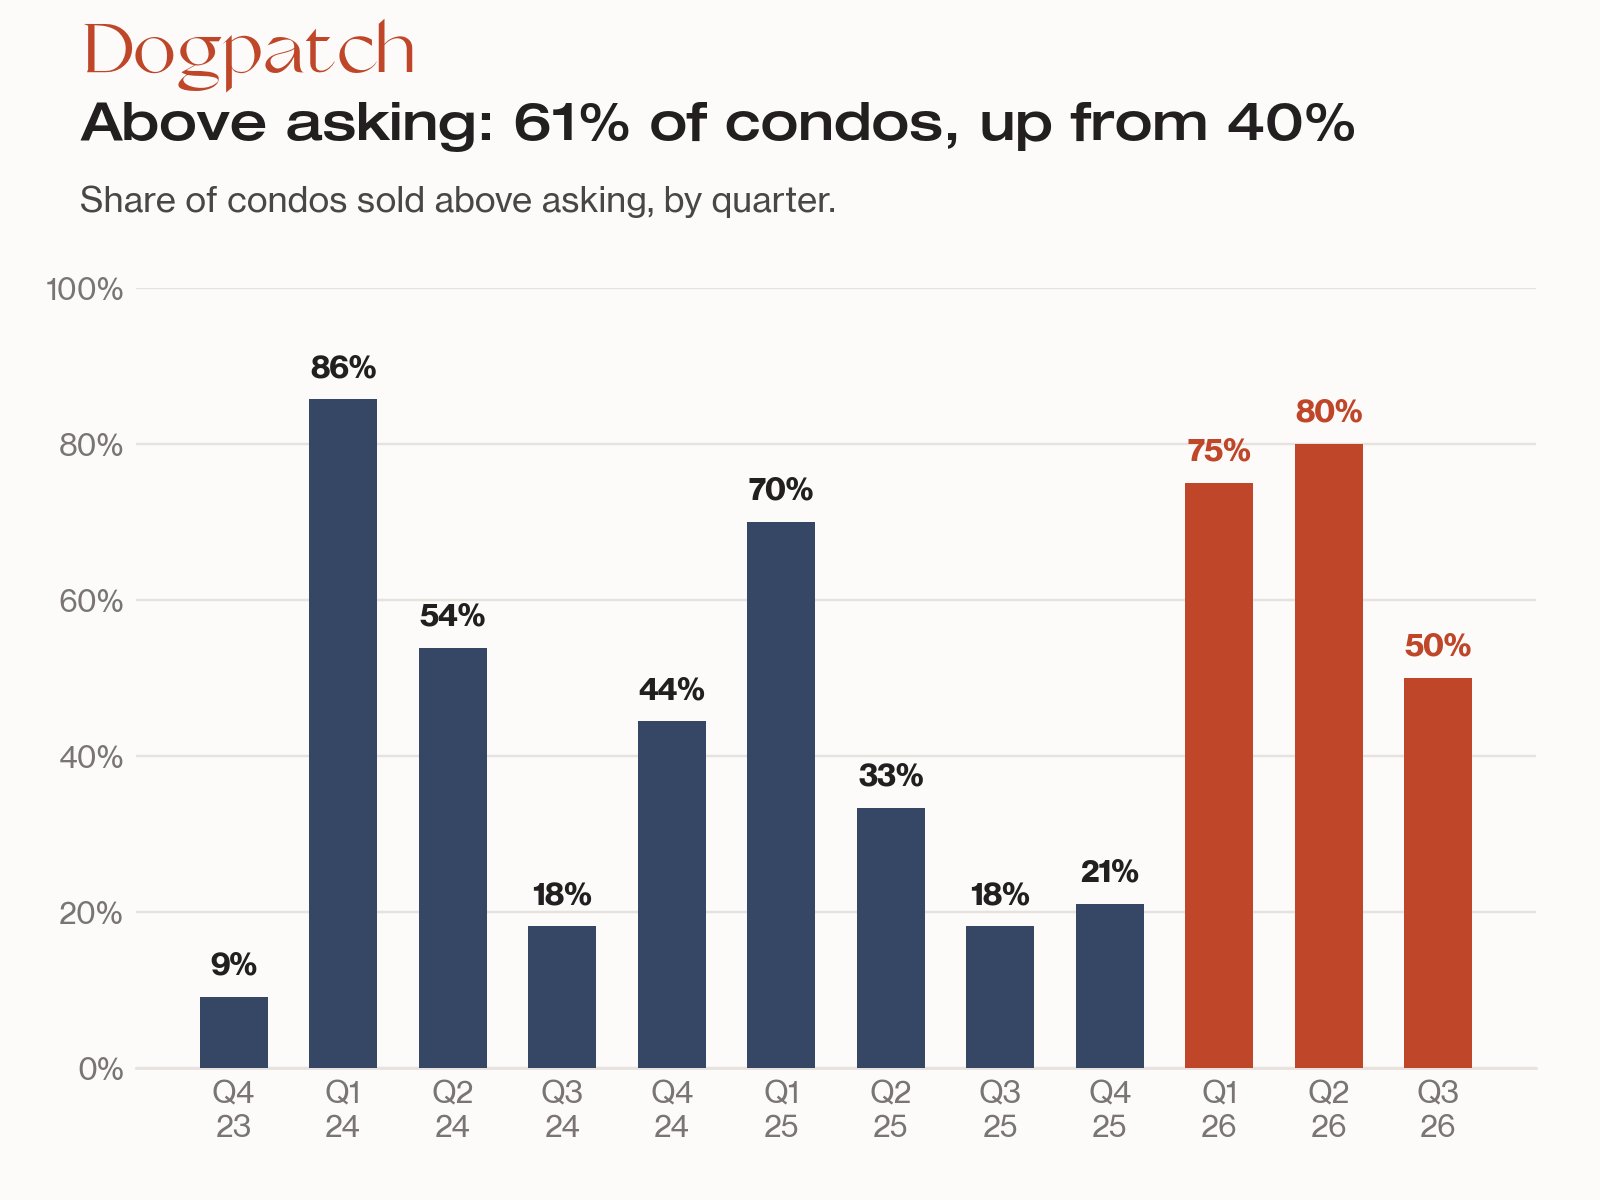
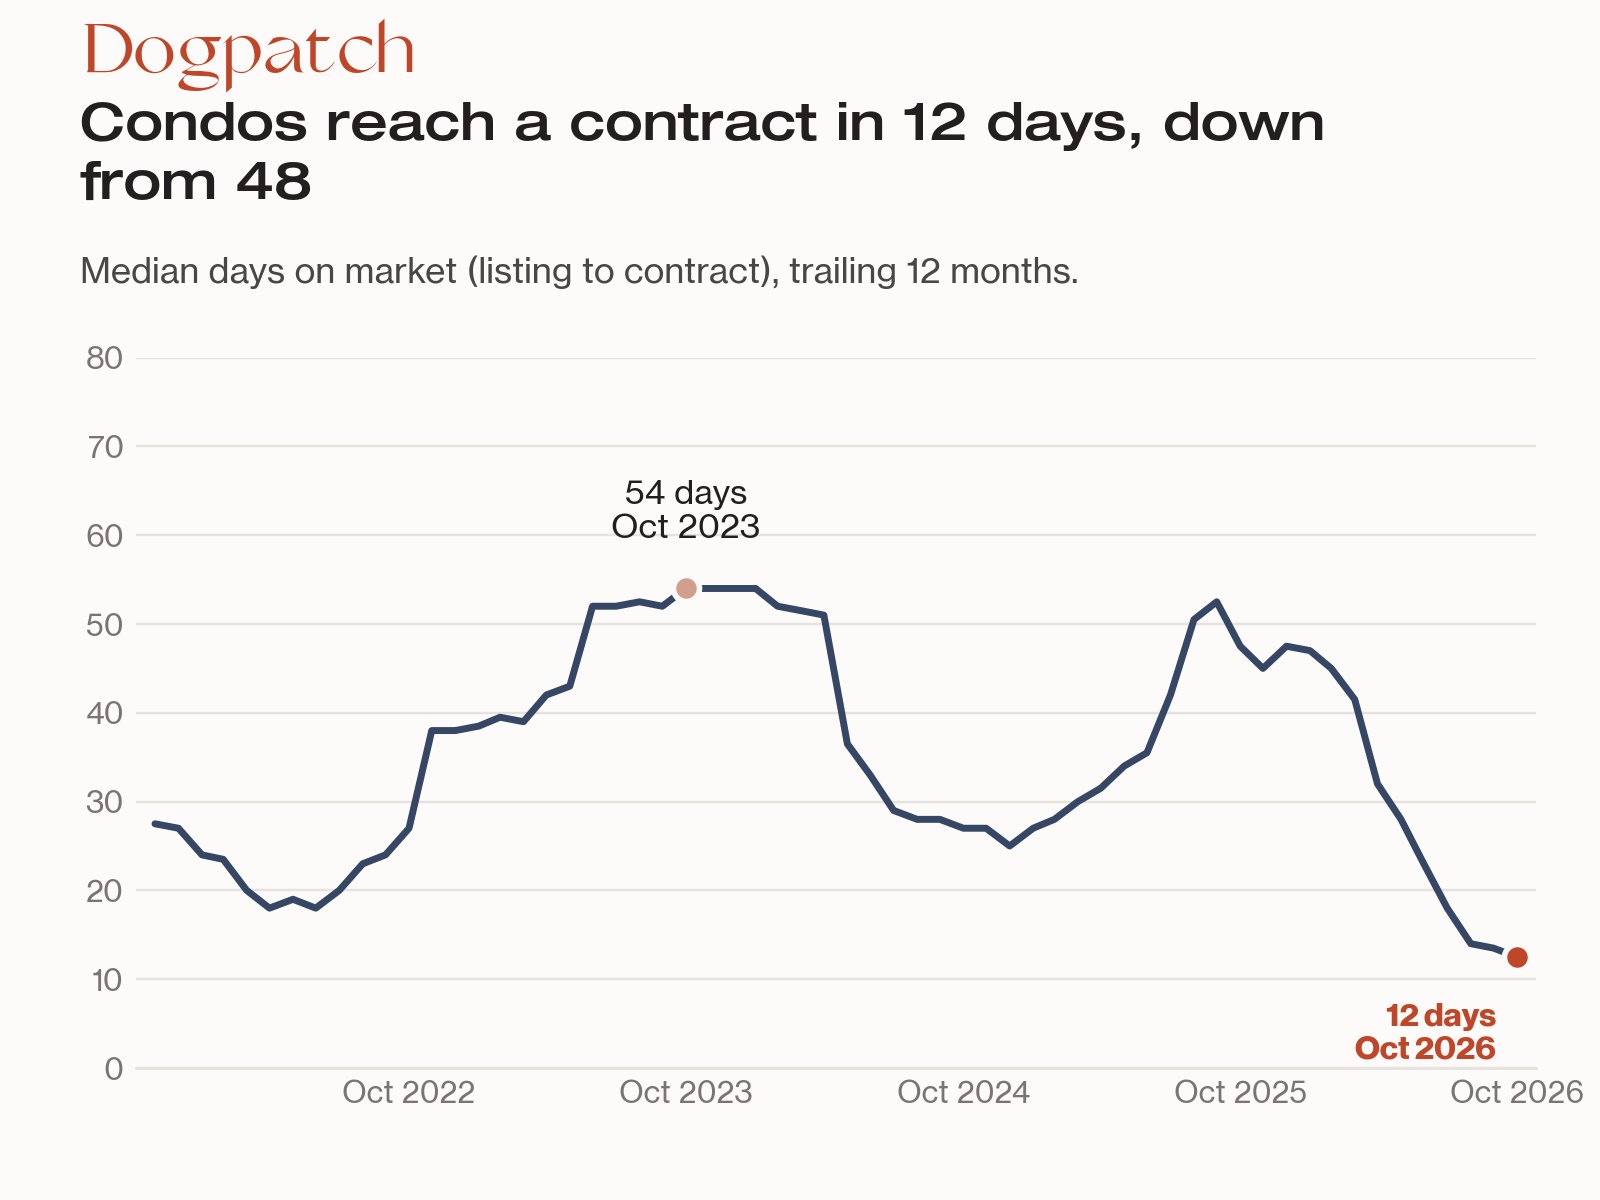
Yes, more often than a year ago, and much faster. Of the 46 Dogpatch condos that sold from November 2025 through October 2026, 61% closed above asking price, versus 40% in the 12 months before. The typical condo went under contract in 12 days, down from 48. Buyers face a higher borrowing cost too: Freddie Mac's 30-year fixed average was 7.24% on October 29, 2026, versus 6.17% a year earlier.
This update covers condominiums in Dogpatch/Central Waterfront, using San Francisco Association of REALTORS (SFAR) MLS sales through October 30, 2026. For the area's character and amenities, see our Dogpatch neighborhood guide.
What do the latest Dogpatch condo numbers show?
Condos are selling faster and above asking more often, while the median sale price is about where it was a year ago. For comparison with the wider city, see our San Francisco market update: the citywide median condo price was $1,316,500 in September 2026.
Dogpatch condos, trailing 12 months through October 2026 (46 sales), compared with the 12 months before (48 sales). | ||
Measure | Now | A year ago |
|---|---|---|
Sold above asking | 61% | 40% |
Median days to contract | 12.5 | 47.5 |
Sales that needed a price cut | 22% | 33% |
Median price per sq ft | $1,150 | $991 |
Median sale price | $1,017,500 | $1,030,000 |
Closed sales | 46 | 48 |
August through October 2026 versus the same months last year:
- Sold above asking: 75% (6 of 8 sales), up from 19% (3 of 16).
- Median days to contract: 7.5, down from 49.
- Median price per sq ft: $1,223, up from $895.
- New listings: 17, compared with 16.
- Homes going under contract: 7, compared with 17.
October on its own: 4 condos sold, at a median of $967,500 and 7 days to contract. That is a small number, so the longer view leads.
What changed in the Dogpatch condo market?
Speed and competition changed the most. The drop from 48 to 12 median days to contract, and the rise in above-asking sales from 40% to 61%, are both larger than the swings you'd expect from a market this size.
Price per square foot is the number we'd trust. The median sale price slipped 1%, but with only 46 sales it could plausibly sit anywhere from about 21% lower to 43% higher than a year ago, so we don't lead with it. Price per square foot rose 16% over the same period, and could plausibly sit anywhere from about 4% to 31% higher. Holding last year's mix of one- and two-bedroom units fixed, the gain was 19%.
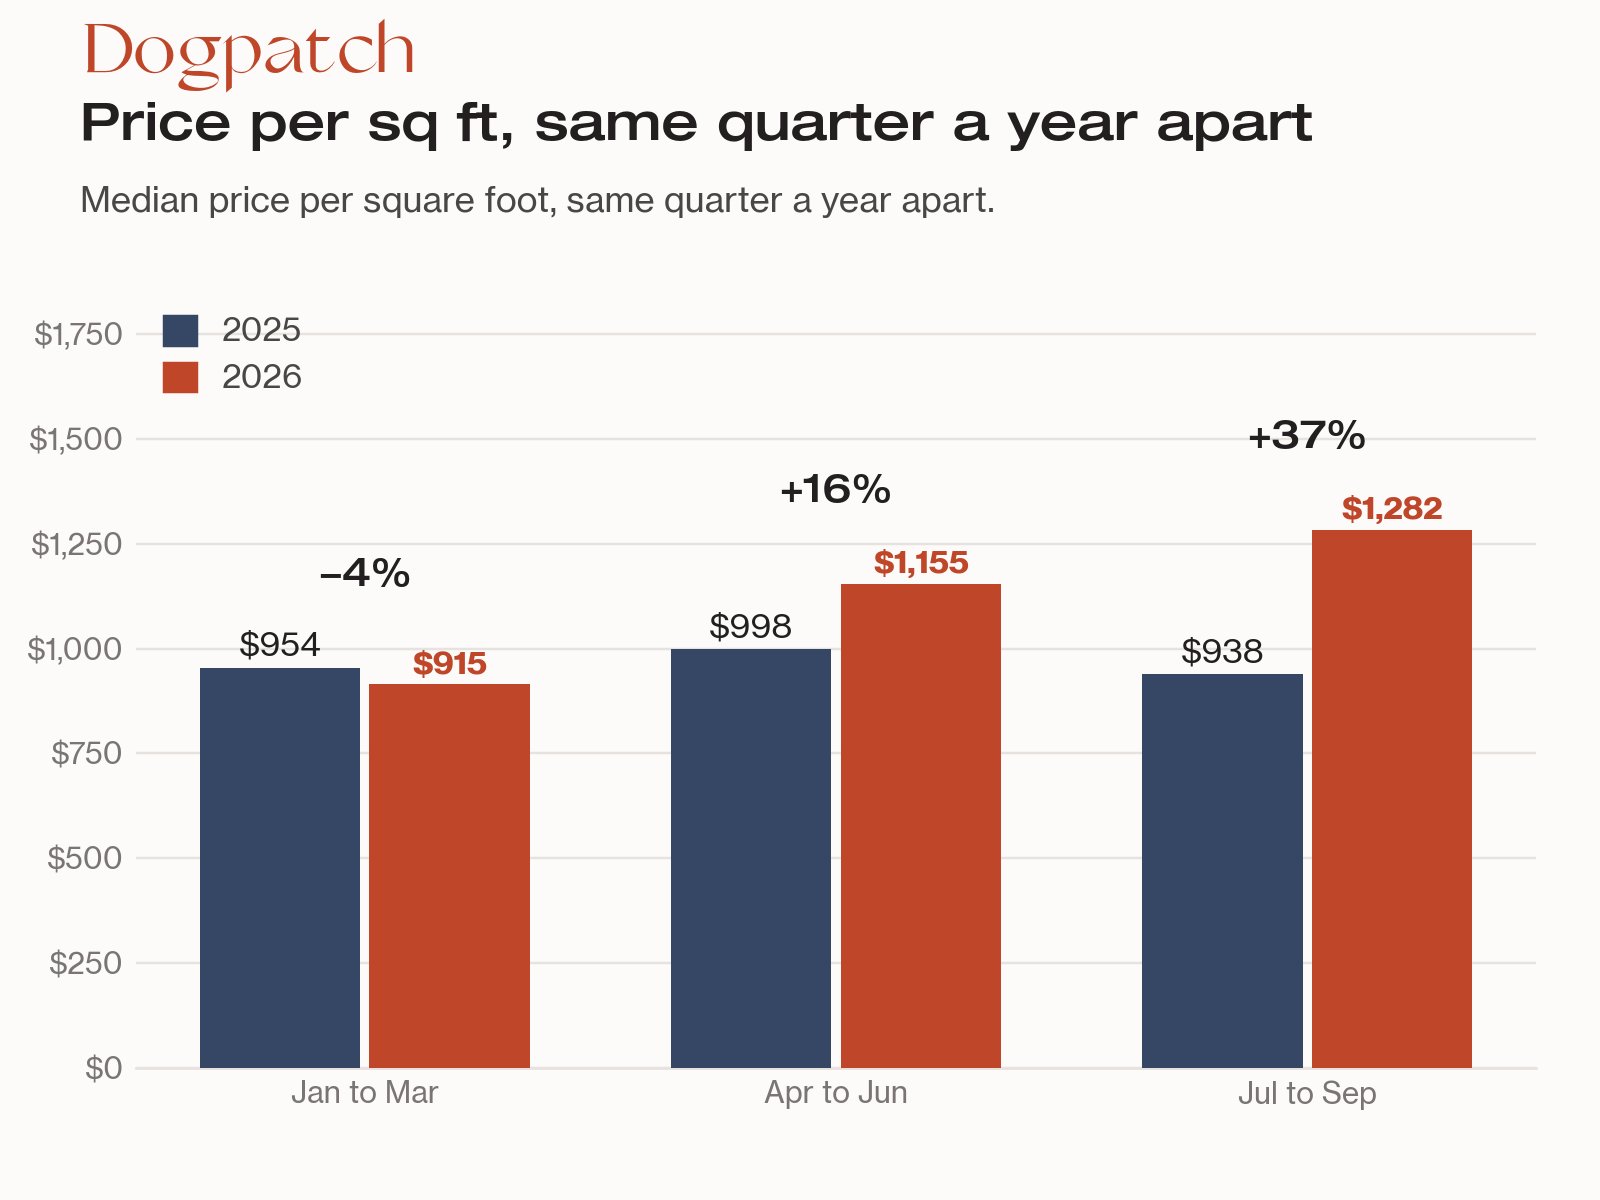
The first quarter of 2026 was 4% below the first quarter of 2025. The second quarter was 16% above and the third quarter 37% above, on 8 sales, so the climb is recent.
We can check this another way. Of the condos that sold in the last 12 months, 17 had sold before (each held at least a year). The median change between the two sales was a gain of about 4% over a median of 6.6 years, and 12 of the 17 sold for more than their previous price. That is a sanity check on direction, not a forecast.
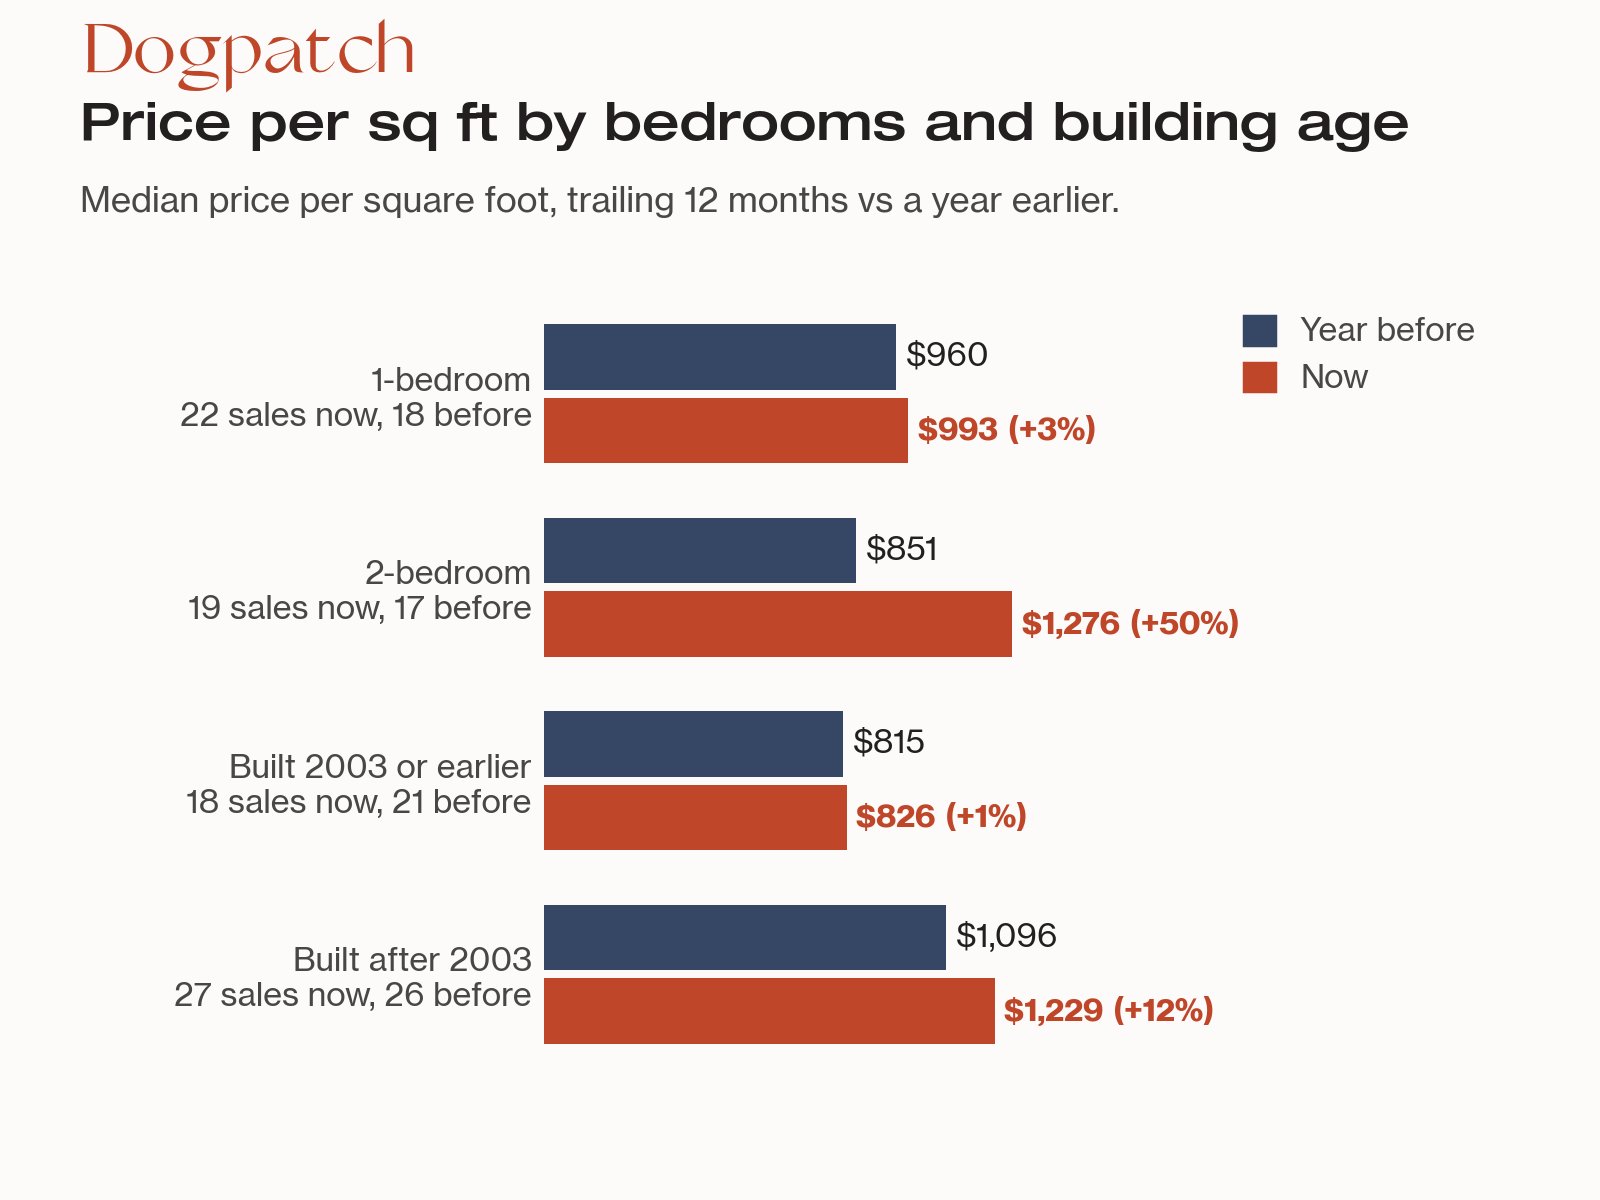
Where the gains are. Two-bedroom condos drove it: price per square foot rose 50%, from $851 to $1,276, across 19 recent sales. Condos built after 2003 rose 12%. One-bedrooms (+3%) and buildings from 2003 or earlier (+1%) were roughly flat, and with 18 to 22 sales per group we wouldn't read much into those small moves.
Which Dogpatch condo price tiers are most competitive?
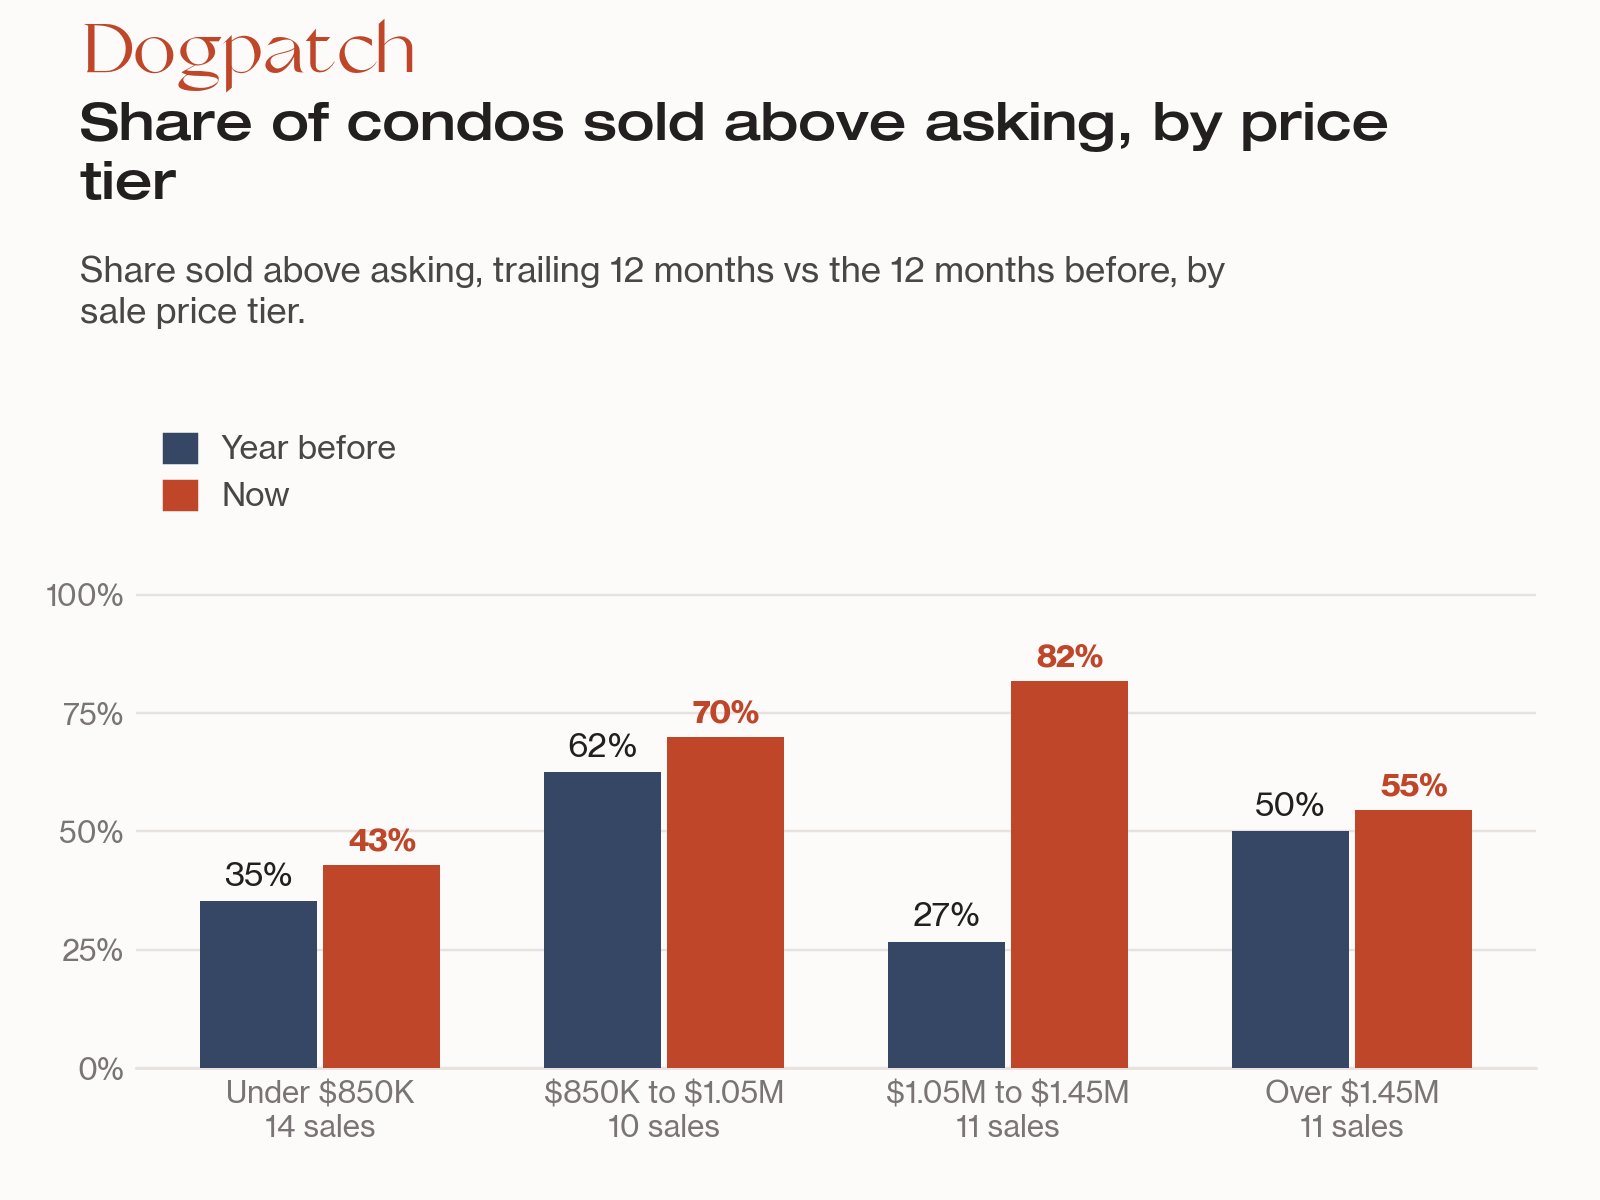
The $1.05 million to $1.45 million tier. There, 82% of condos sold above asking over the last 12 months, up from 27%, and the median condo went under contract in 11 days instead of 56. Condos between $850,000 and $1.05 million (70% above asking, 8 days) and over $1.45 million (55%, 8 days) also moved quickly.
Condos under $850,000 look different: 43% sold above asking, the median took 43 days to reach a contract, and 36% needed a price cut. Each tier has 10 to 14 sales, so treat these as a guide to where competition sits rather than a precise ranking.
Is Dogpatch a buyer's or seller's market?
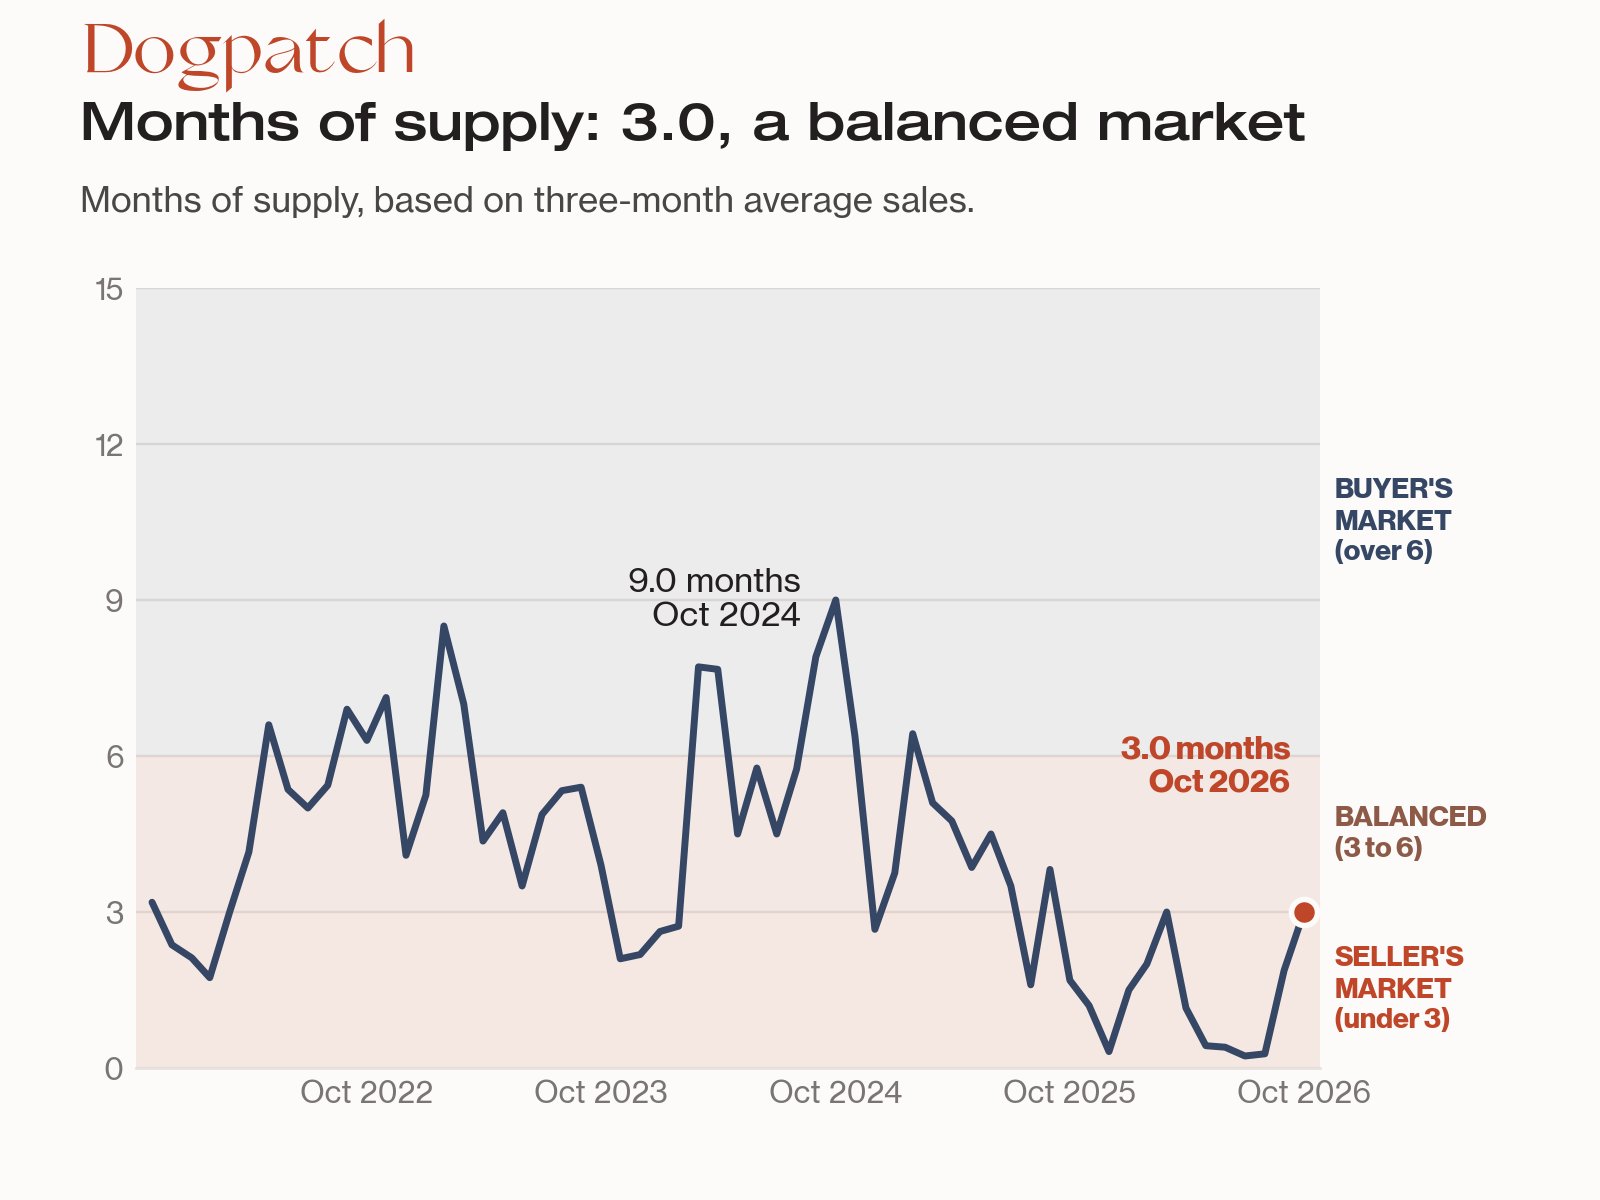
Right now it's balanced. Dogpatch has 3.0 months of supply, based on average sales over the last three months. Under 3 months favors sellers, 3 to 6 is balanced, and over 6 favors buyers. Eight condos are for sale today (median asking price $1,446,500, none cut yet, none listed more than 60 days), so supply is thin.
The reading is higher than it was this spring, when supply fell below one month. The last buyer's-market stretch peaked at 9.0 months in October 2024.
Are Dogpatch condo prices at a record?
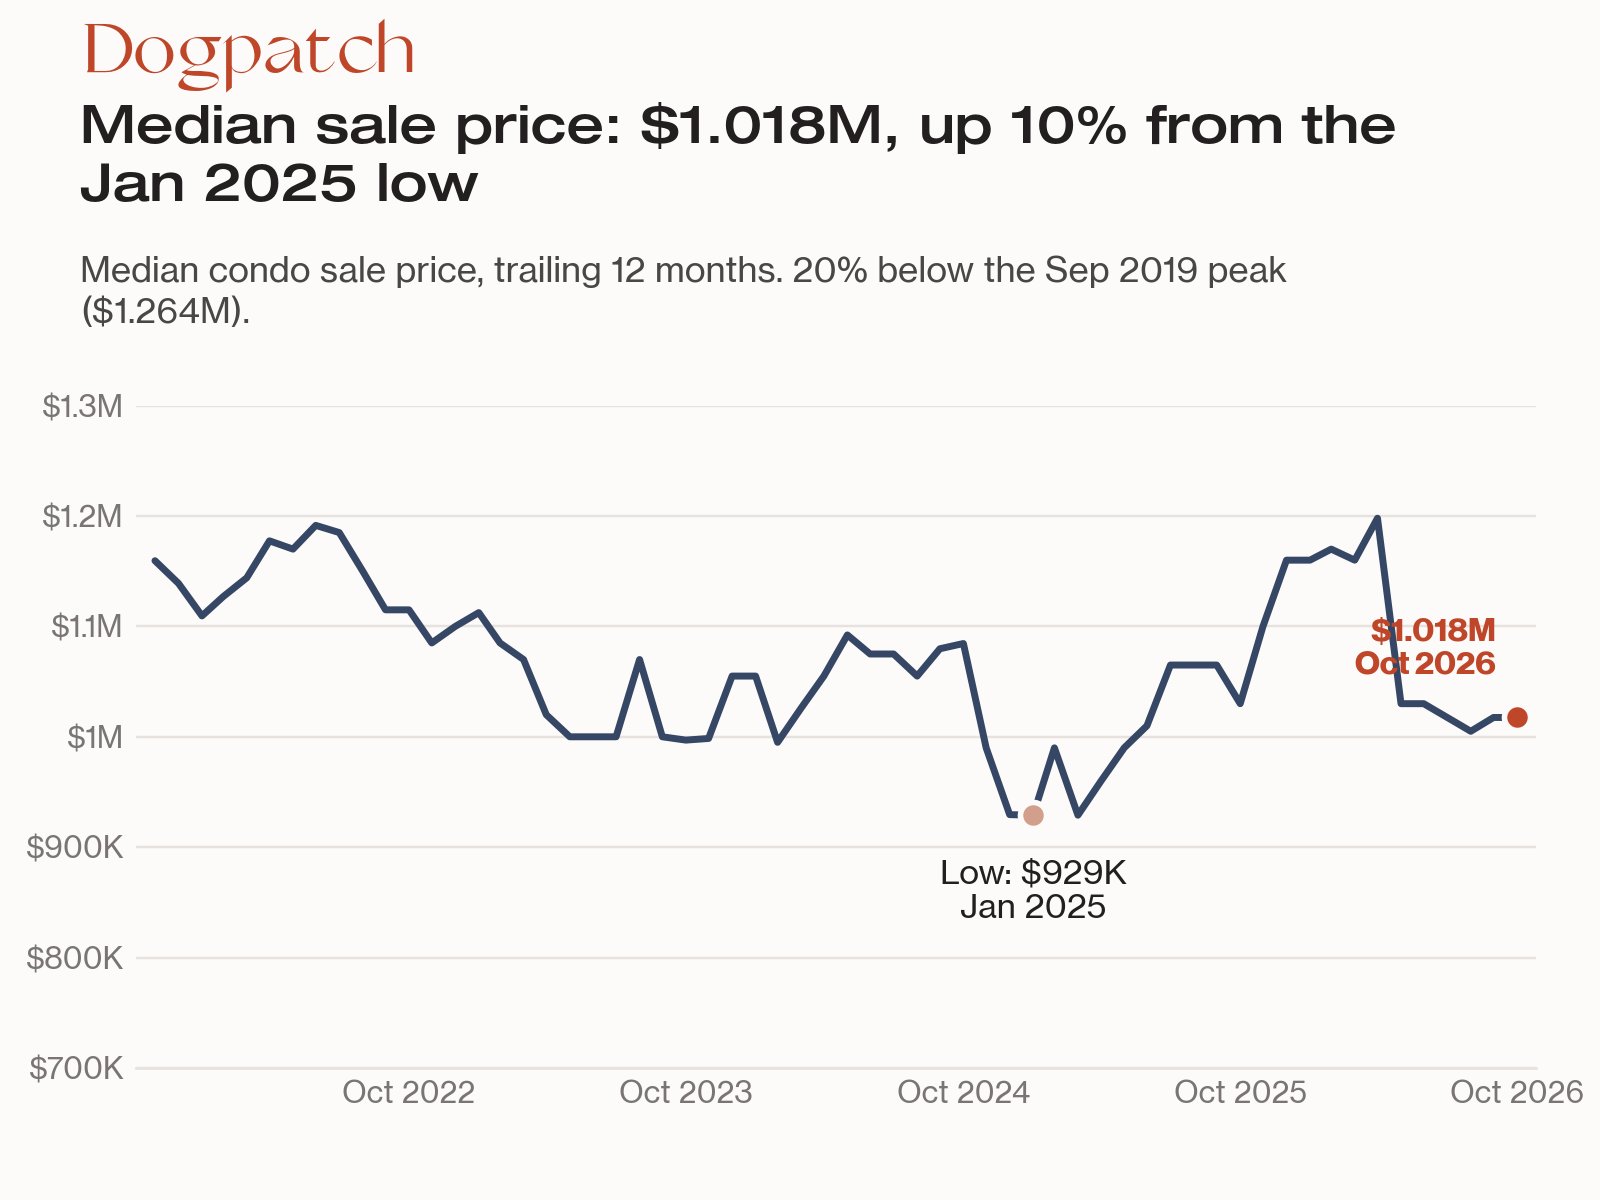
No. The trailing-12-month median of $1,017,500 sits 20% below the September 2019 peak of $1,264,500, and 8% below the $1.1 million median of October 2016. After inflation the gap is wider: Bay Area consumer prices rose about 38% over those ten years, per the Bureau of Labor Statistics, so the median is about 33% lower in today's dollars. Price per square foot tells a different story: $1,150 now versus $923 ten years ago is a 25% gain before inflation, or about 10% lower after it.
The median has risen about 10% from its January 2025 low of $929,000.
What does this mean for Dogpatch condo buyers and sellers?
If you're buying a Dogpatch condo
Our recommendation is to get pre-approved and decide your ceiling before you tour, because condos priced between $850,000 and $1.45 million reached a contract in a median of 8 to 11 days over the last 12 months. Our buying process walks through each step.
- Expect competition between $850,000 and $1.45 million. At least 70% of condos in those tiers sold above asking, so plan to offer on the value, not the list price.
- Talk to a lender about rate locks and buydowns now. The 30-year average was 7.24% on October 29, 2026.
- Look at the listings that have sat. Under $850,000, the median condo took 43 days to reach a contract and 36% needed a price cut.
- Widen the search if you need to. Neighboring Potrero Hill is a natural comparison.
If you're selling a Dogpatch condo
The goal is to price from the most recent sales and use the current pace to your advantage. Our selling process covers preparation and timing, and you can start with a free home valuation.
- Price from current comps. Over the last three months the median price per square foot was $1,223, well above the $1,150 of the full 12 months, so recent sales are a better guide than last year's.
- Prepare before you list. With a median of 7.5 days to contract recently, photography, staging and disclosures should be done before launch. For timing across the city, see our guide to the best time to sell a home in San Francisco.
- Price realistically under $850,000. That tier took 43 days and needed price cuts more often than any other.
What should you watch in the Dogpatch condo market this winter?
Here's the line between what we've measured and what we haven't. Days to contract, the share sold above asking and the rise in price per square foot are well supported by 46 sales. The median sale price and the monthly figures are not: months this small can swing on a single sale.
What we haven't measured is how a 7.24% mortgage rate will affect buyers over the next few months. Contracts are the first place it would show up. We're watching three things:
- Homes going under contract. There were 7 in August through October, compared with 17 in the same months last year, so we'll see whether that gap closes.
- New listings against inventory. New listings are steady at 17, compared with 16, while only 8 condos are for sale today.
- Sale-to-list ratio. The typical Dogpatch condo closed at 101% of its list price over the last 12 months, and 112% in October.
Thinking about a move this winter? Let's look at the data for your building, not the citywide headline. Contact our team and we'll send you a short read on your unit. You can also browse all of our Bay Area market updates, or visit Kinoko Real Estate.
Dogpatch condo market FAQ
How much do condos cost in Dogpatch?
The median Dogpatch condo sold for $1,017,500 over the 12 months through October 2026, about 1% below a year earlier. Price per square foot is the steadier measure: $1,150, up 16%. Two-bedroom condos rose most, from $851 to $1,276 per square foot across 19 recent sales.
How long does it take to sell a condo in Dogpatch?
The median Dogpatch condo went under contract in 12.5 days over the 12 months through October 2026, down from 47.5 days a year earlier. Over the last three months it was 7.5 days. Condos under $850,000 are slower, with a median of 43 days.
Do Dogpatch condos sell above asking price?
Often. Over the 12 months through October 2026, 61% of Dogpatch condos sold above asking, up from 40% a year earlier. The share was highest between $1.05 million and $1.45 million, at 82%, and lowest under $850,000, at 43%.
Is Dogpatch a buyer's or seller's market?
Balanced. Dogpatch had 3.0 months of supply in October 2026, based on average sales over three months. Under 3 favors sellers, 3 to 6 is balanced and over 6 favors buyers. Eight condos were for sale, and supply was below one month this spring.
Sources
- Kinoko Real Estate analysis of San Francisco Association of Realtors (SFAR) MLS data, Dogpatch (Central Waterfront) condominiums, through October 30, 2026. Retrieved October 30, 2026.
- Freddie Mac, "Mortgage Rates" (Primary Mortgage Market Survey), freddiemac.com/pmms, rate of 7.24% as of October 29, 2026. Retrieved October 30, 2026.
- U.S. Bureau of Labor Statistics, "Consumer Price Index for All Urban Consumers (CPI-U), San Francisco-Oakland-Hayward, all items," series CUURS49BSA0, data.bls.gov. Retrieved October 30, 2026.
Kevin Gueco | CA DRE #01461677