Bay Area Real Estate - May 2026 Market Report

Bay Area Real Estate - May 2026 Market Report

The Local Lowdown

Quick Take:

  • San Francisco continues to lead the Bay Area with double-digit price appreciation in both single-family homes and condos, while prices across Silicon Valley and the western North Bay are also gaining ground.
  • Inventory levels remain well below last year across the entire region, with year-over-year declines ranging from 12% in Silicon Valley to nearly 37% in the North Bay and close to 40% in San Francisco.
  • Single-family homes are selling at an incredibly fast clip, with listings in Santa Clara County moving in just 9 days and San Francisco homes routinely selling for more than 20% over asking price.
  • The condo market has become a buyer's market in several East Bay and North Bay counties, creating a stark contrast with the fiercely competitive single-family home market.

Note: You can find the charts/graphs for the Local Lowdown at the end of this section.

San Francisco shatters records while much of the Bay Area posts steady gains

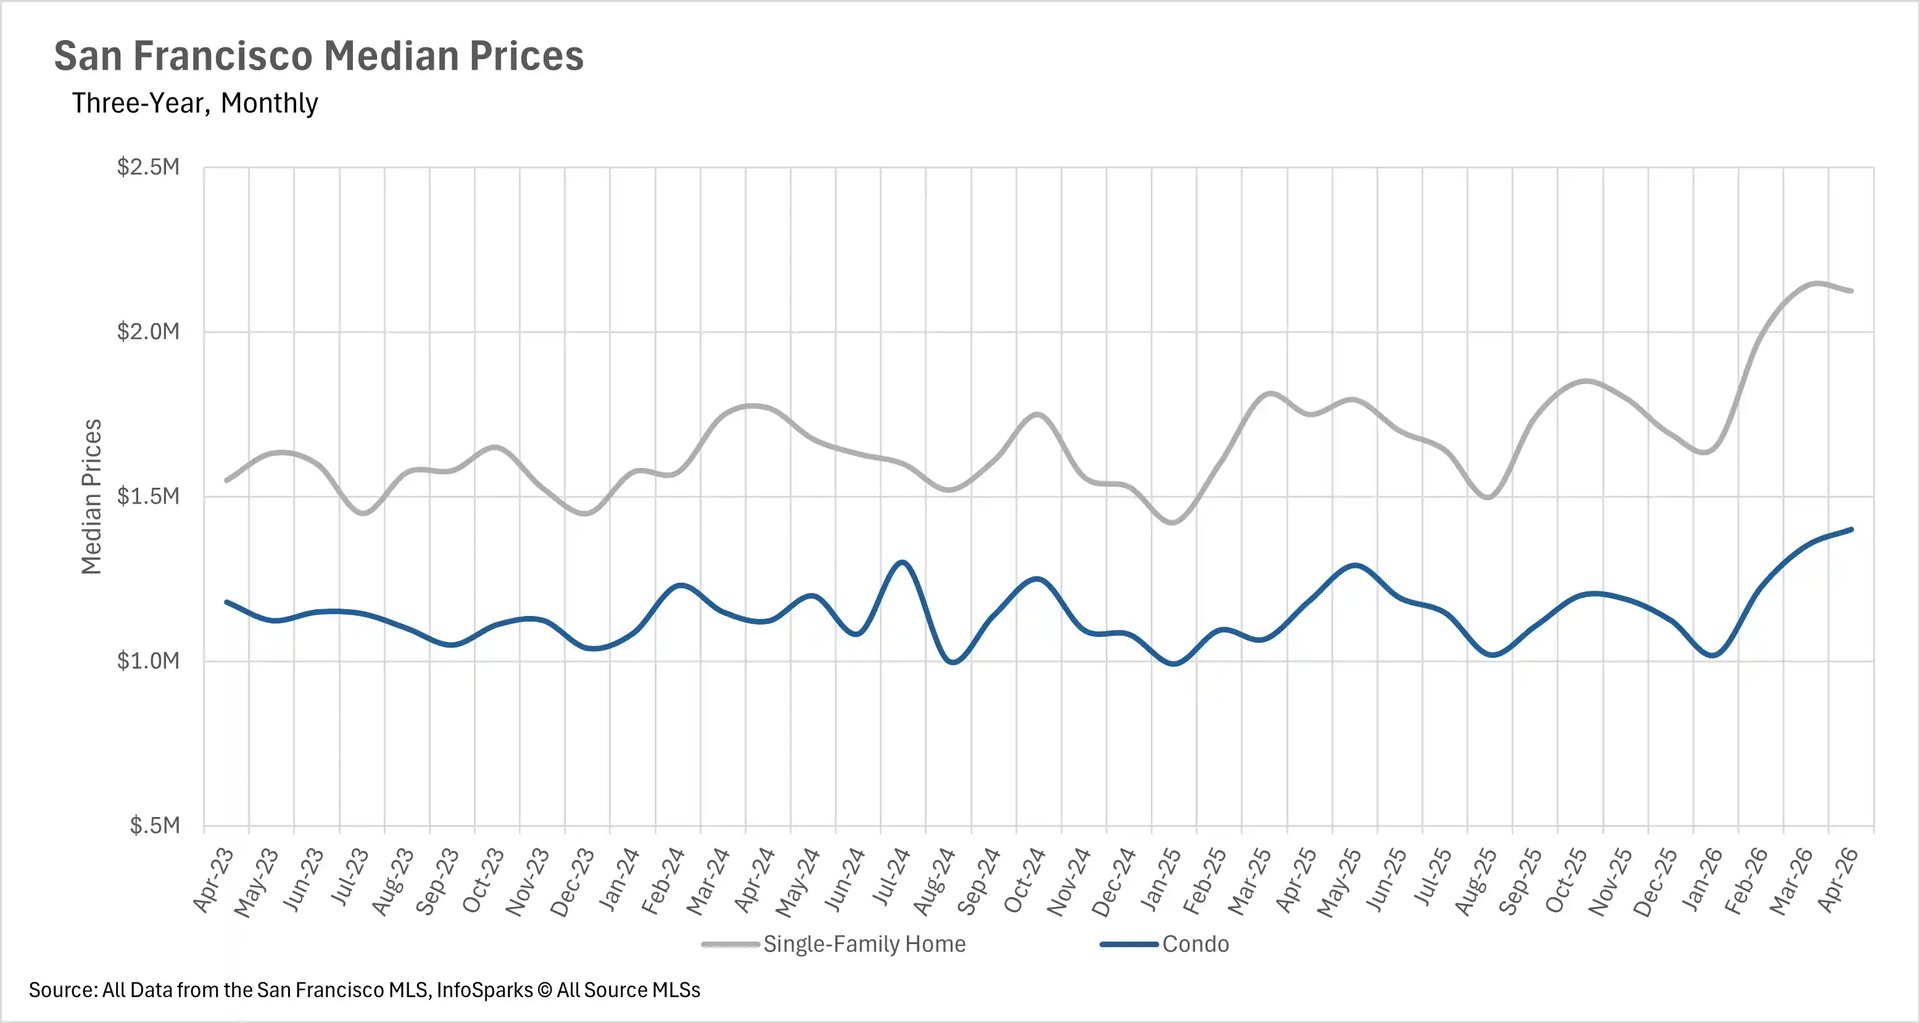
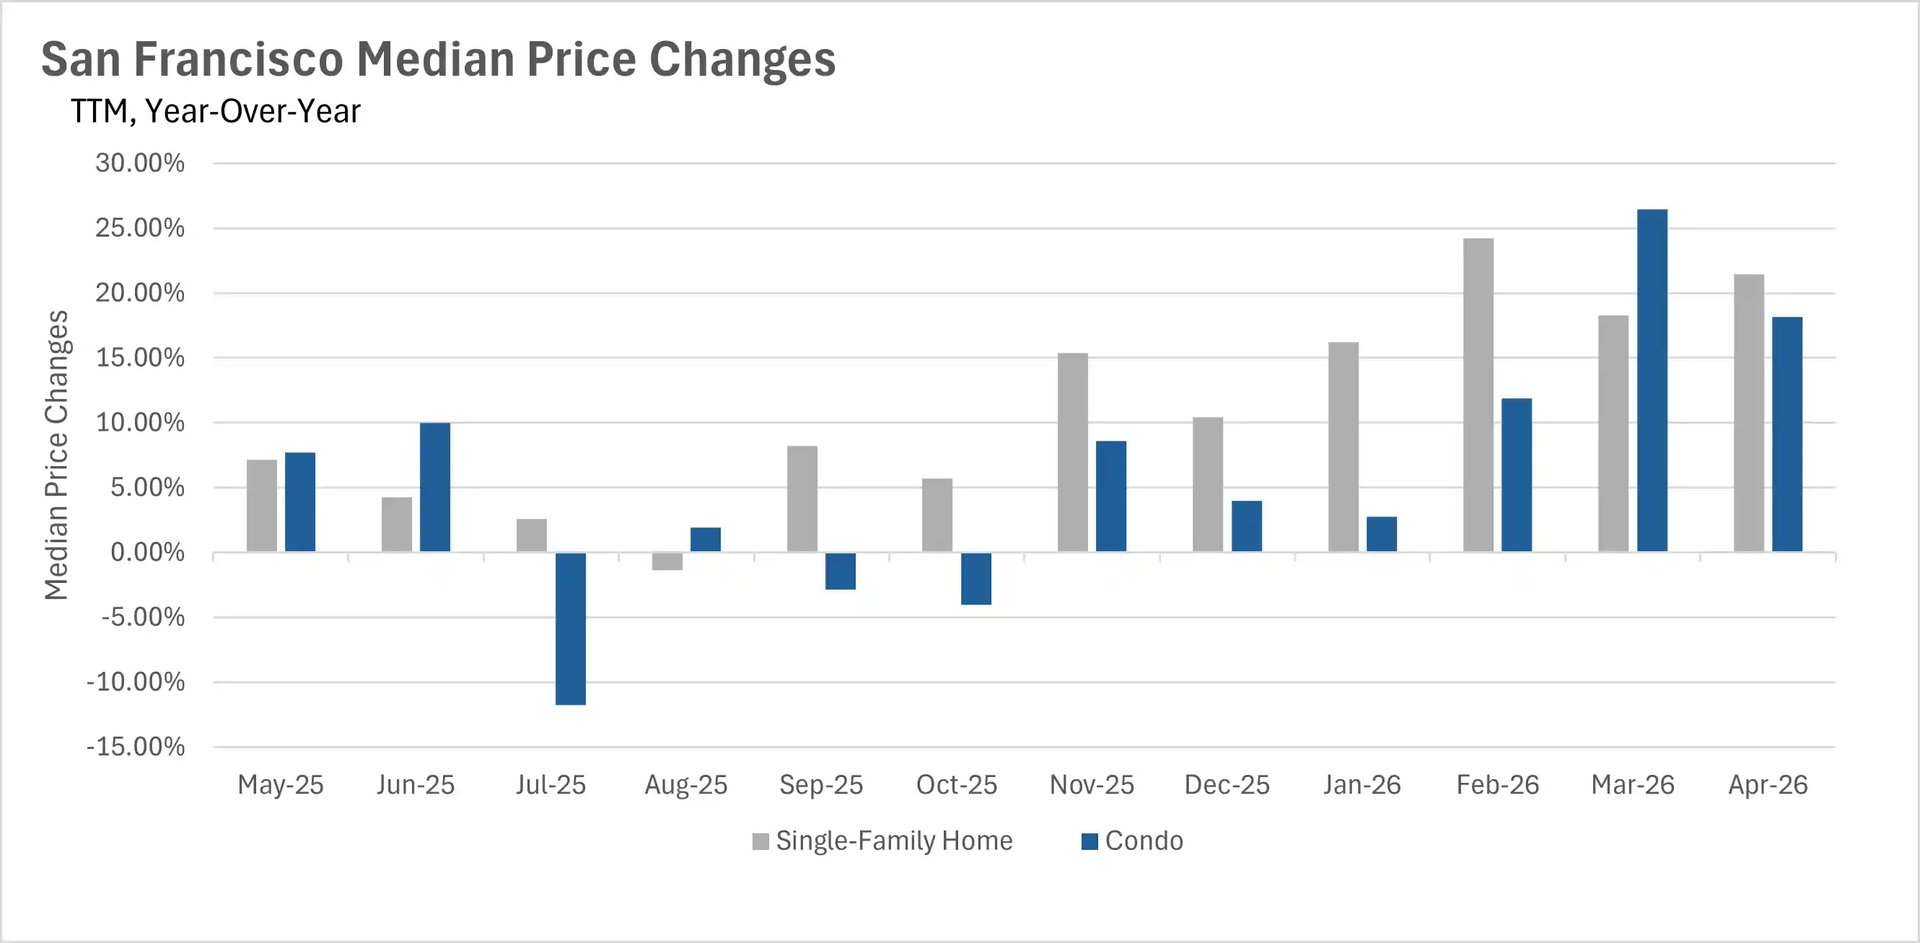
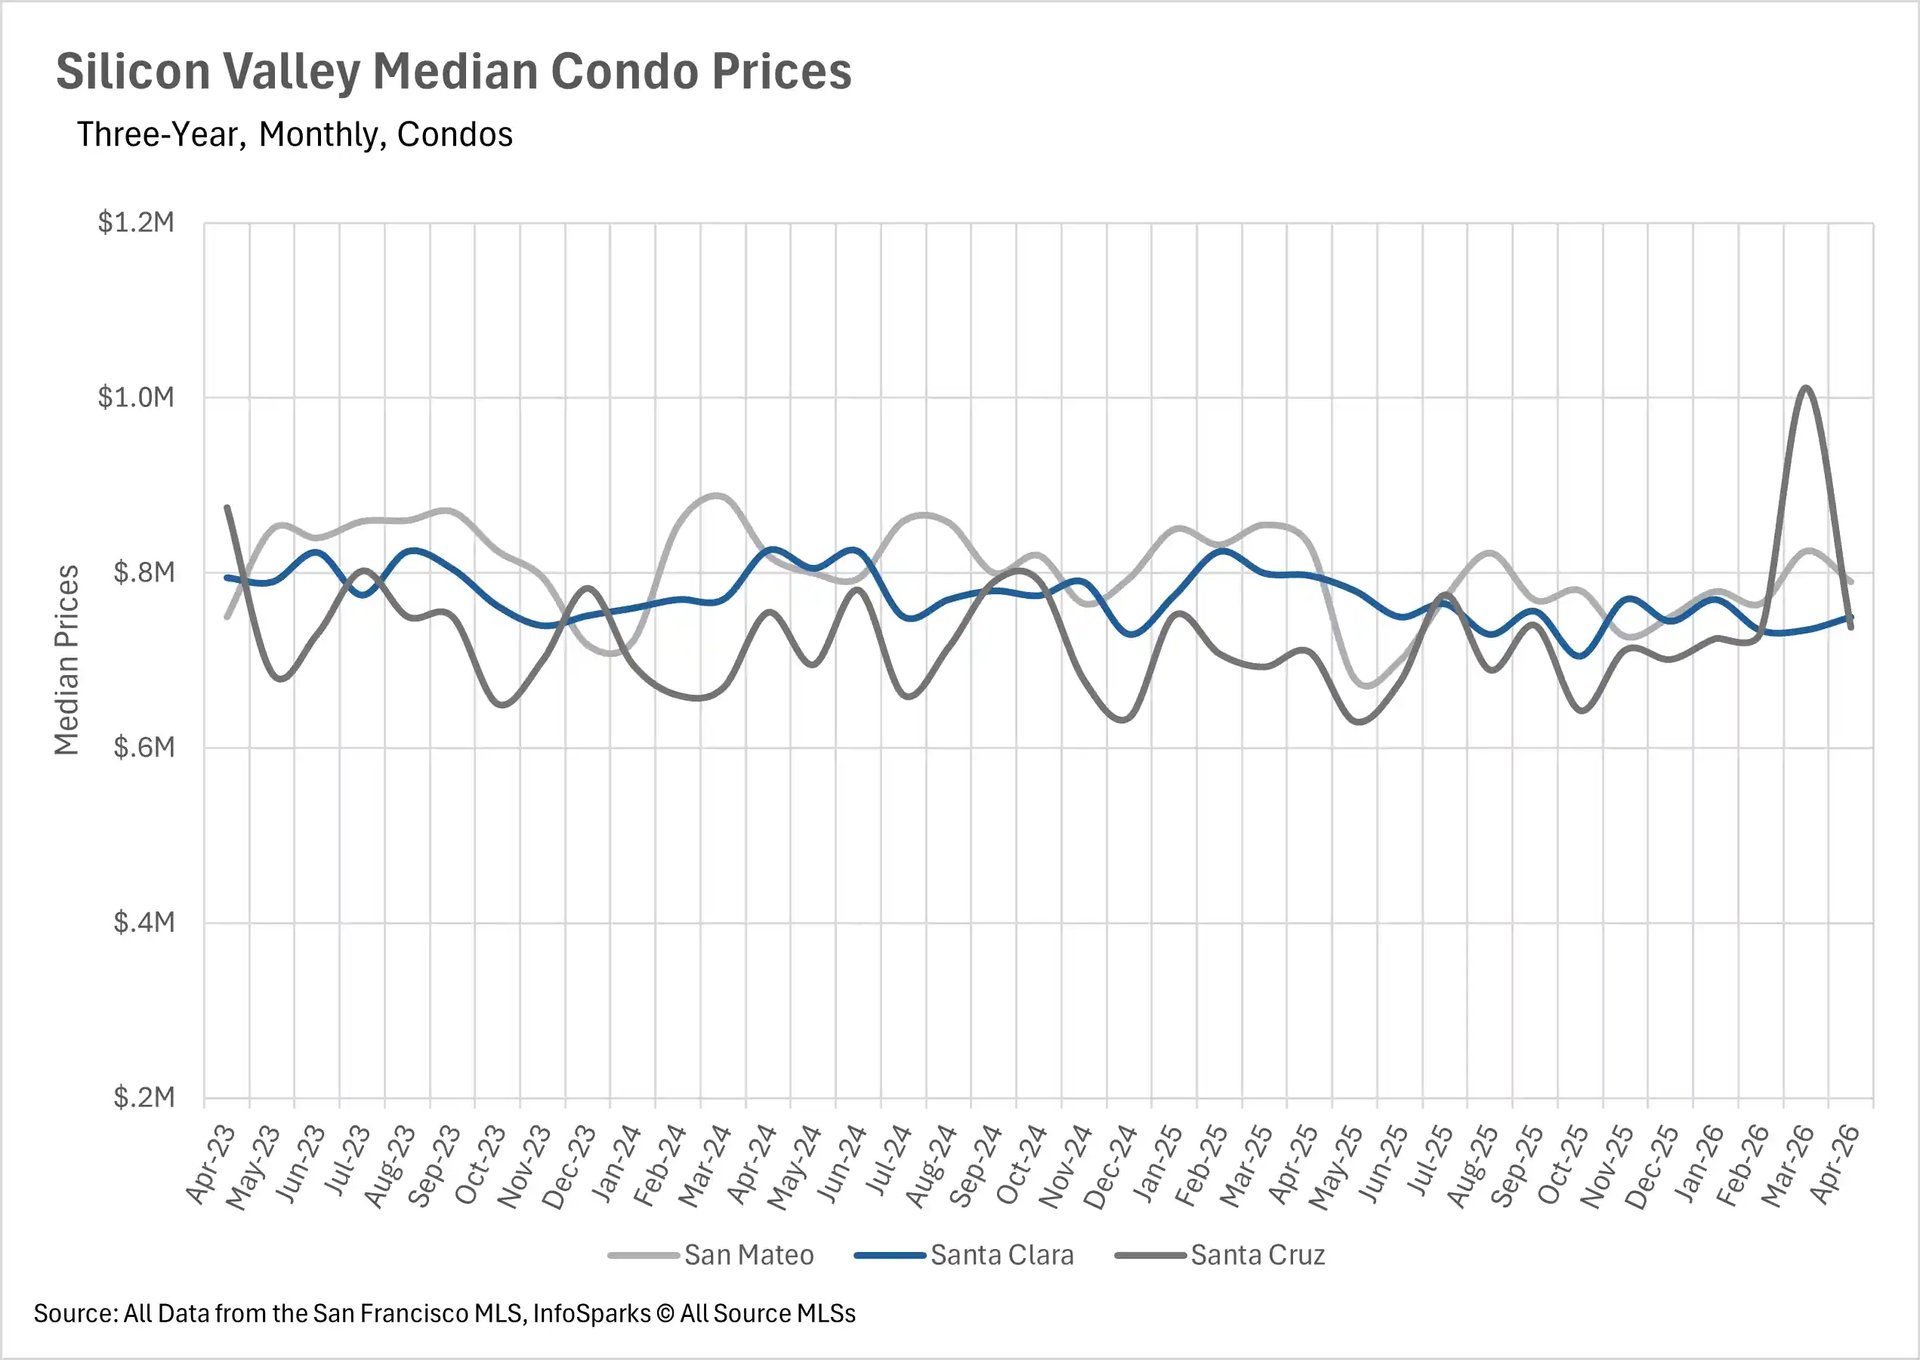
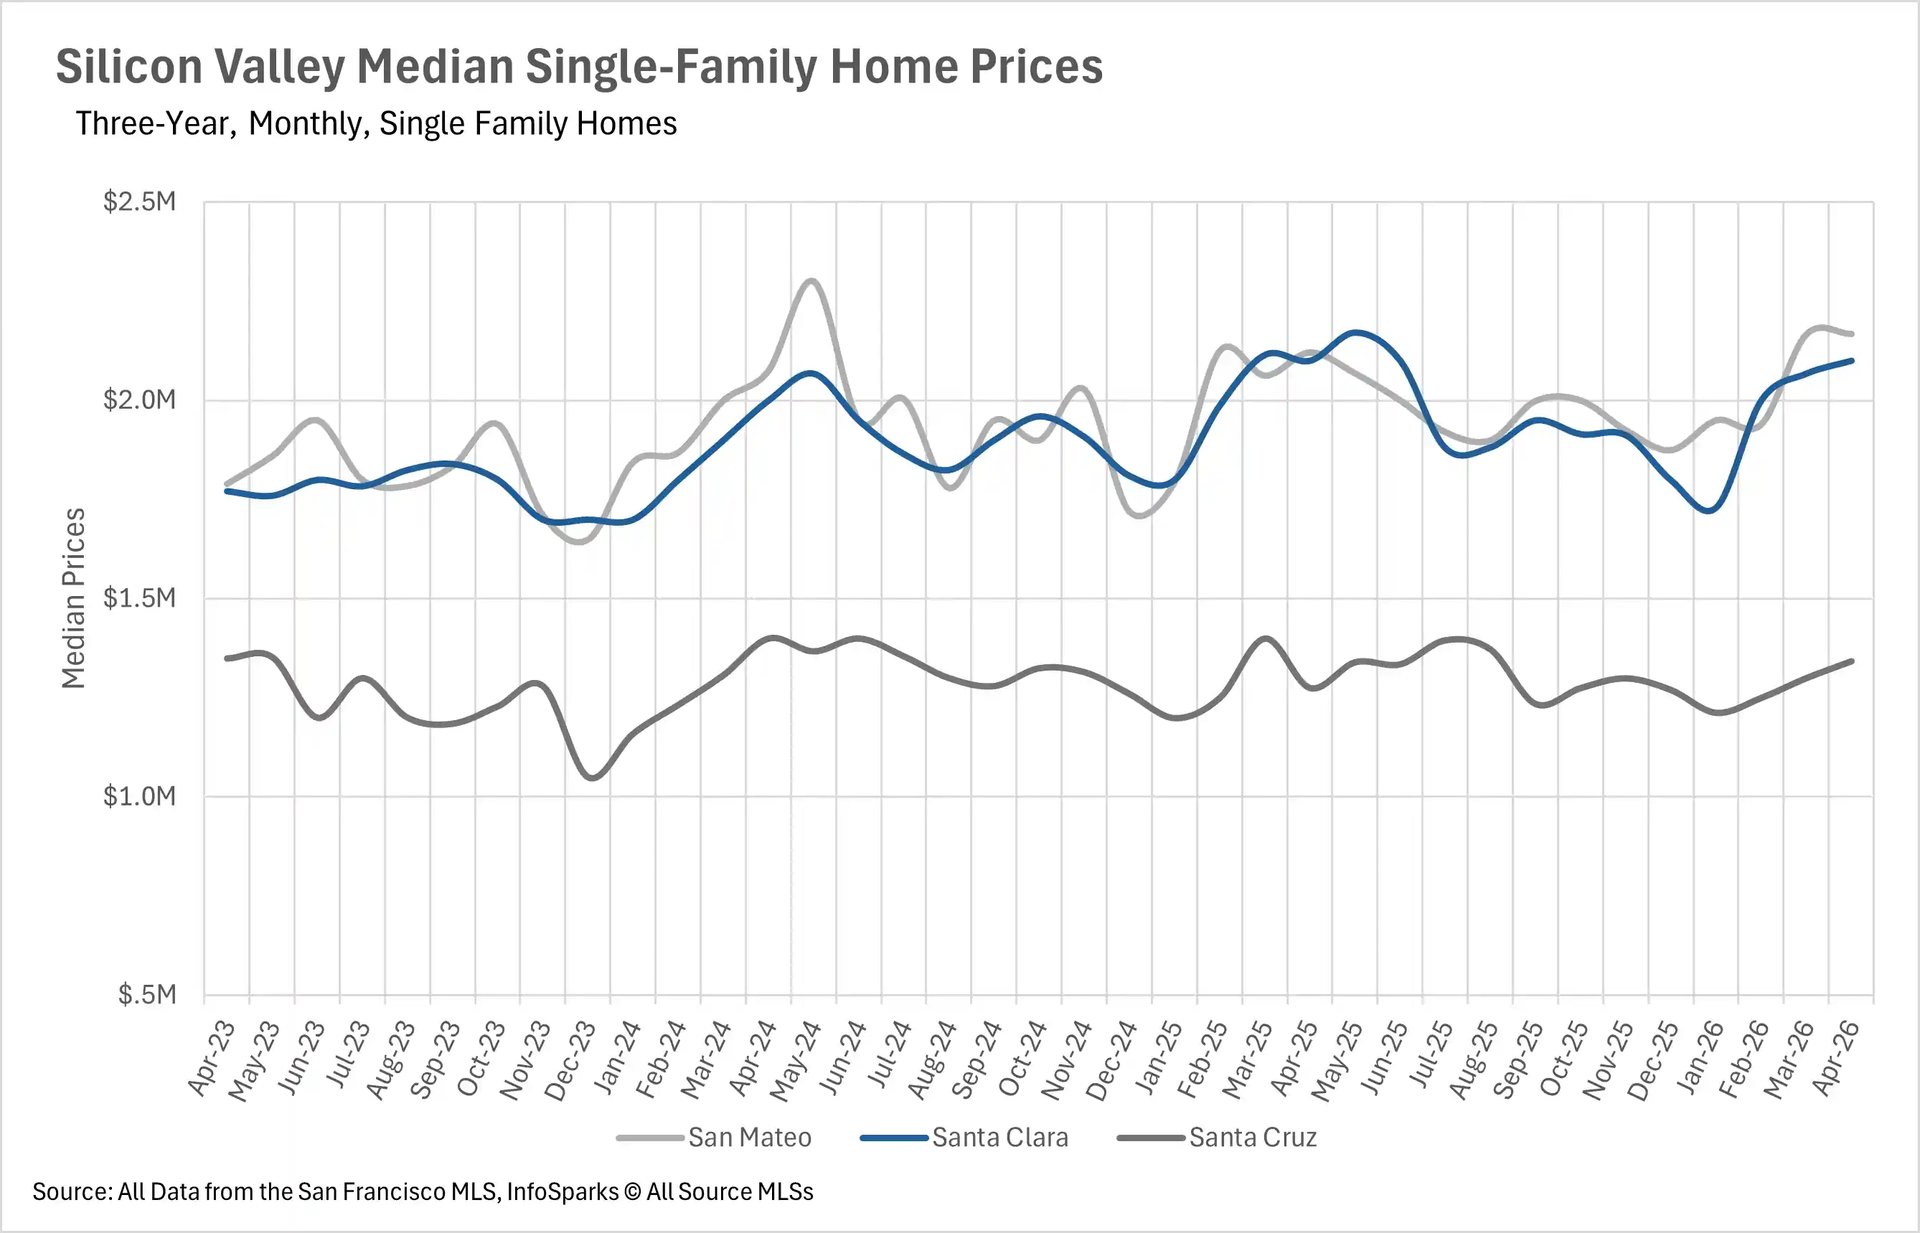
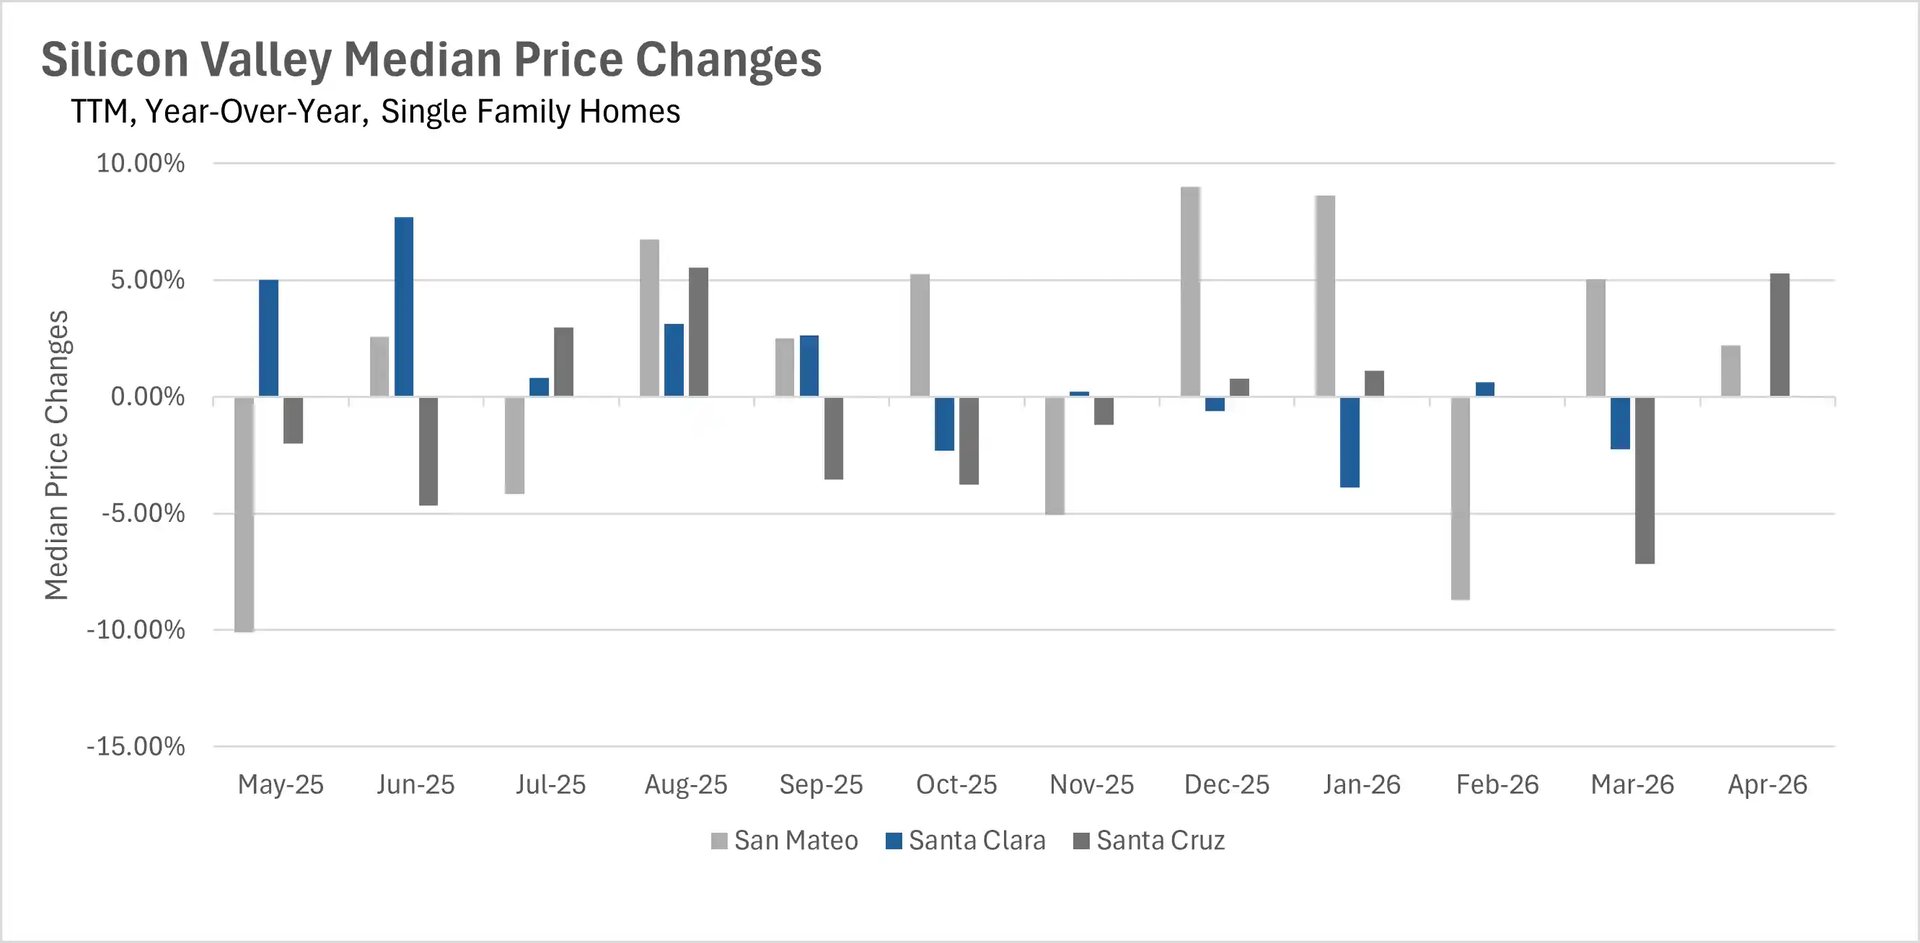
April brought another month of remarkable price appreciation to San Francisco, with single-family homes climbing 21.43% year-over-year to a median sale price of $2,125,000 and condos surging 18.14% to $1,400,000. These double-digit gains have become the norm in San Francisco, where competition for homes remains at a fever pitch. Across Silicon Valley, prices moved in a positive direction as well, with San Mateo County single-family homes up 2.19% to $2,167,500 and Santa Cruz County posting a 5.29% gain to $1,342,500, while Santa Clara County held perfectly steady at $2,100,000.

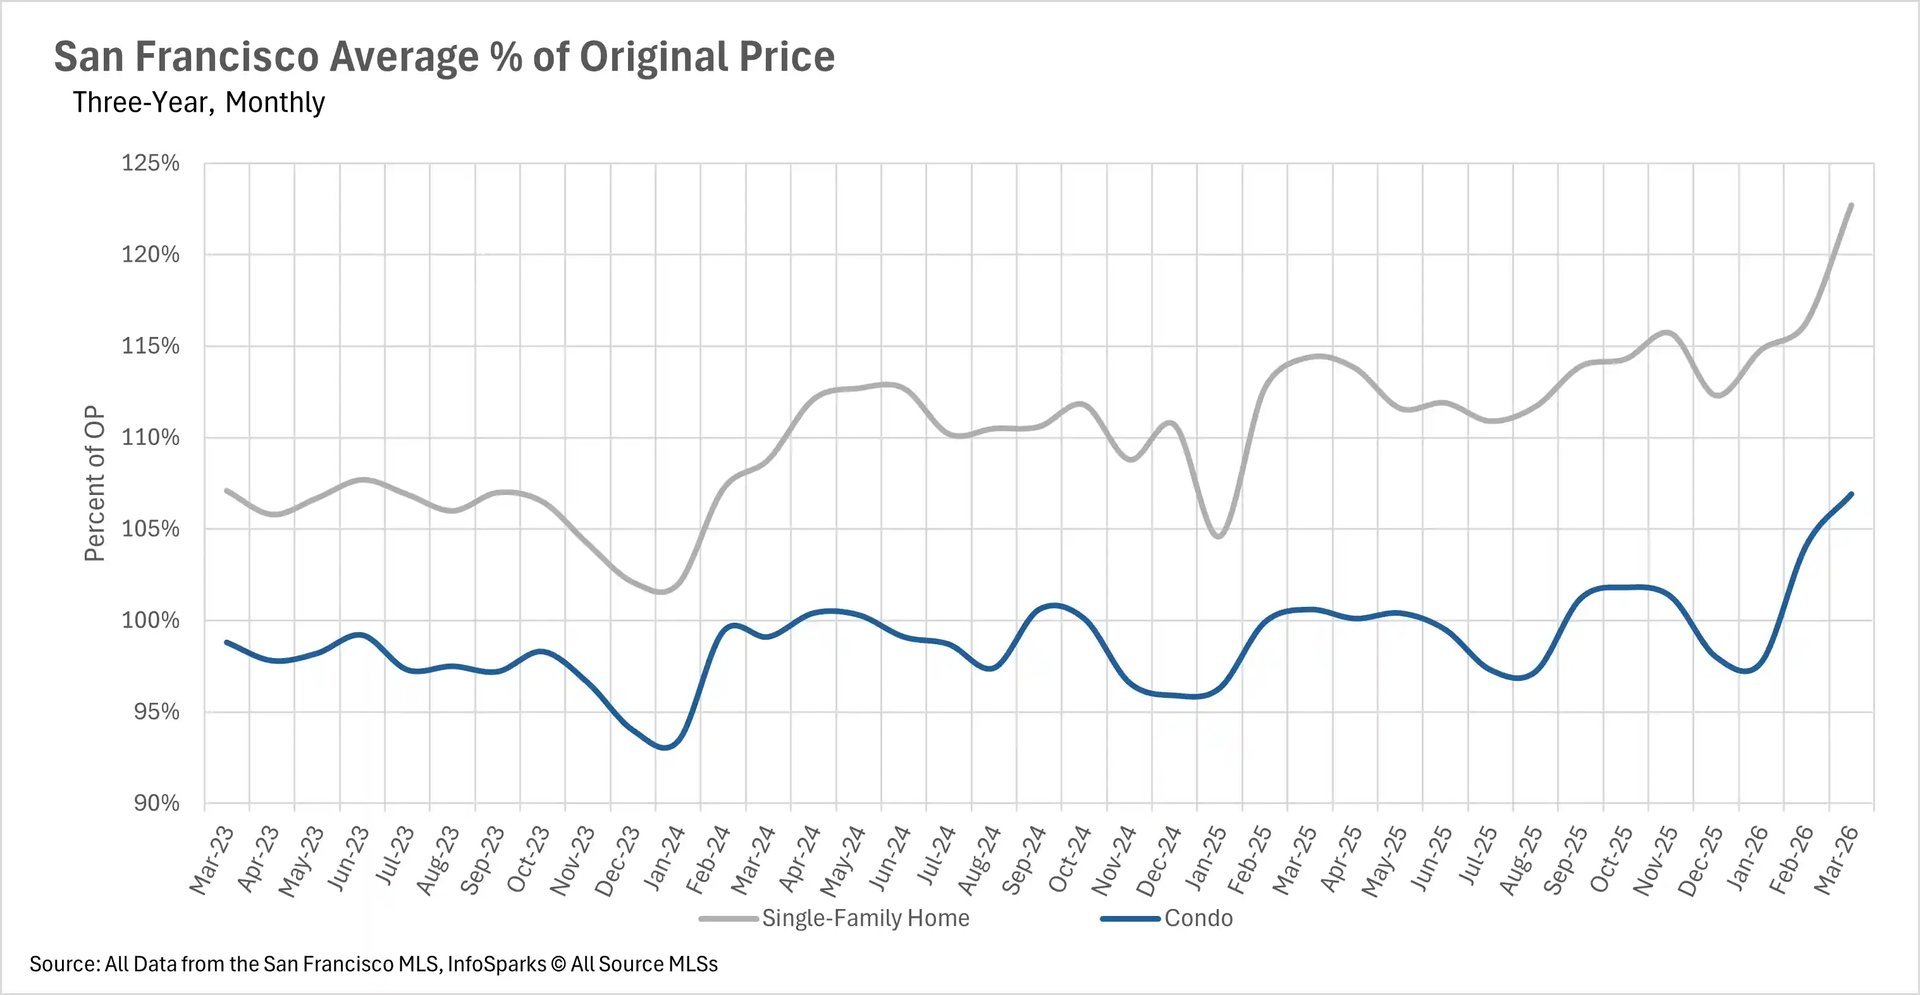
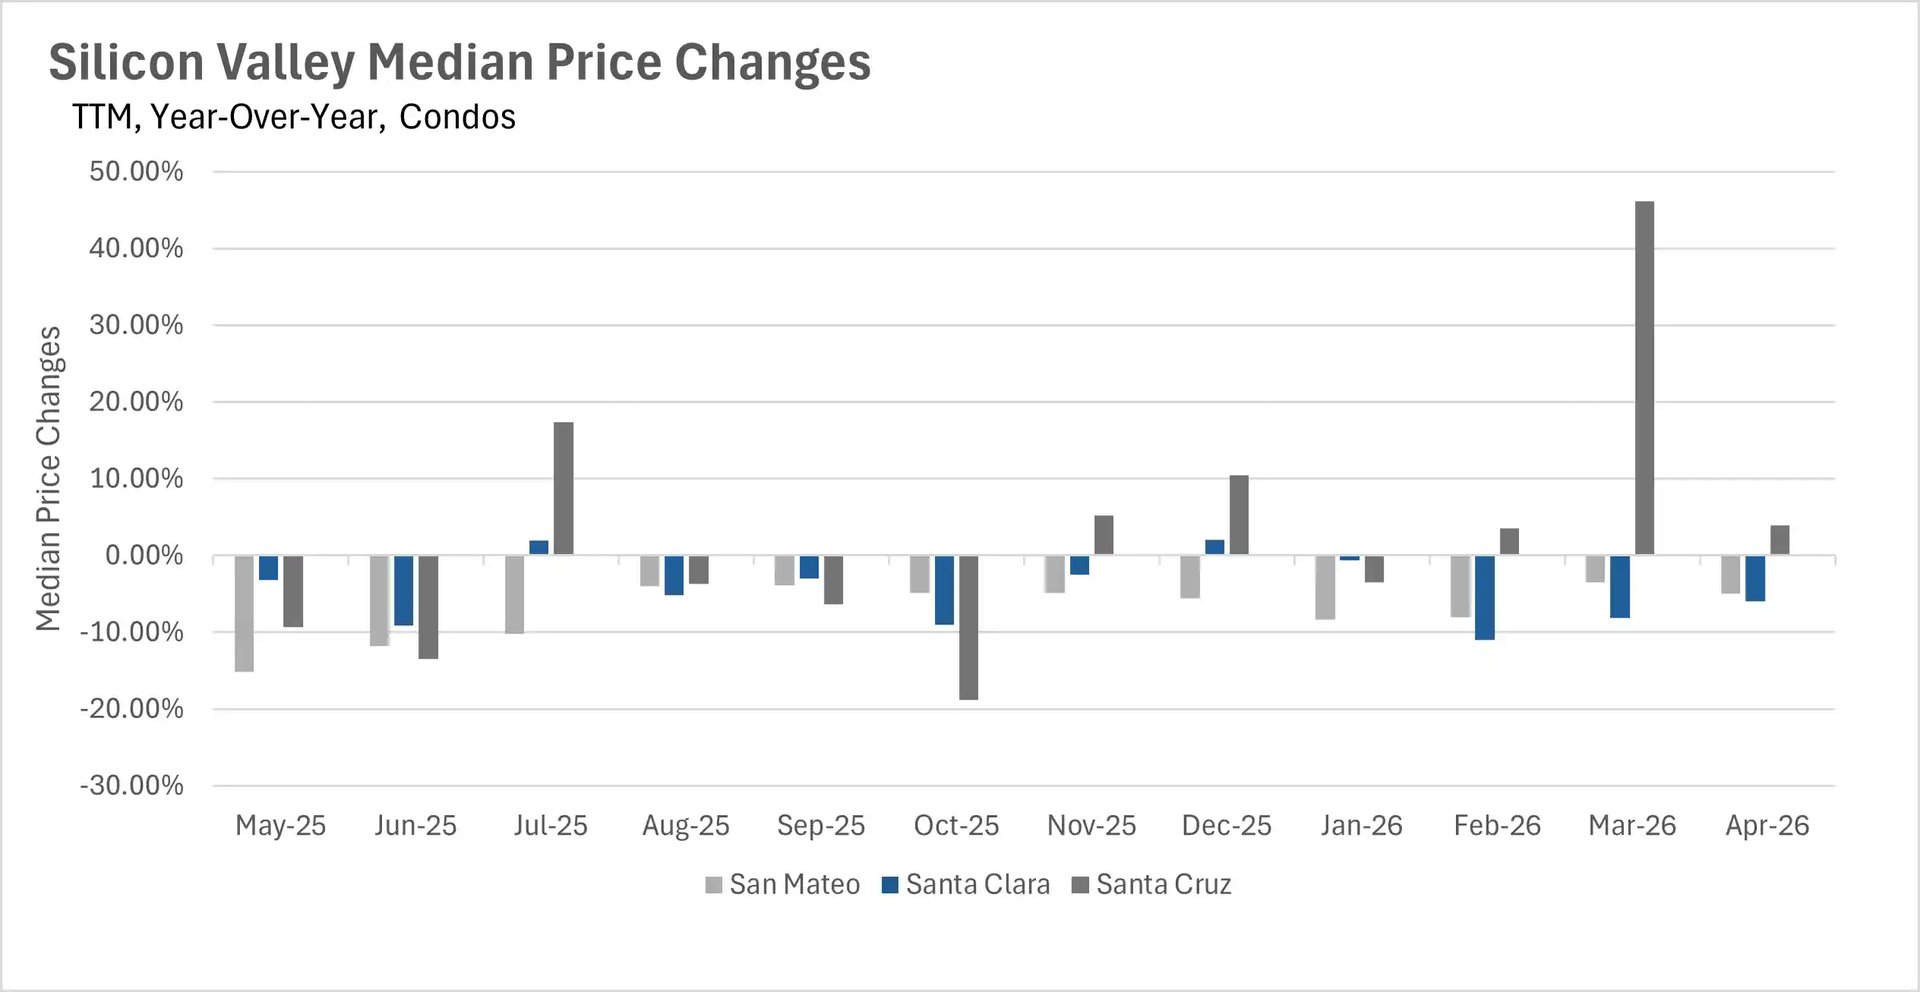
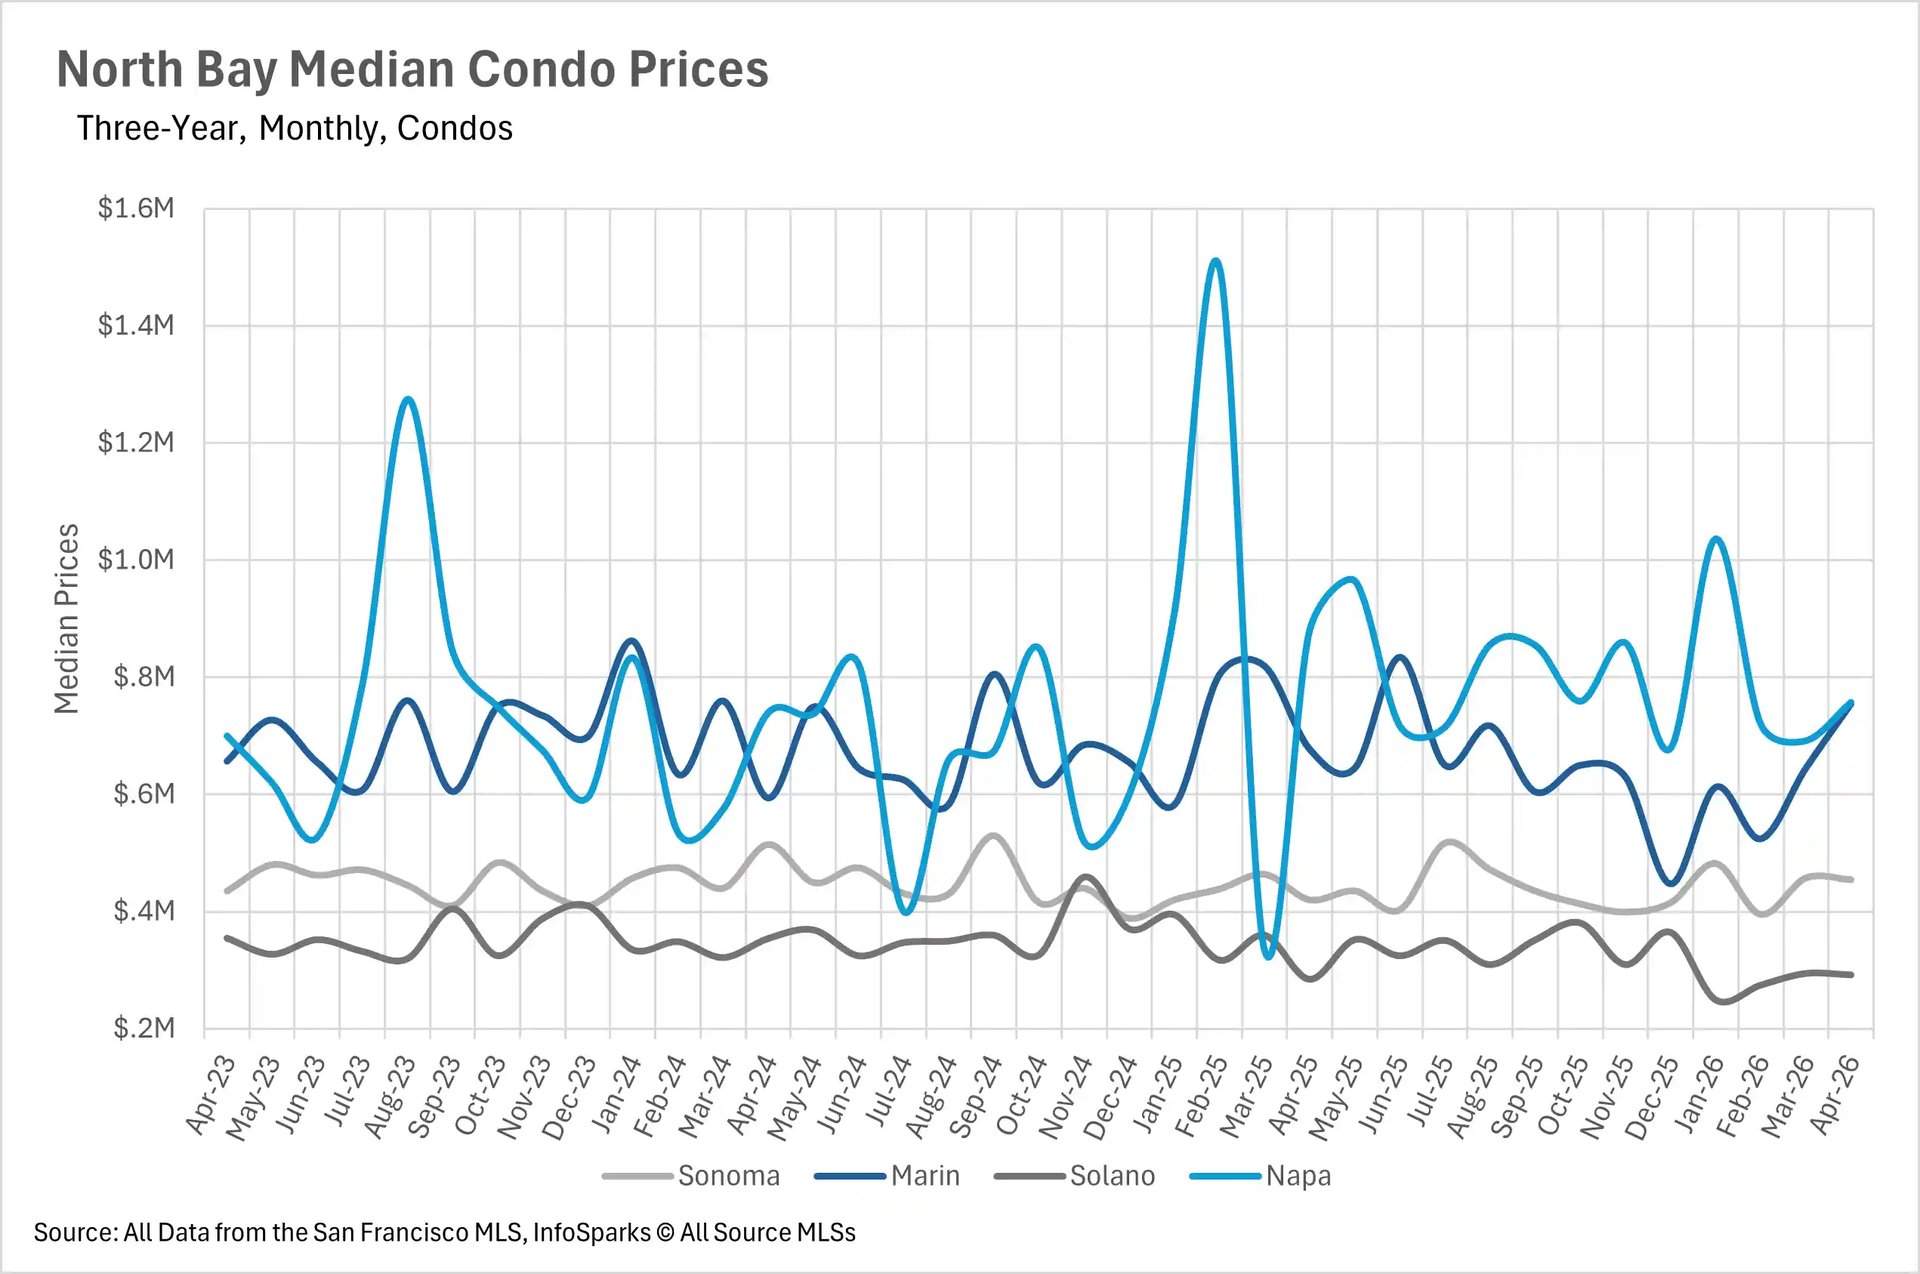
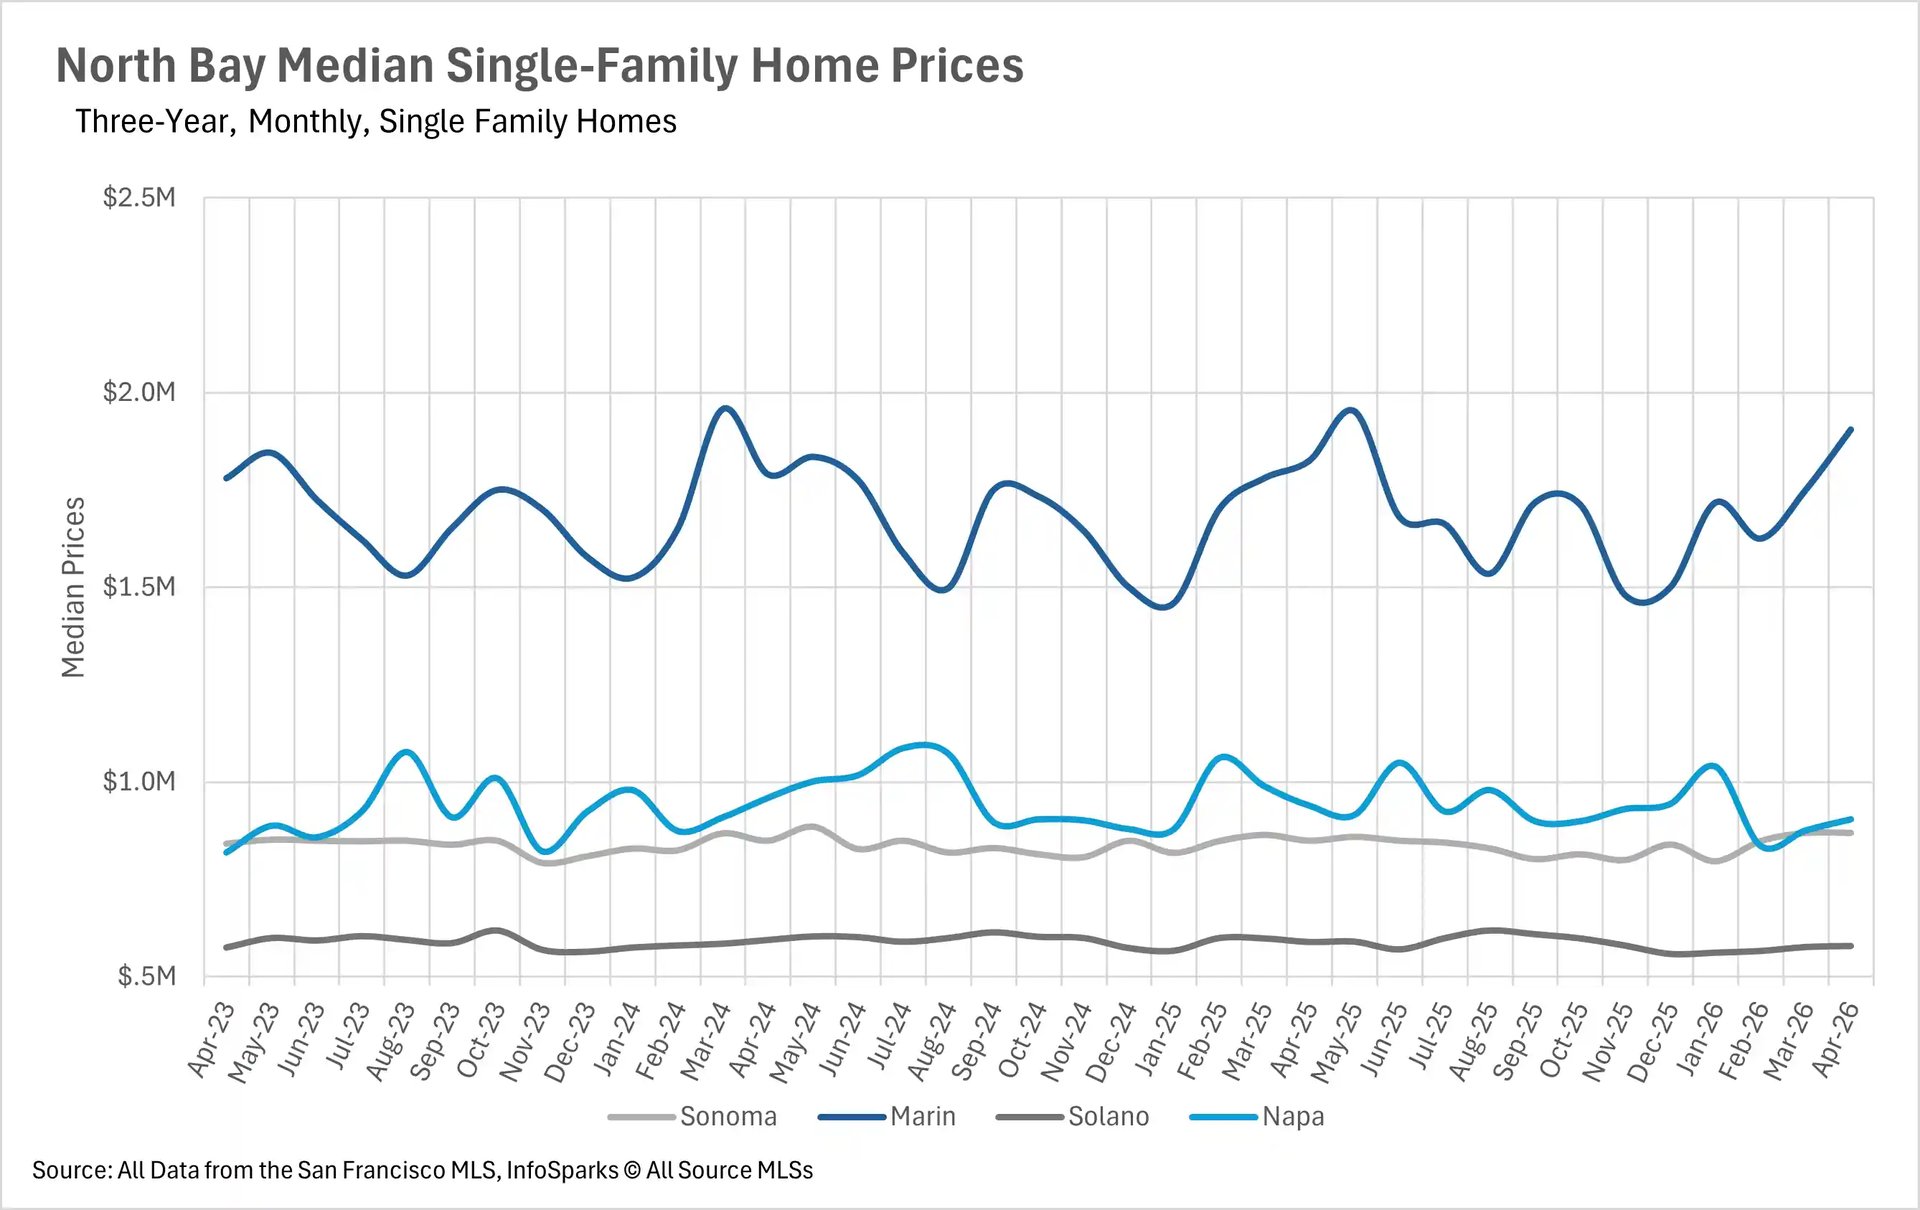
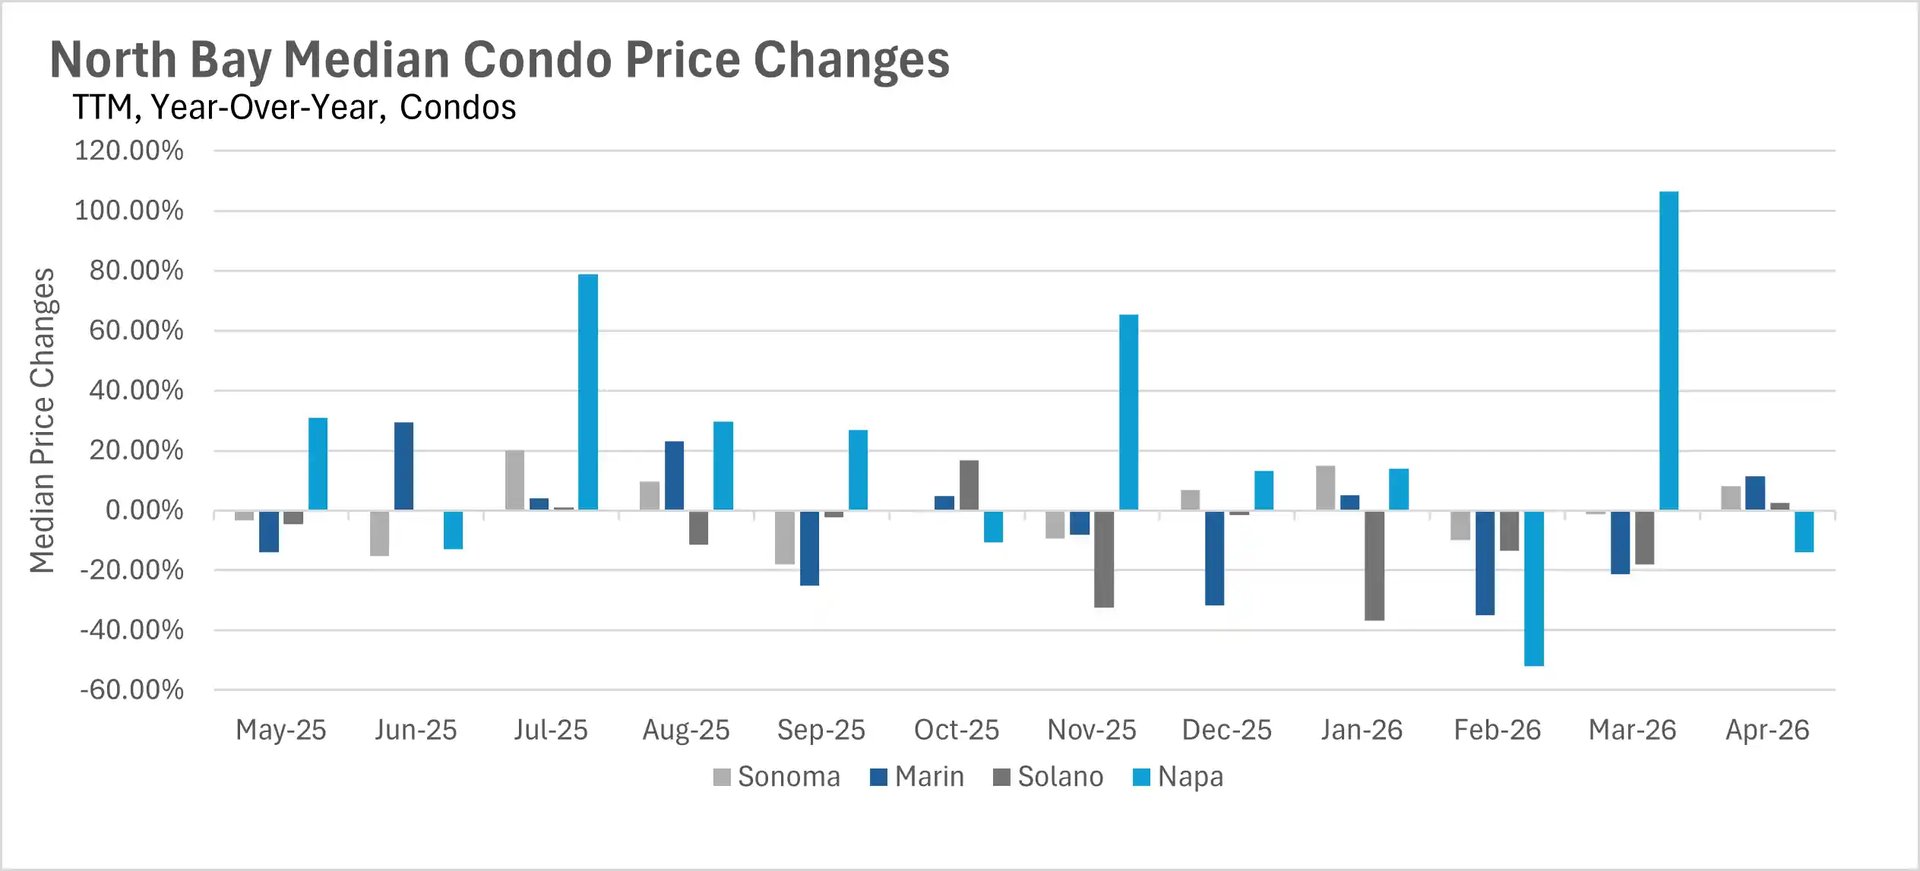
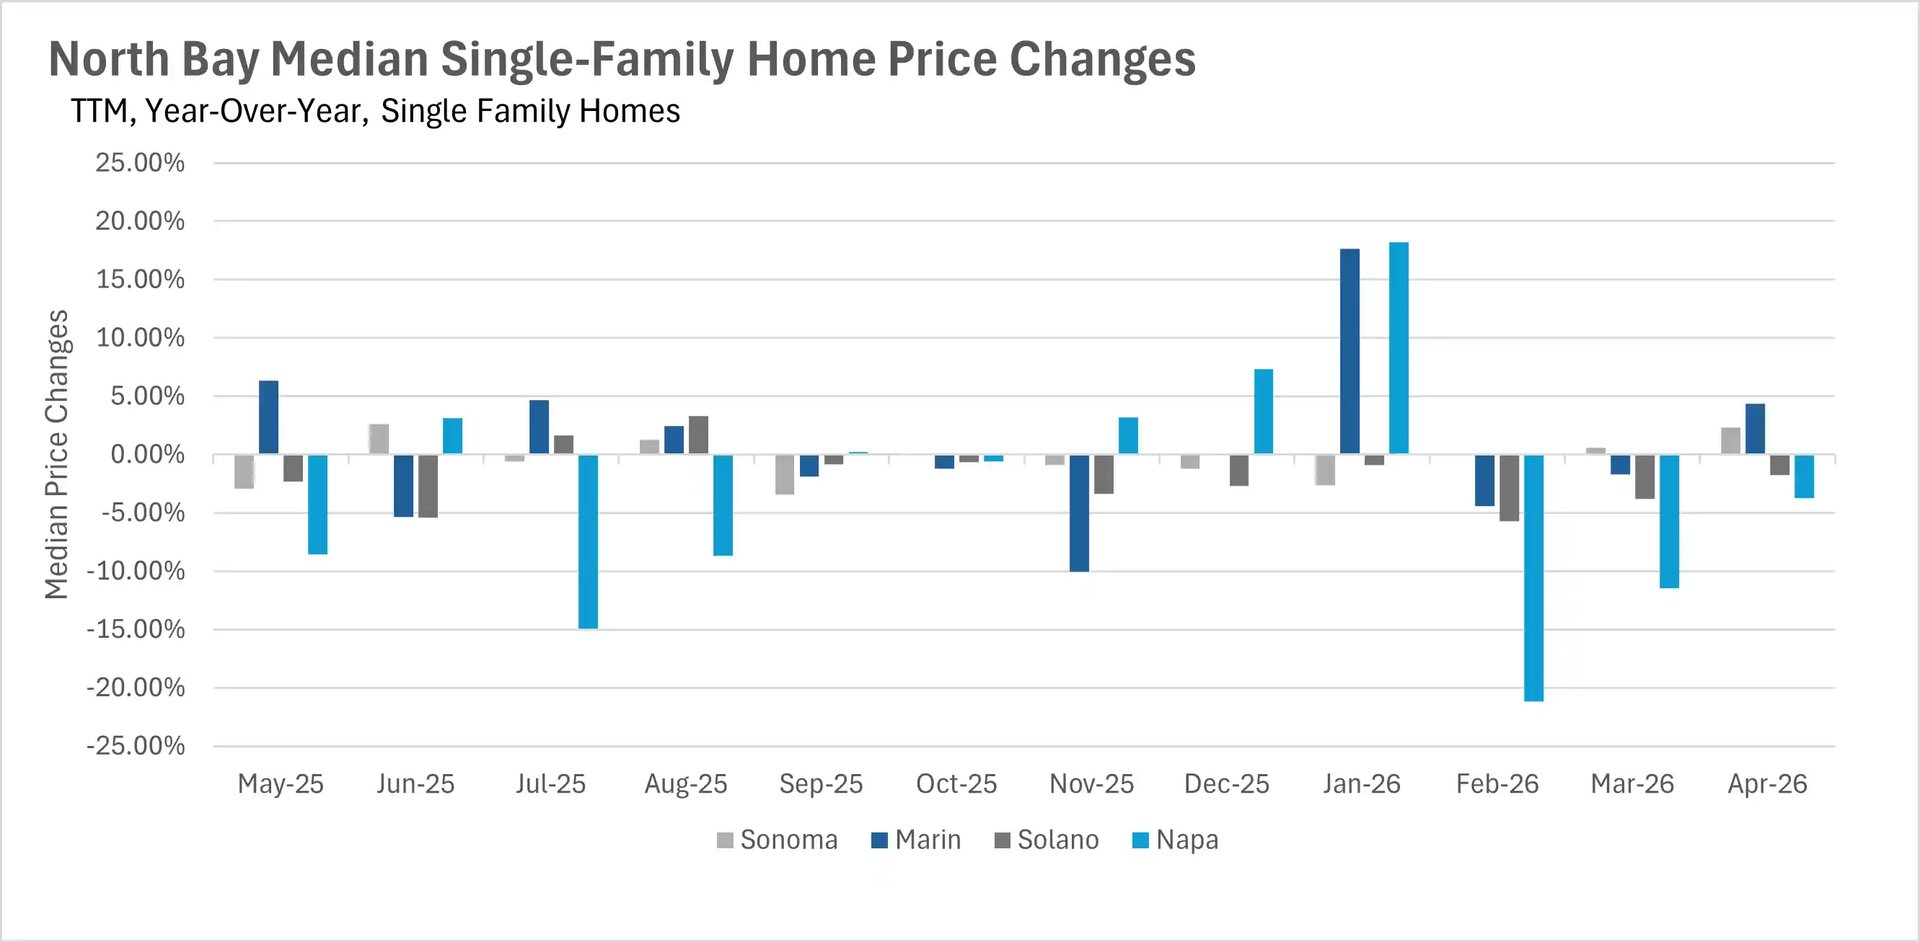
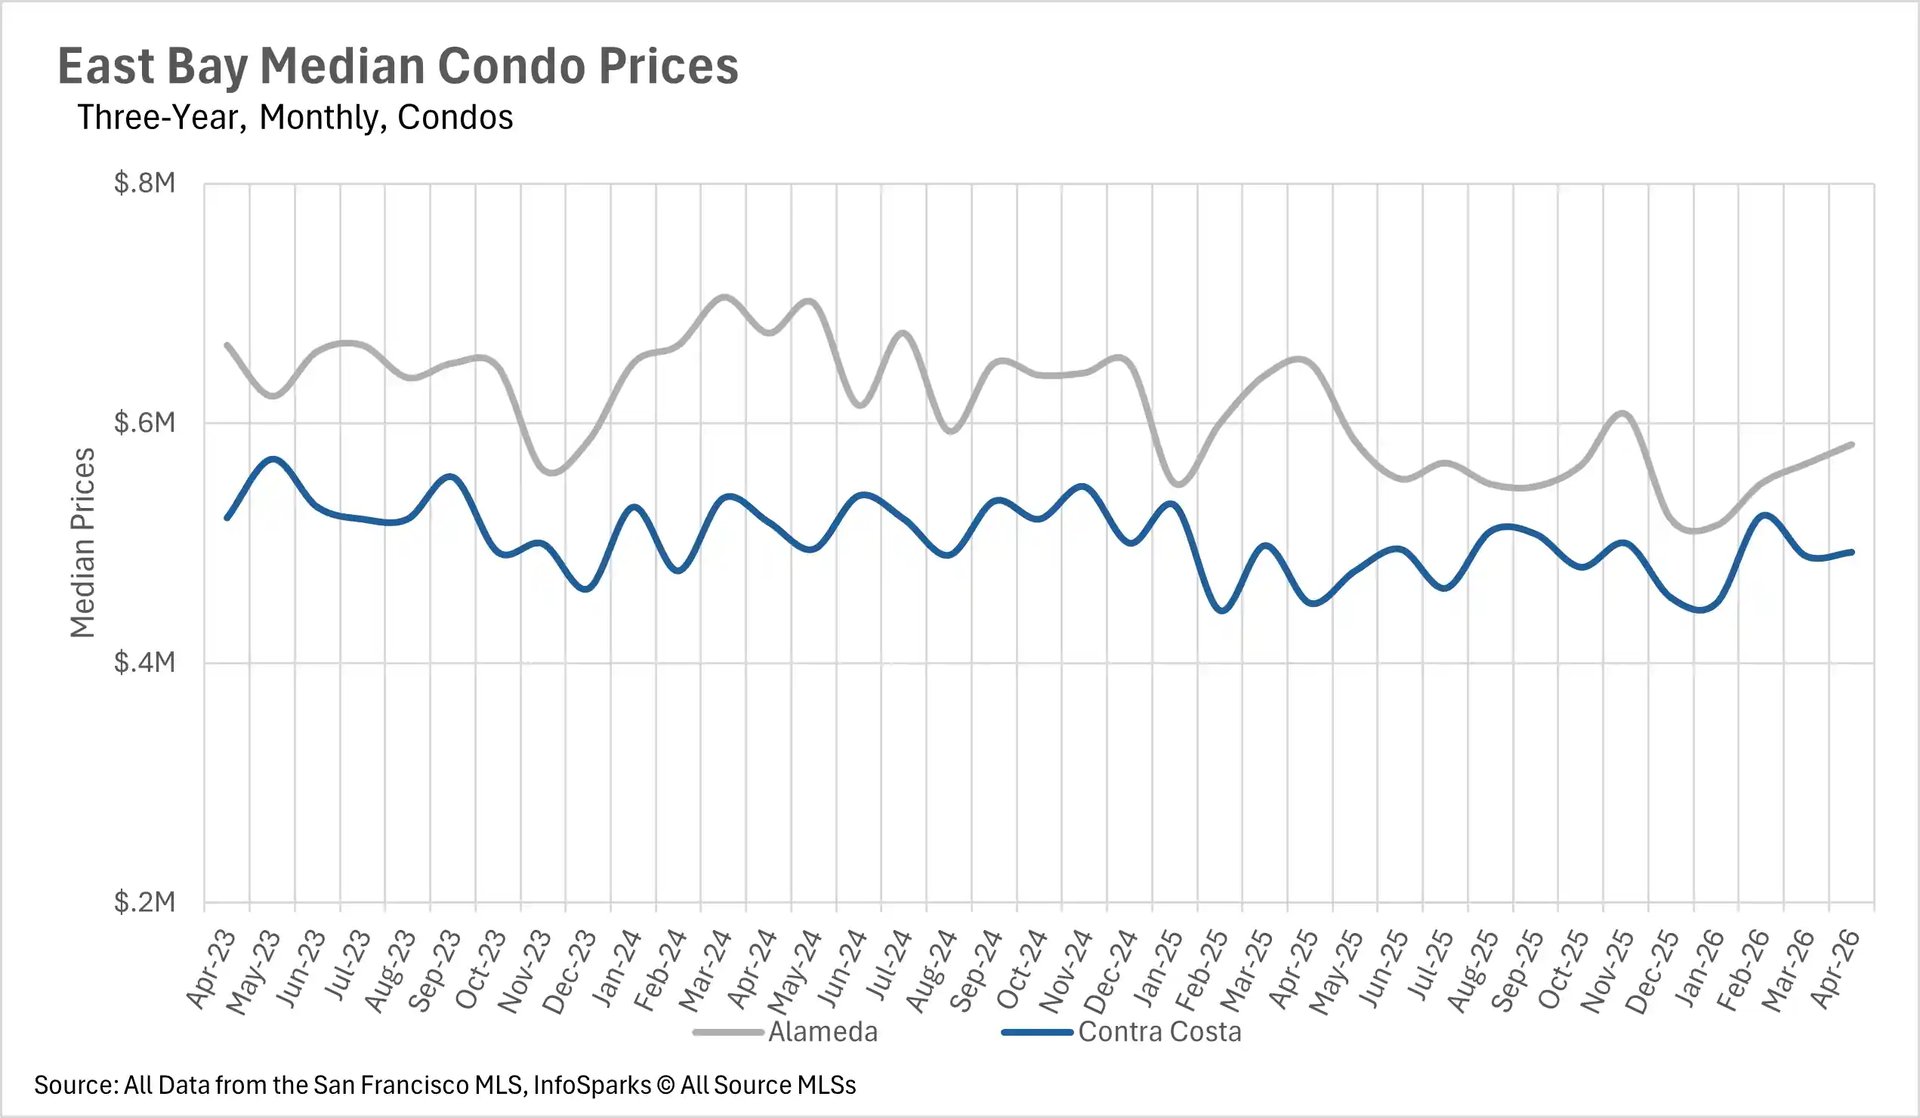
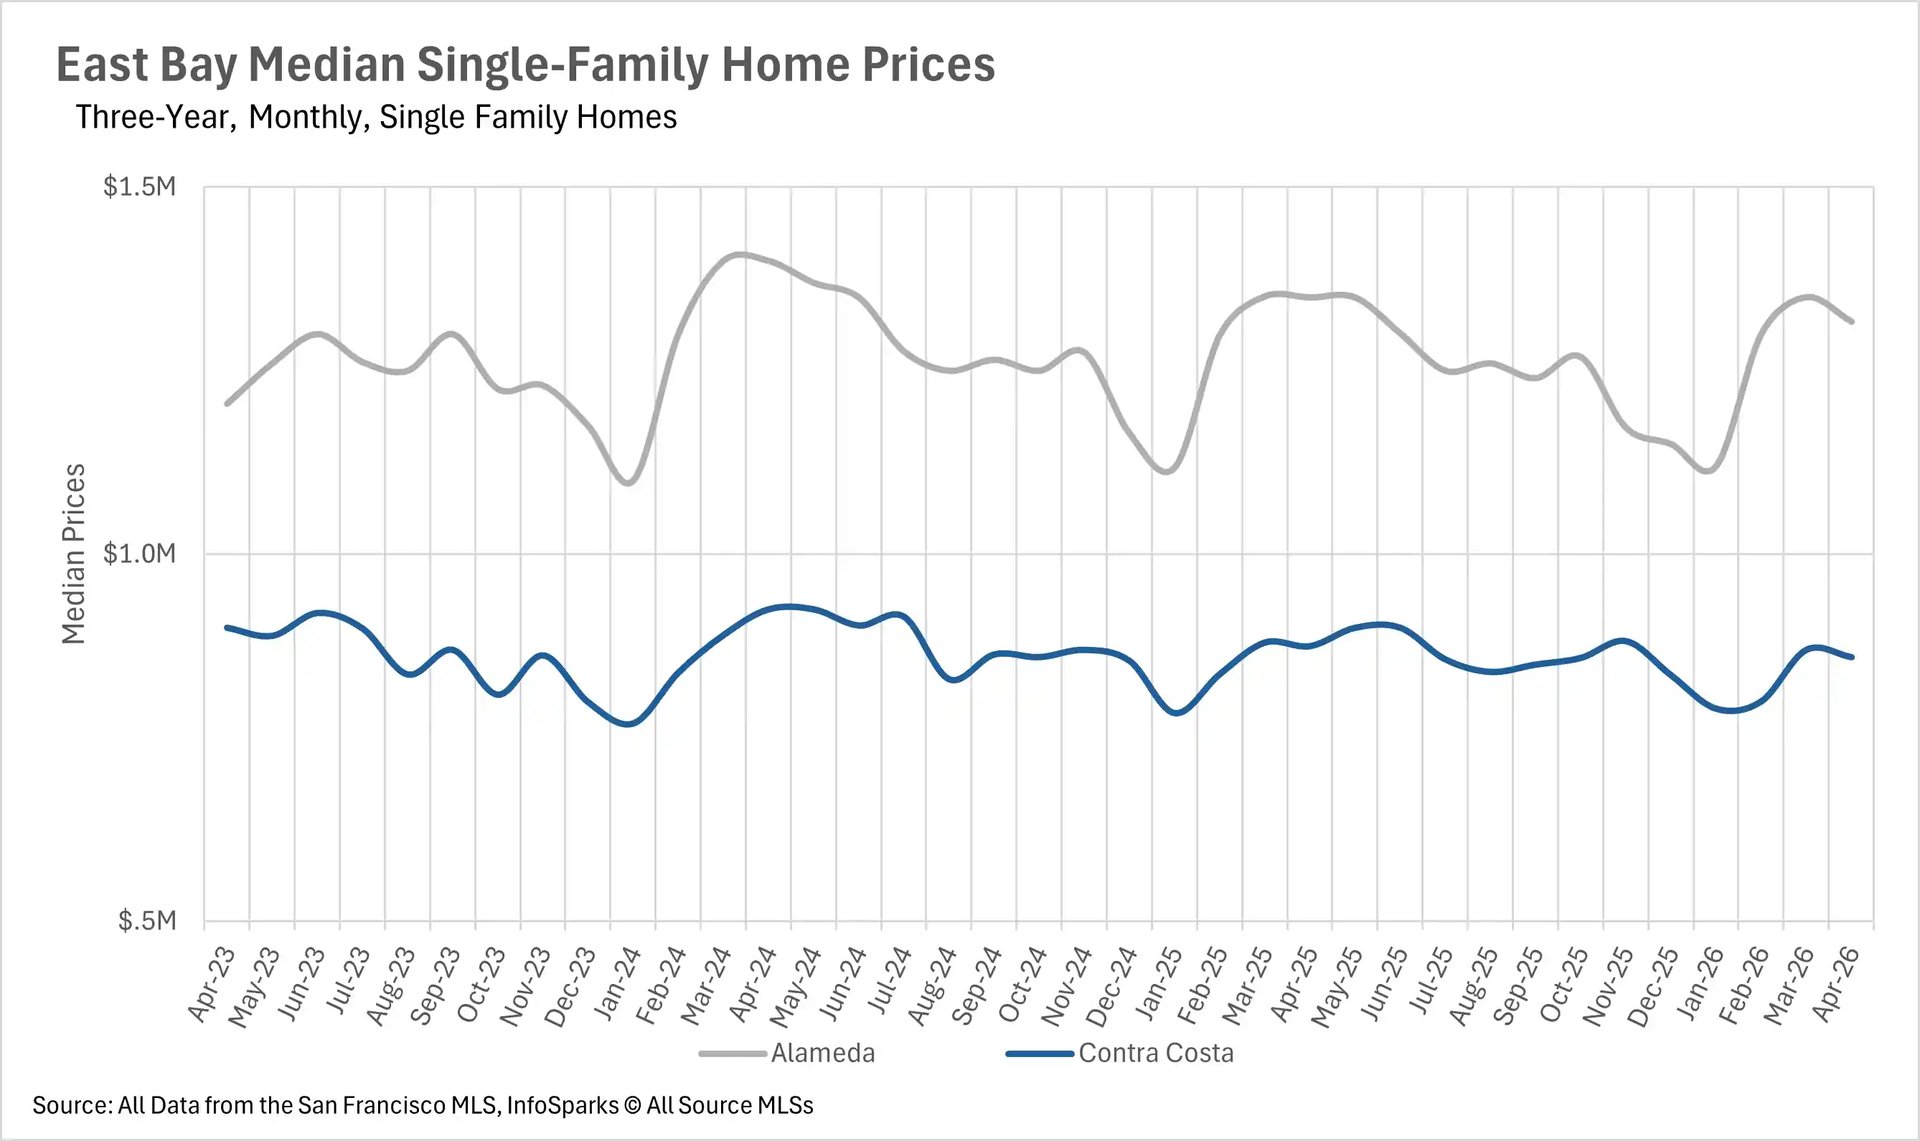
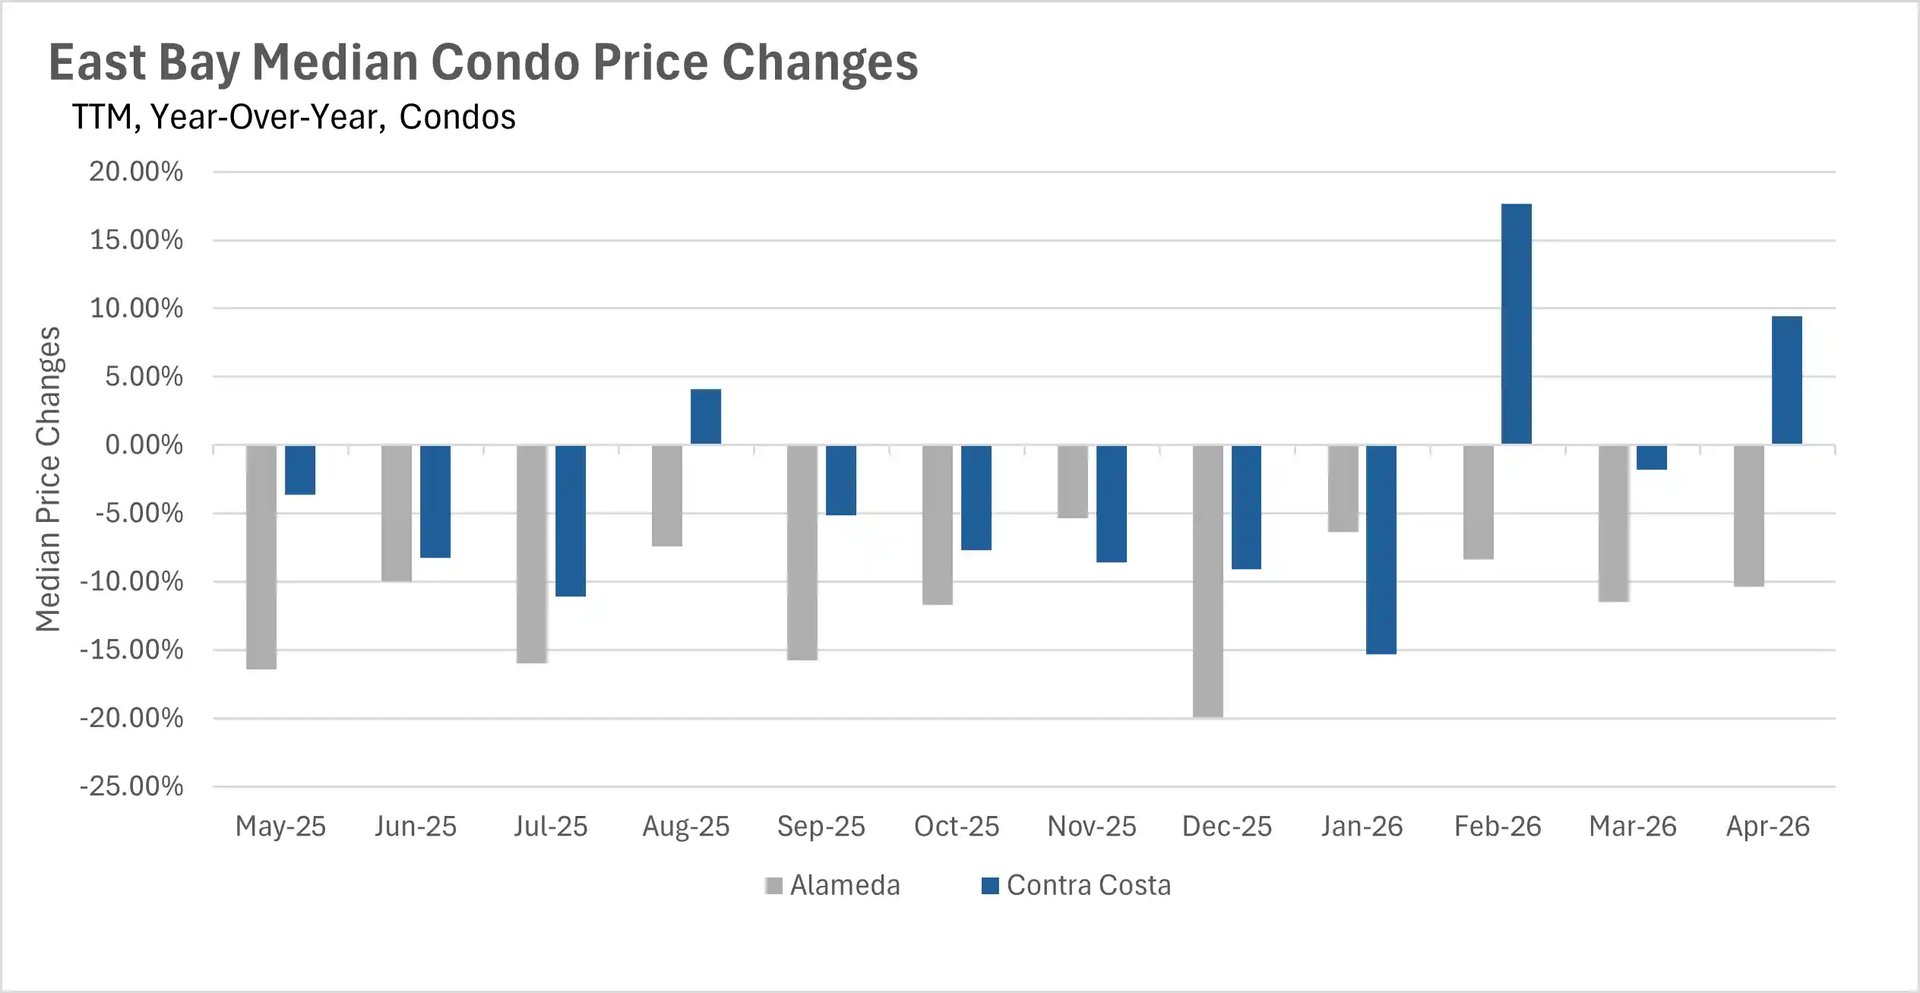
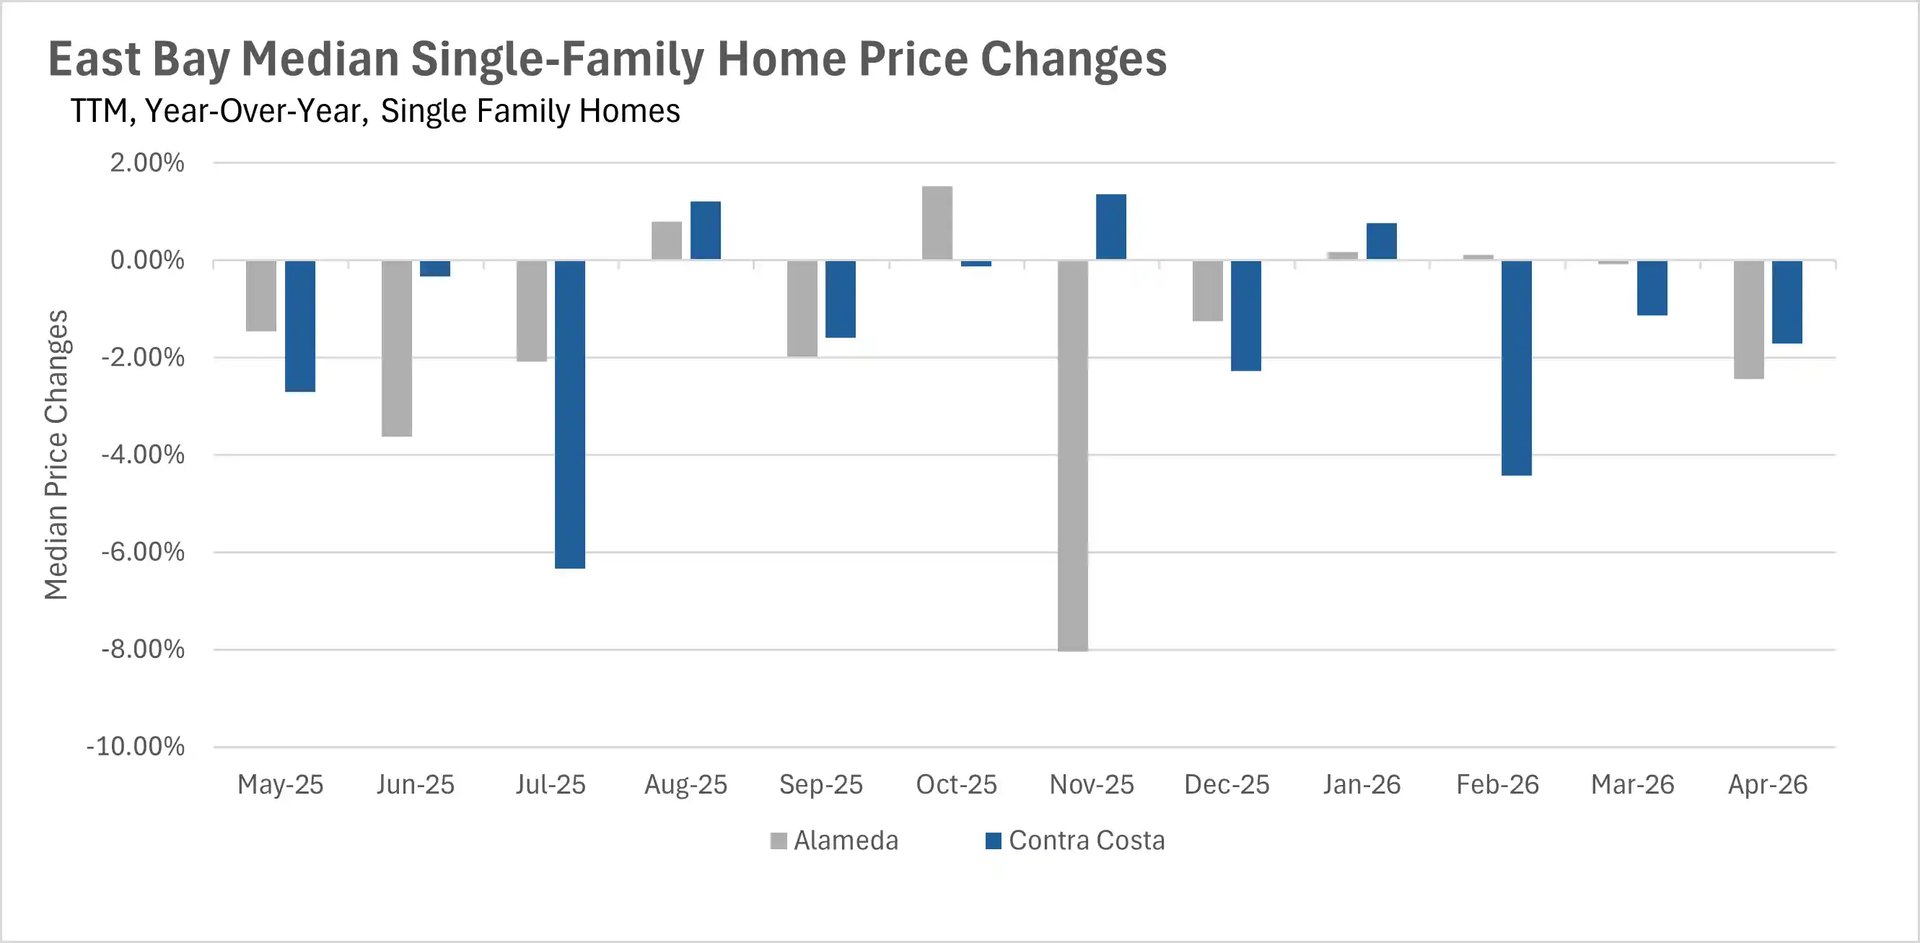
The North Bay saw encouraging results in Marin and Sonoma Counties, with year-over-year gains of 4.38% and 2.35%, respectively, although Napa and Solano Counties continued to soften. The East Bay experienced modest single-family price declines in both counties, with Alameda County down 2.44% and Contra Costa County down 1.71%. The condo market remains a tale of two worlds, with San Francisco condos commanding premiums of roughly 7% over asking price, while Alameda County condos declined 10.38% and Silicon Valley condos posted declines across the board.

The Bay Area's persistent inventory shortage is defining the spring market

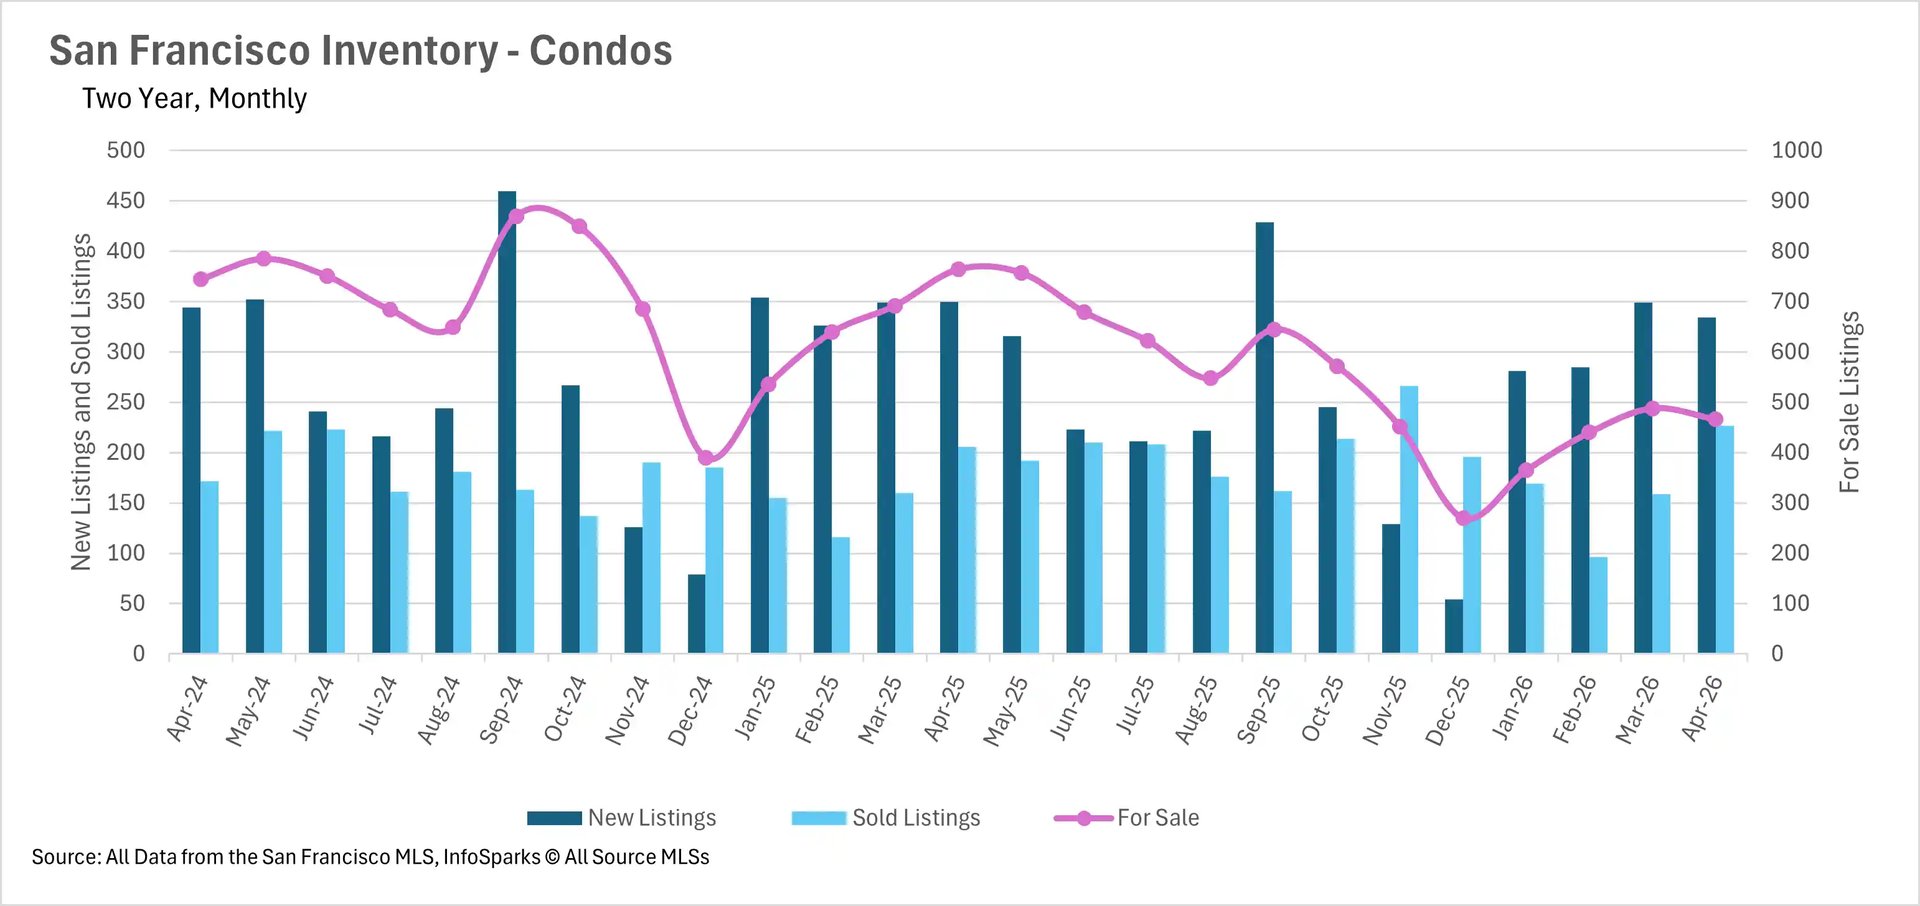
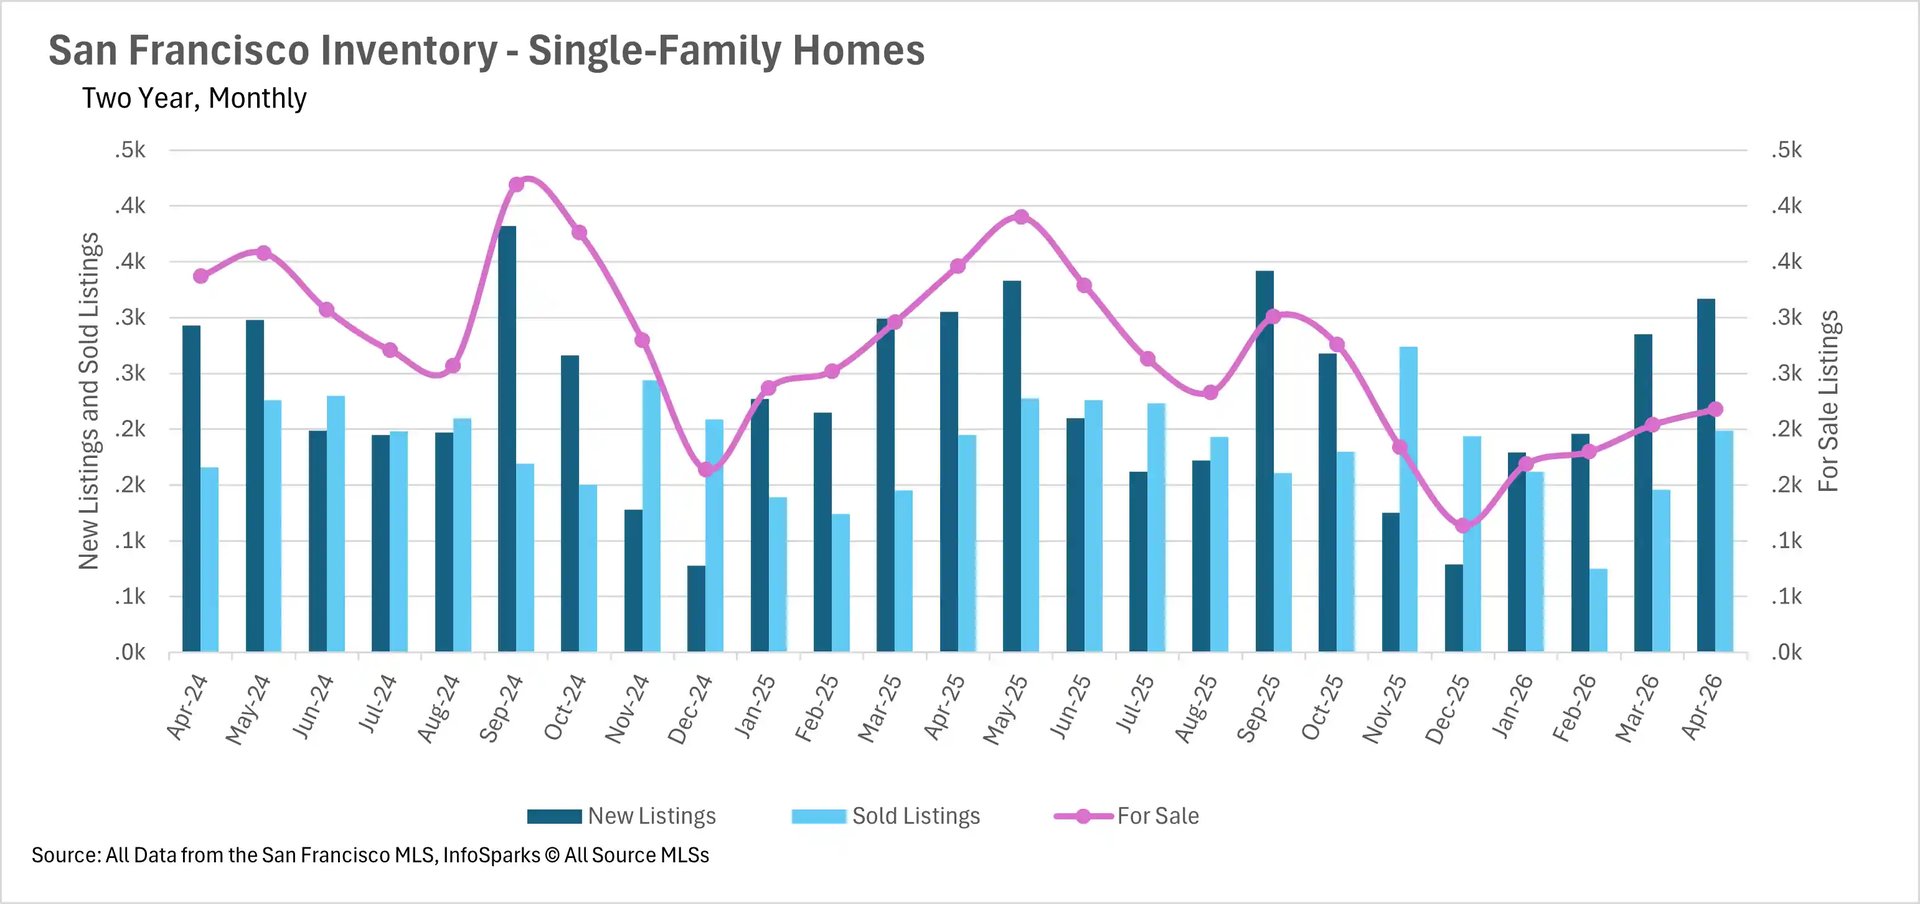
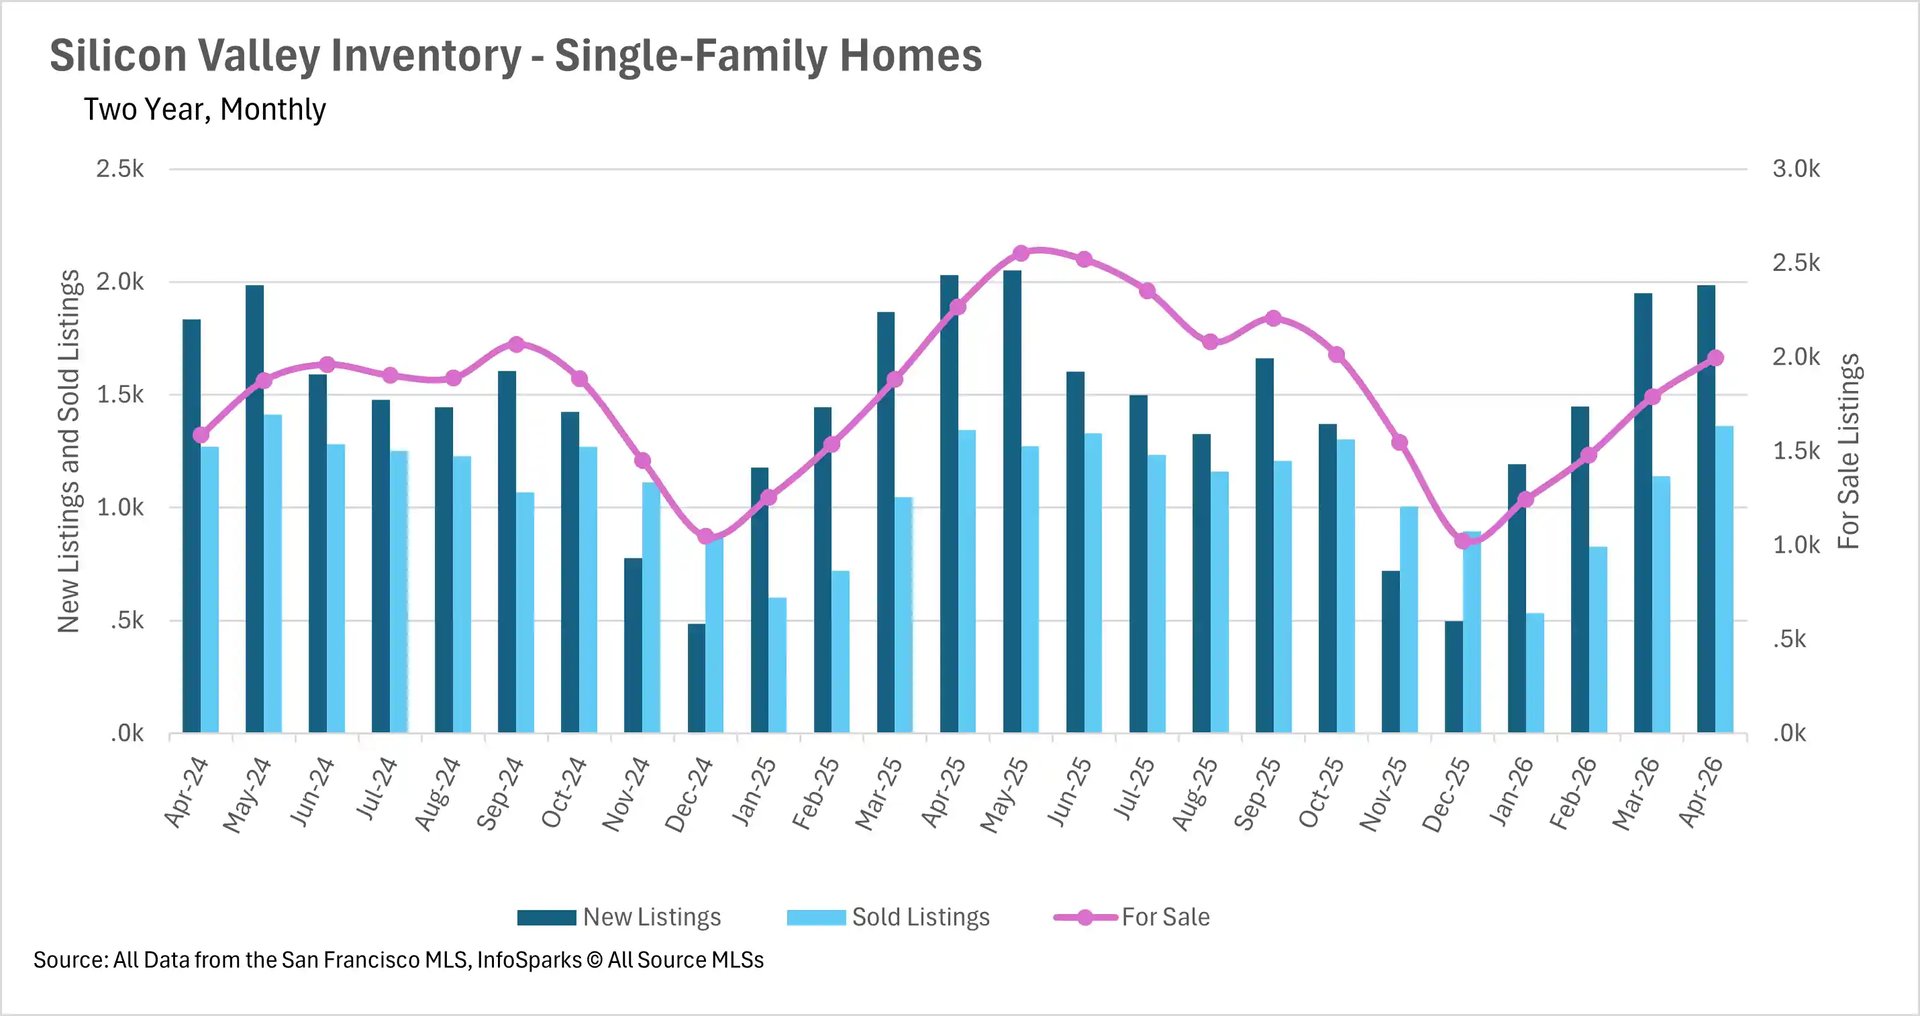
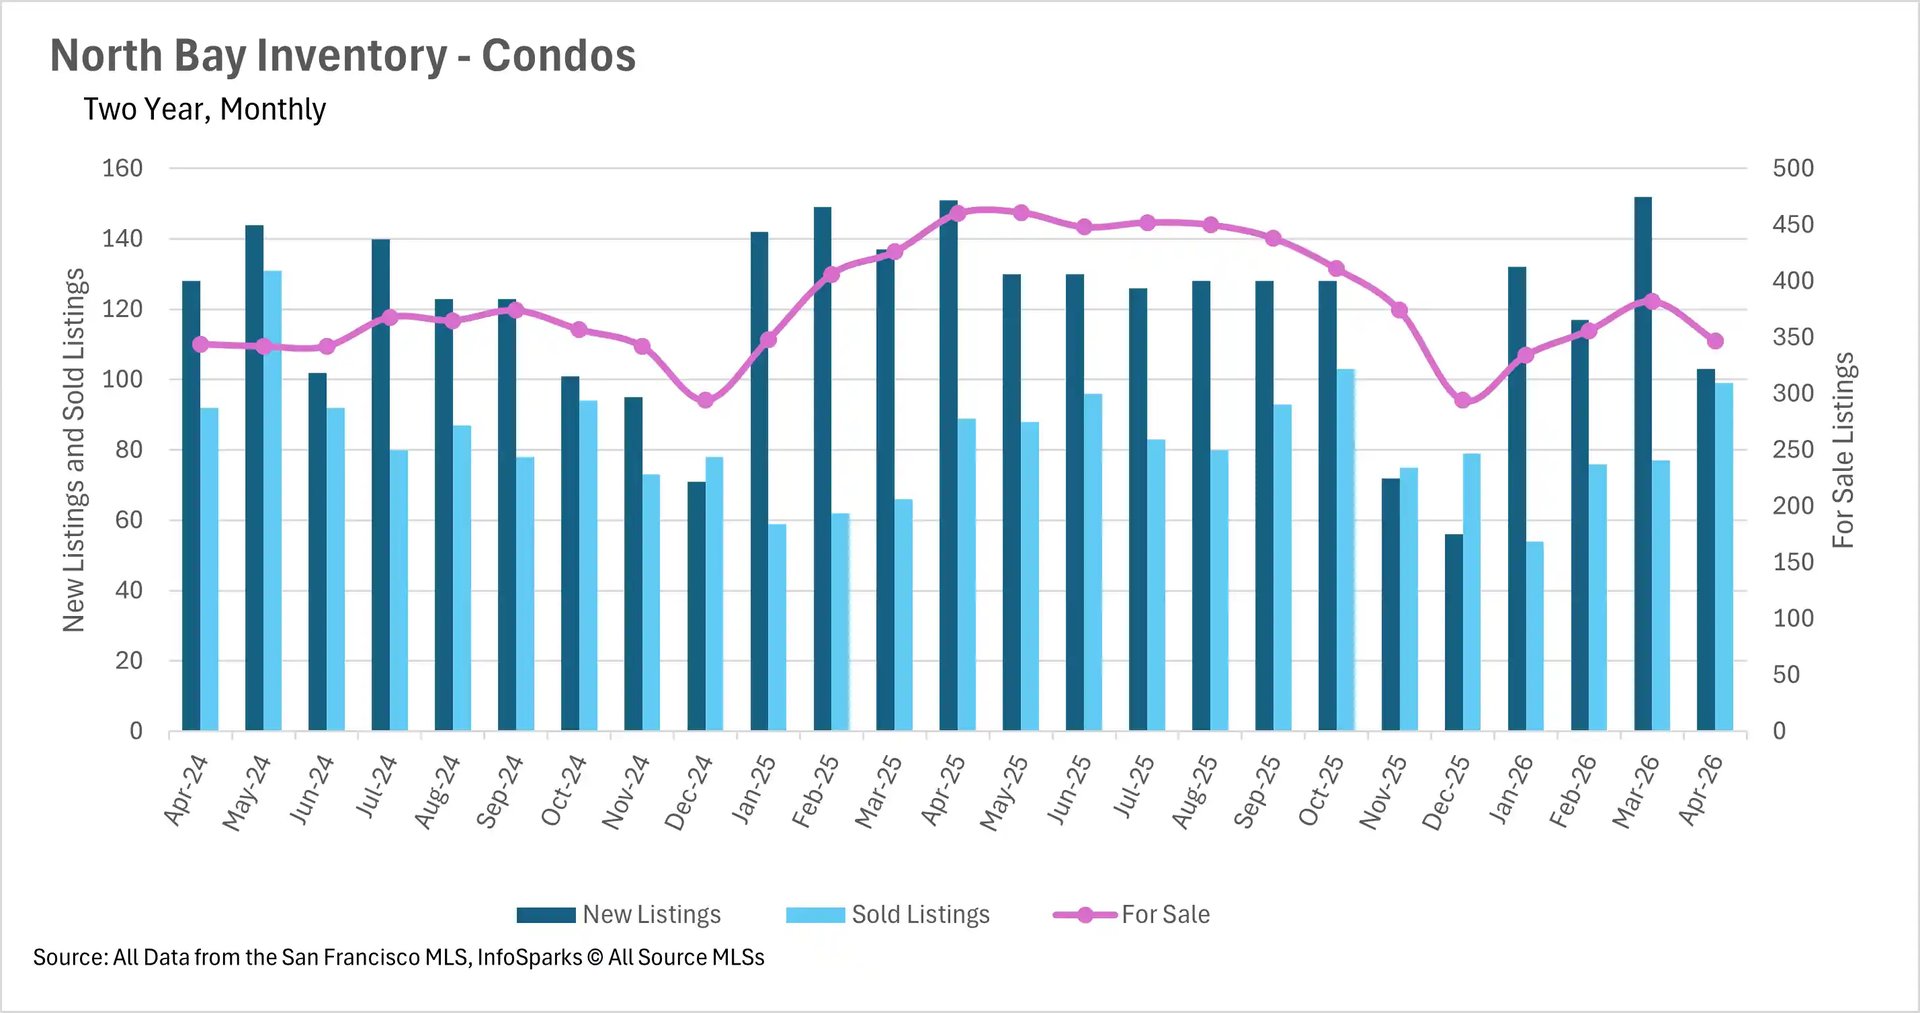
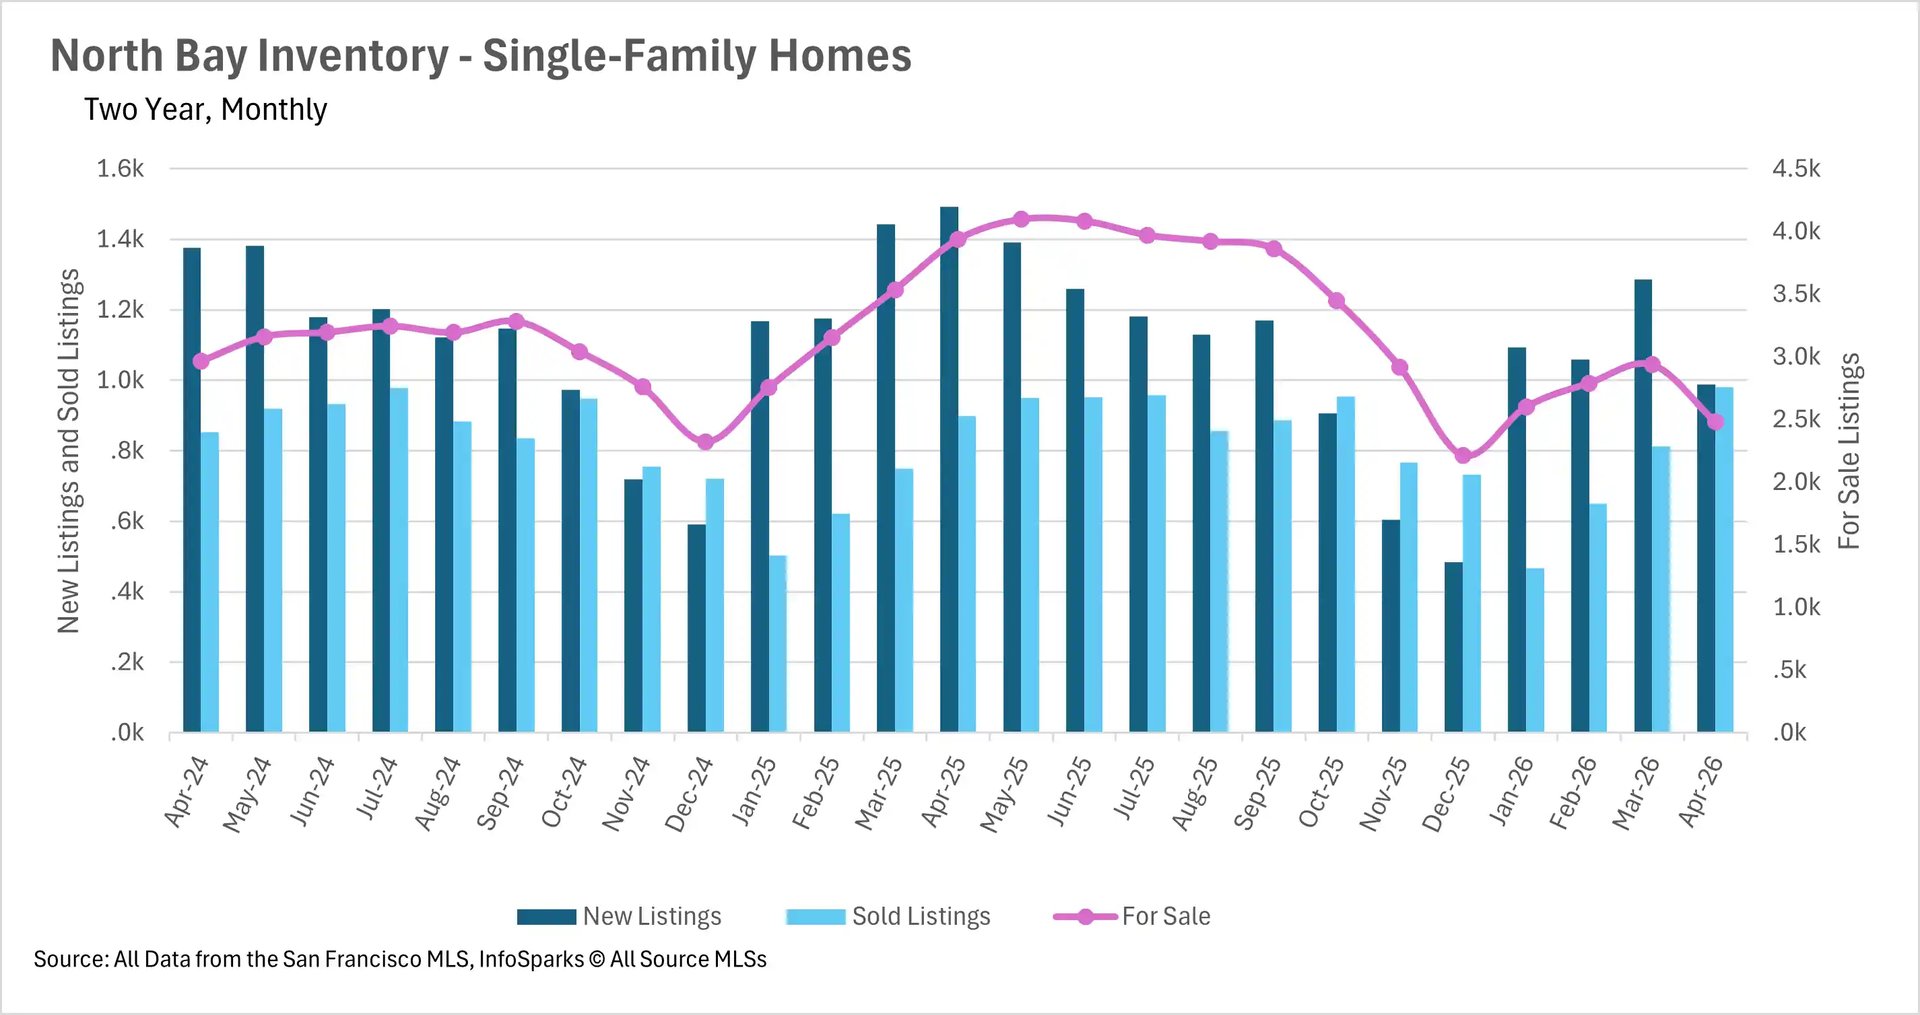
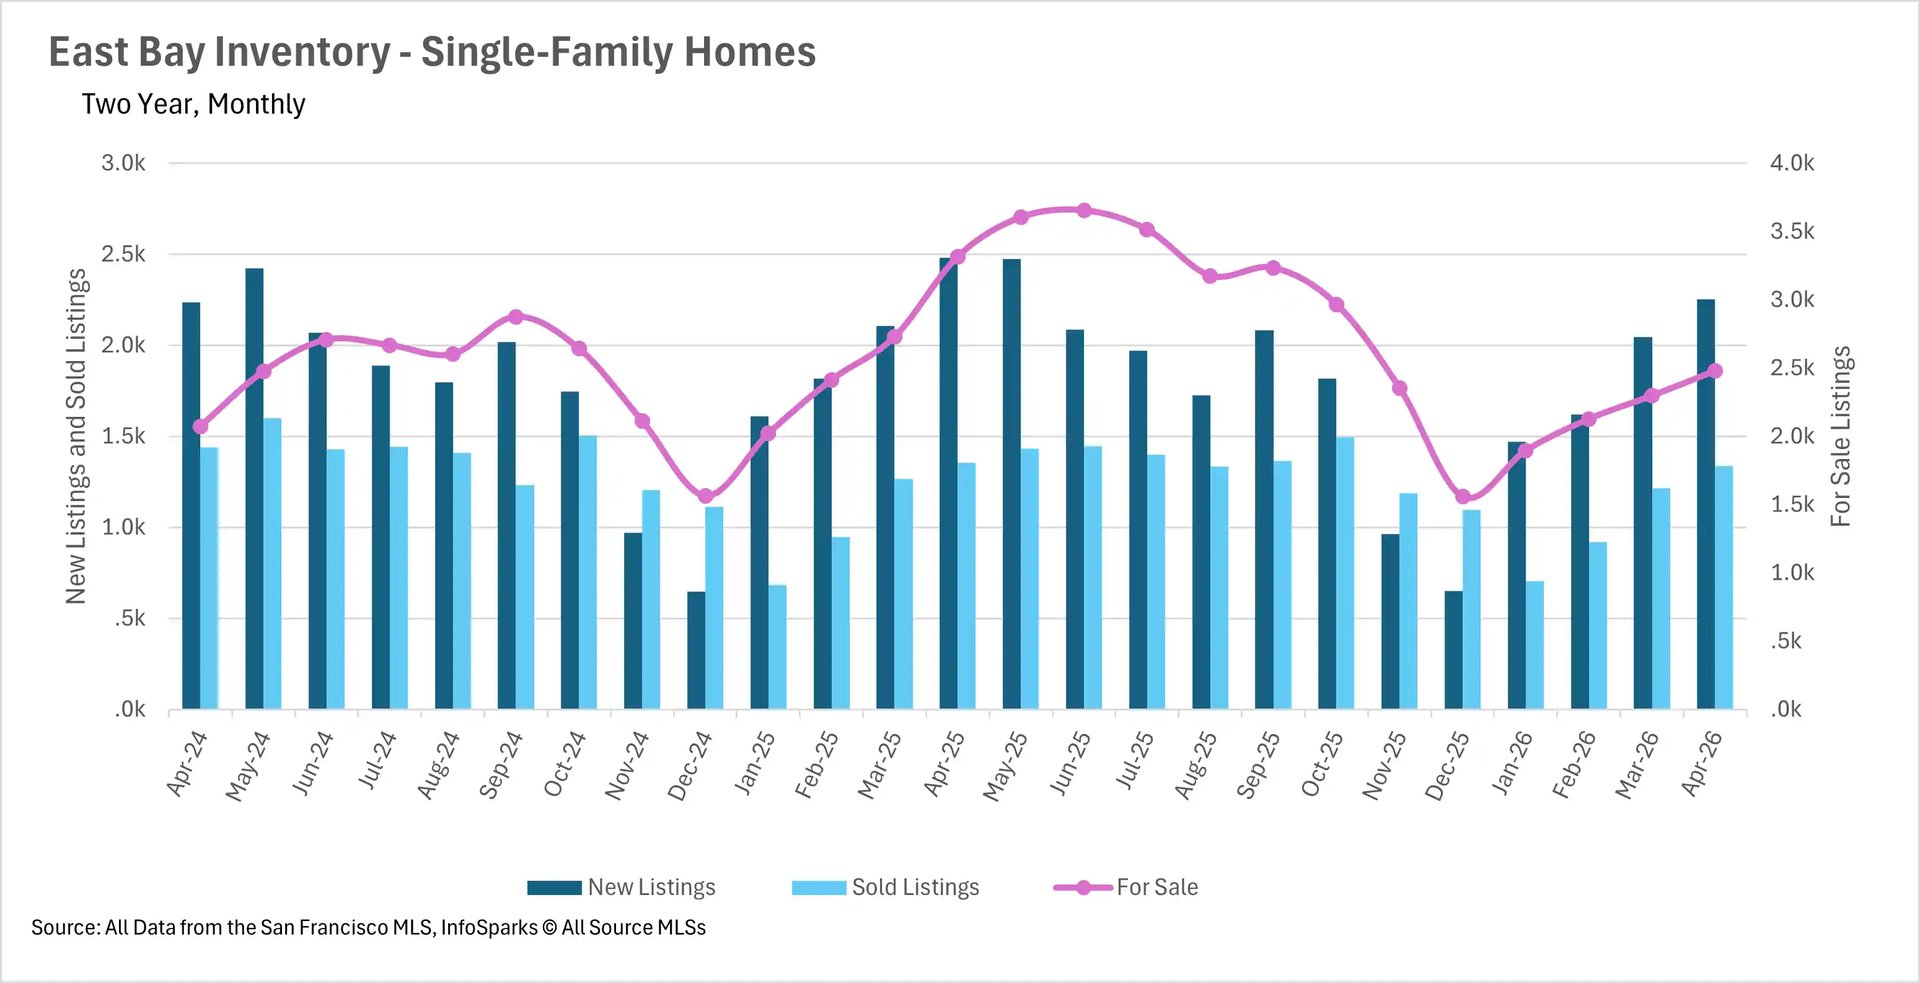
Despite being in the heart of the spring selling season, inventory levels across the Bay Area remain stubbornly below where they were a year ago. San Francisco continues to experience some of the most severe constraints, with single-family inventory down 36.99% and condo inventory down 39.01%, leaving fewer than 700 homes available for sale in the entire city. The North Bay isn't far behind, with single-family home inventory down 36.98% and condo inventory down 24.57%.

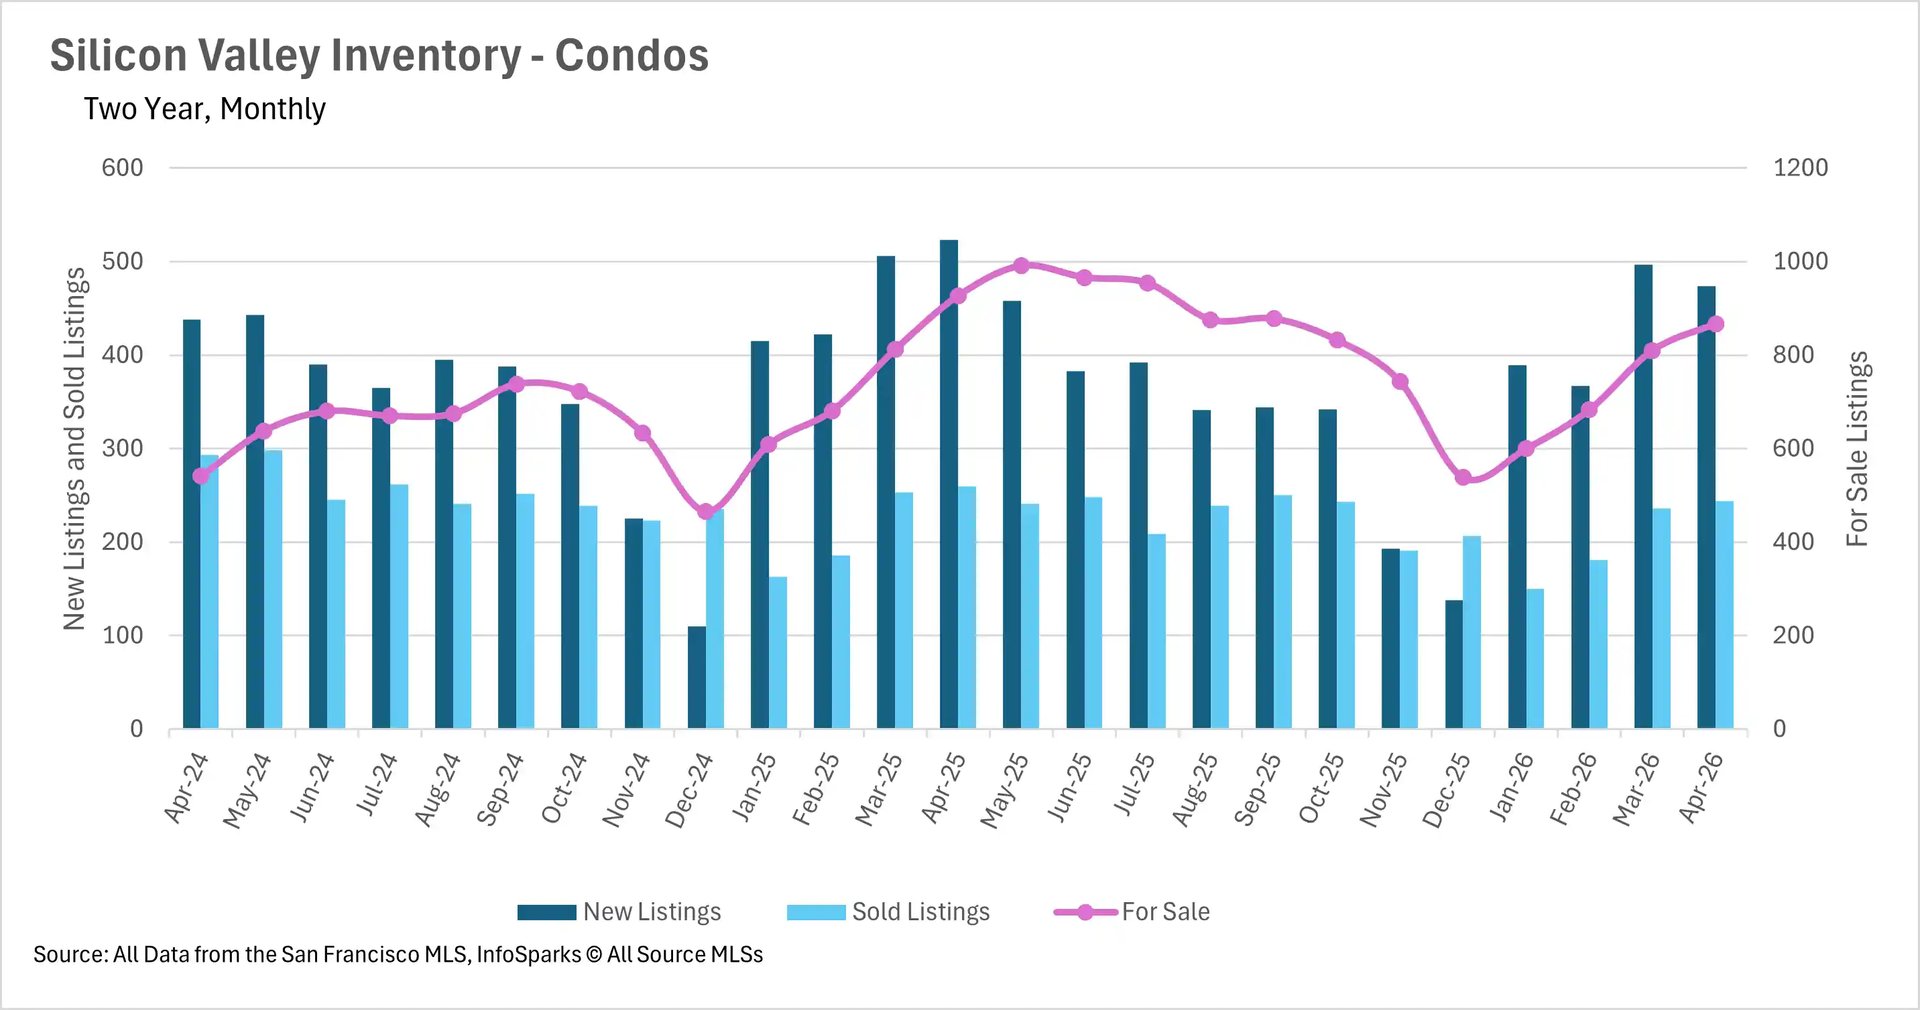
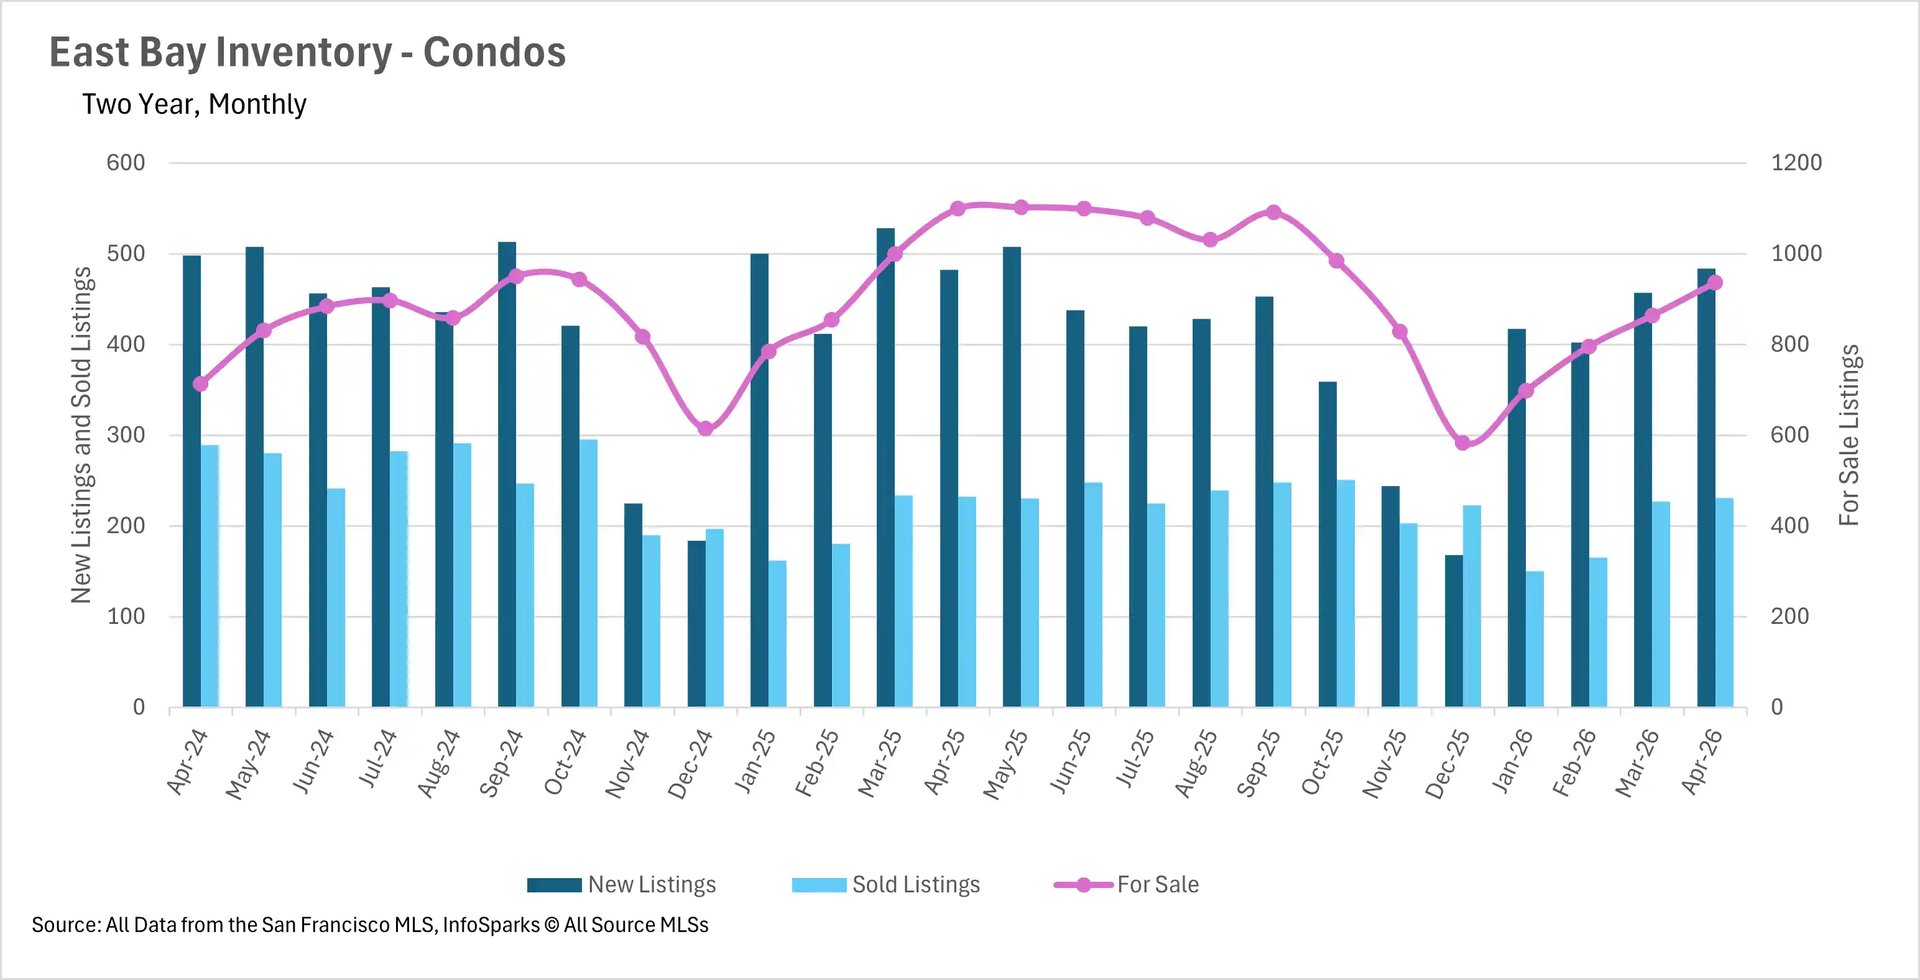
The East Bay has seen single-family inventory decline by 25.23% and condo inventory drop by 14.82%. Silicon Valley rounds out the picture with single-family inventory down 12.03% and condo inventory down 6.47%. The silver lining is that transaction activity remains healthy. North Bay single-family home sales are up 9.01% year-over-year, and April saw nearly as many single-family home sales as new listings in the North Bay, underscoring just how quickly the market is absorbing available supply. Until more sellers decide to list their properties, buyers will continue to face an incredibly competitive landscape.

Single-family homes are selling in days, but the condo market is a mixed bag

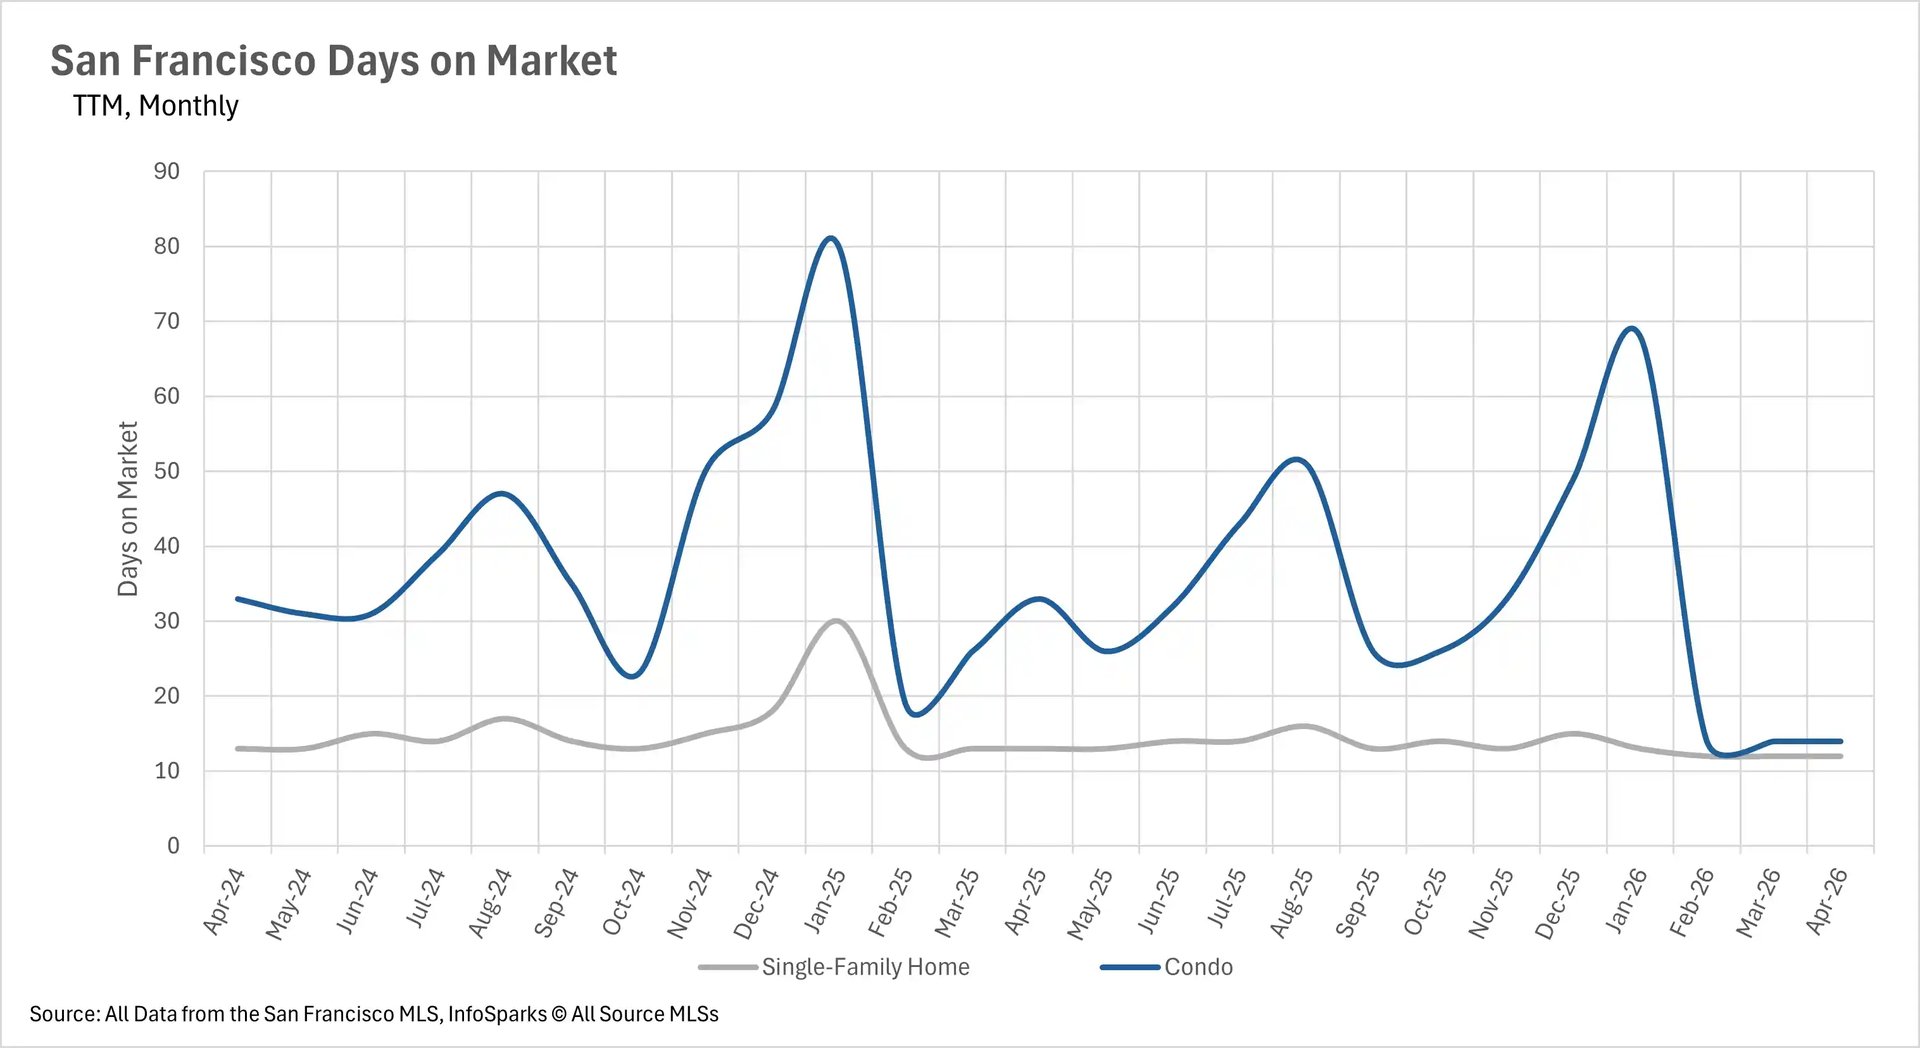
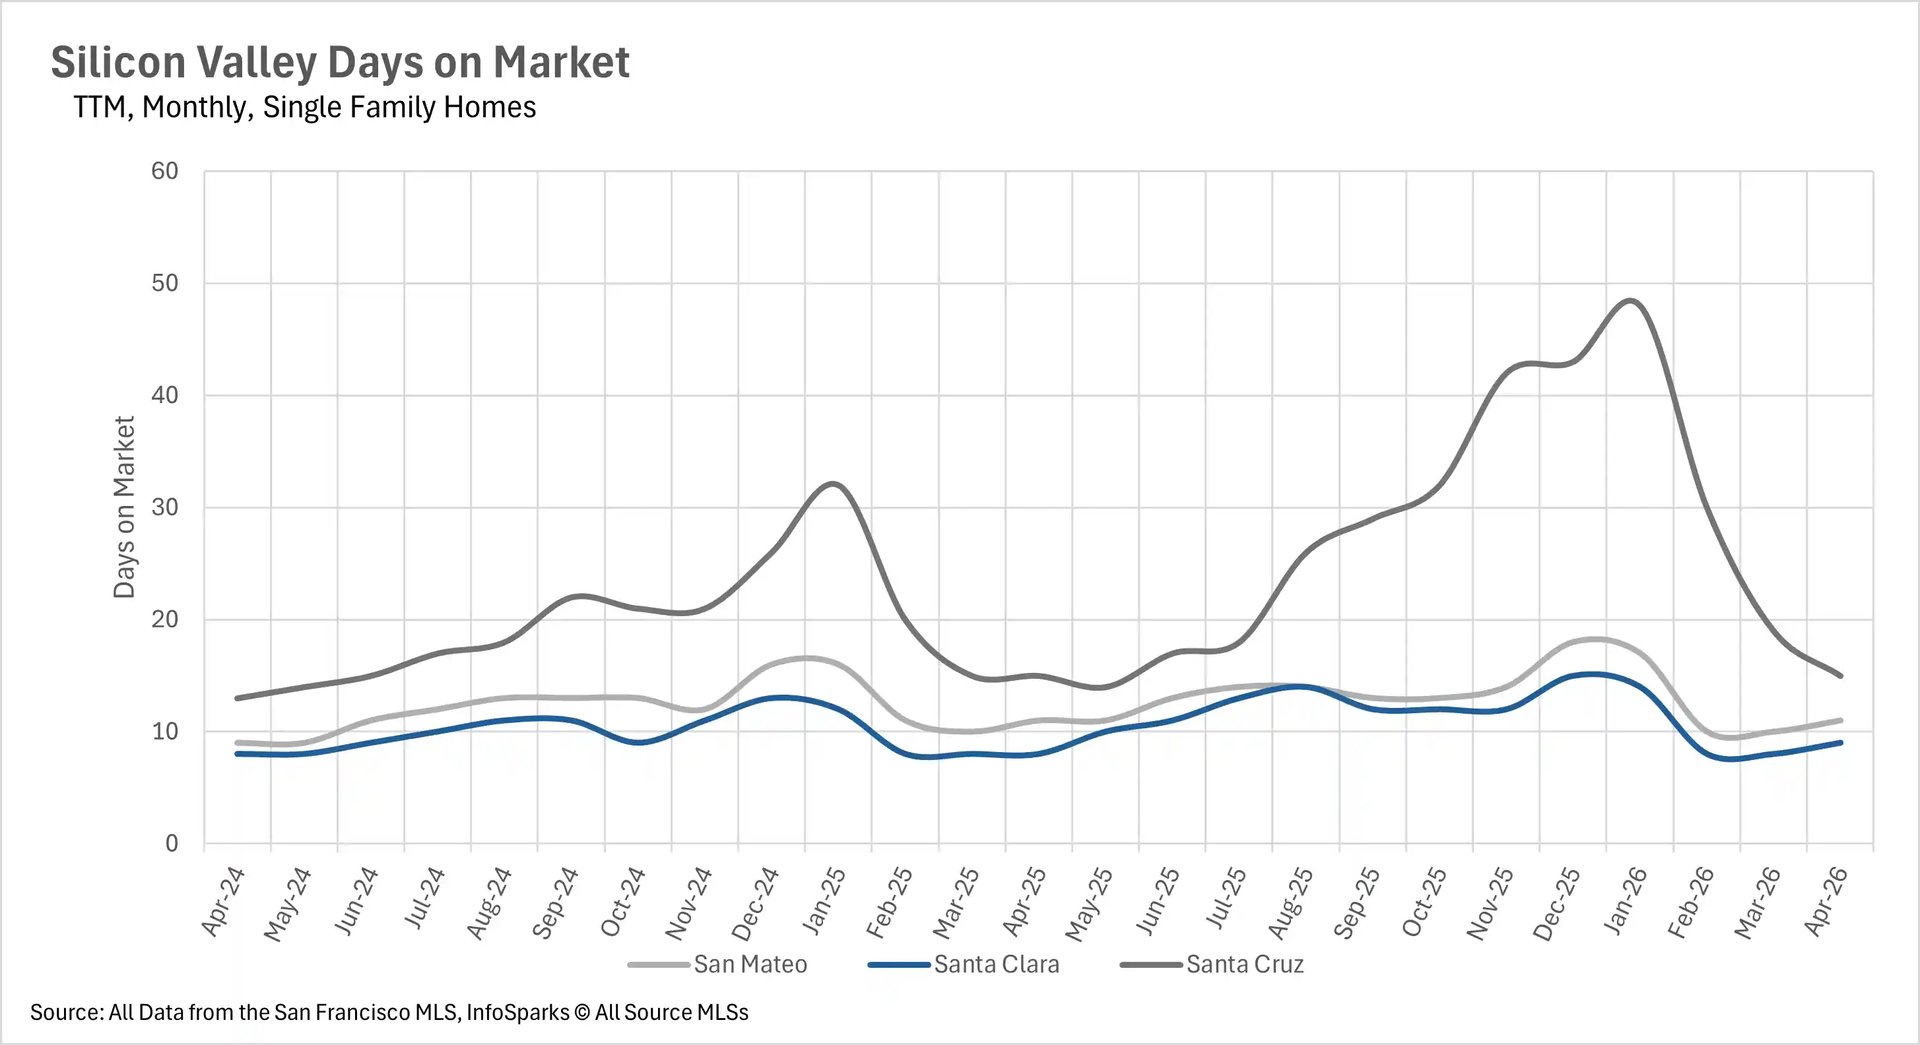
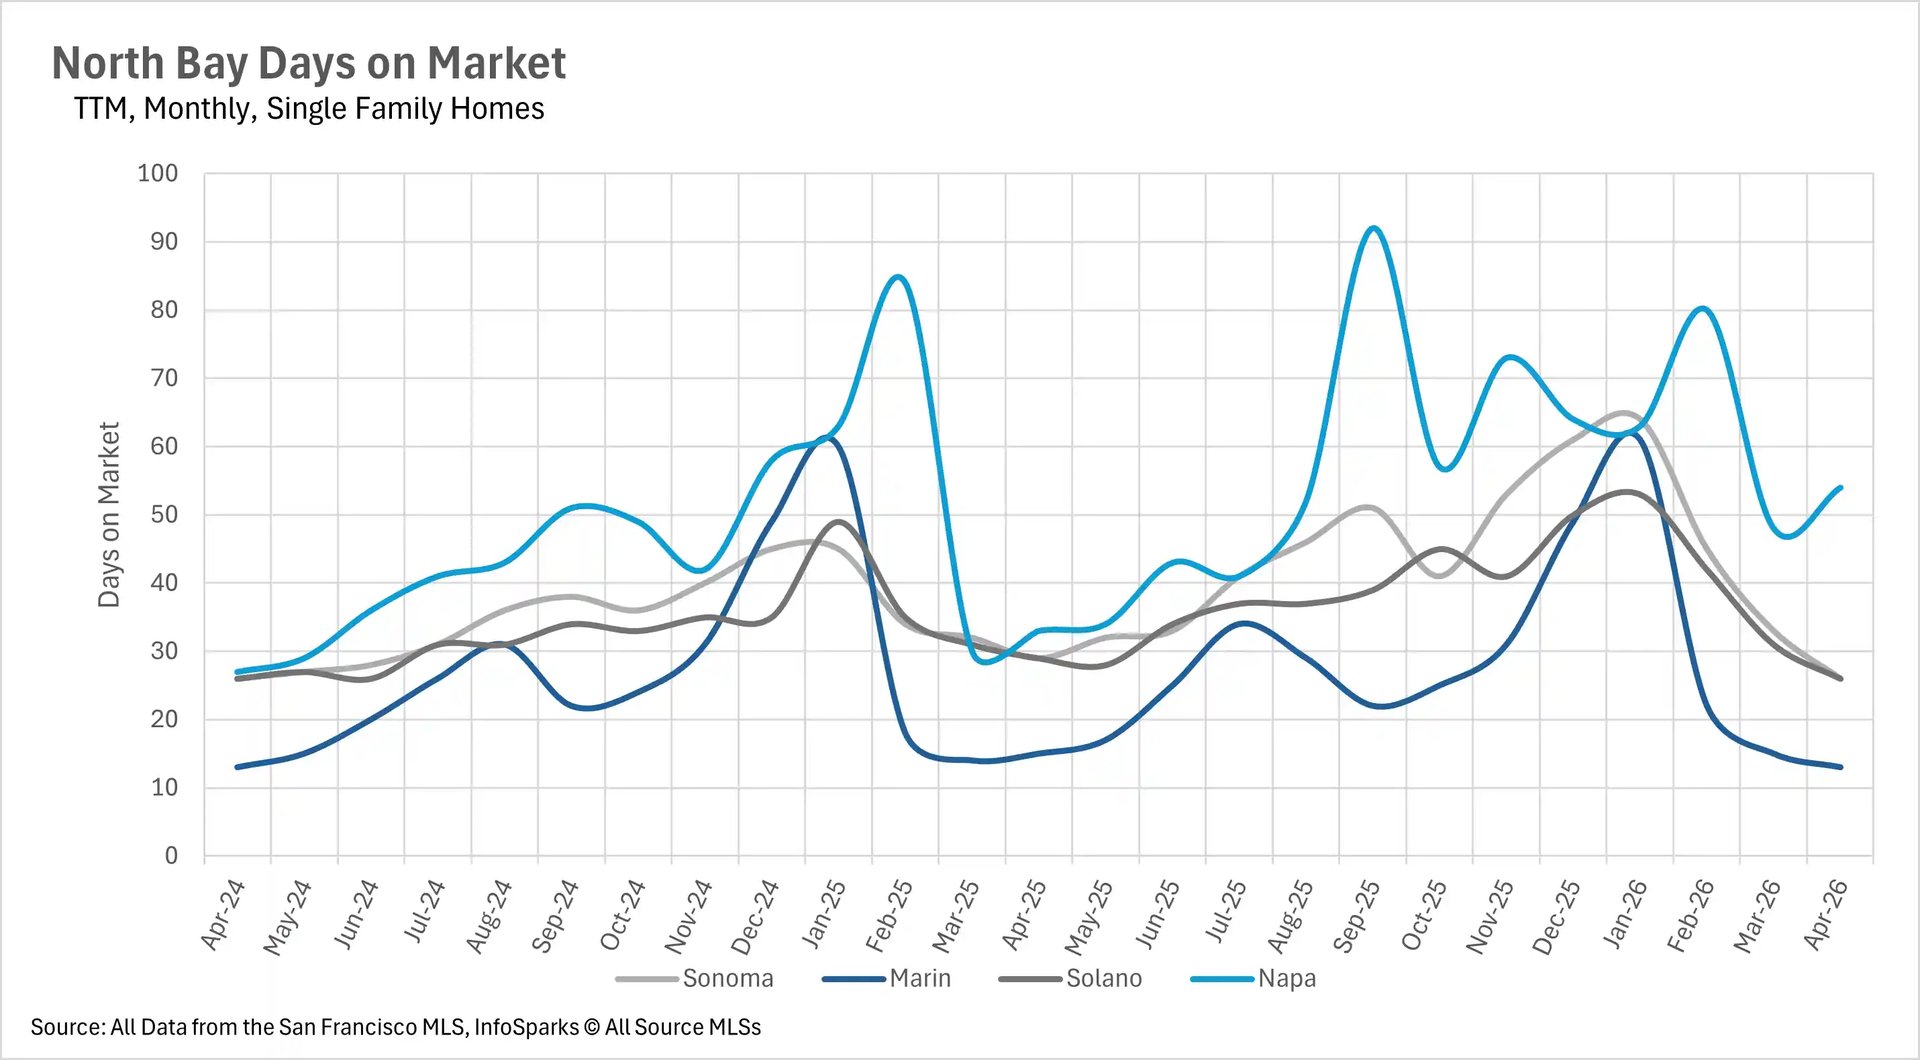
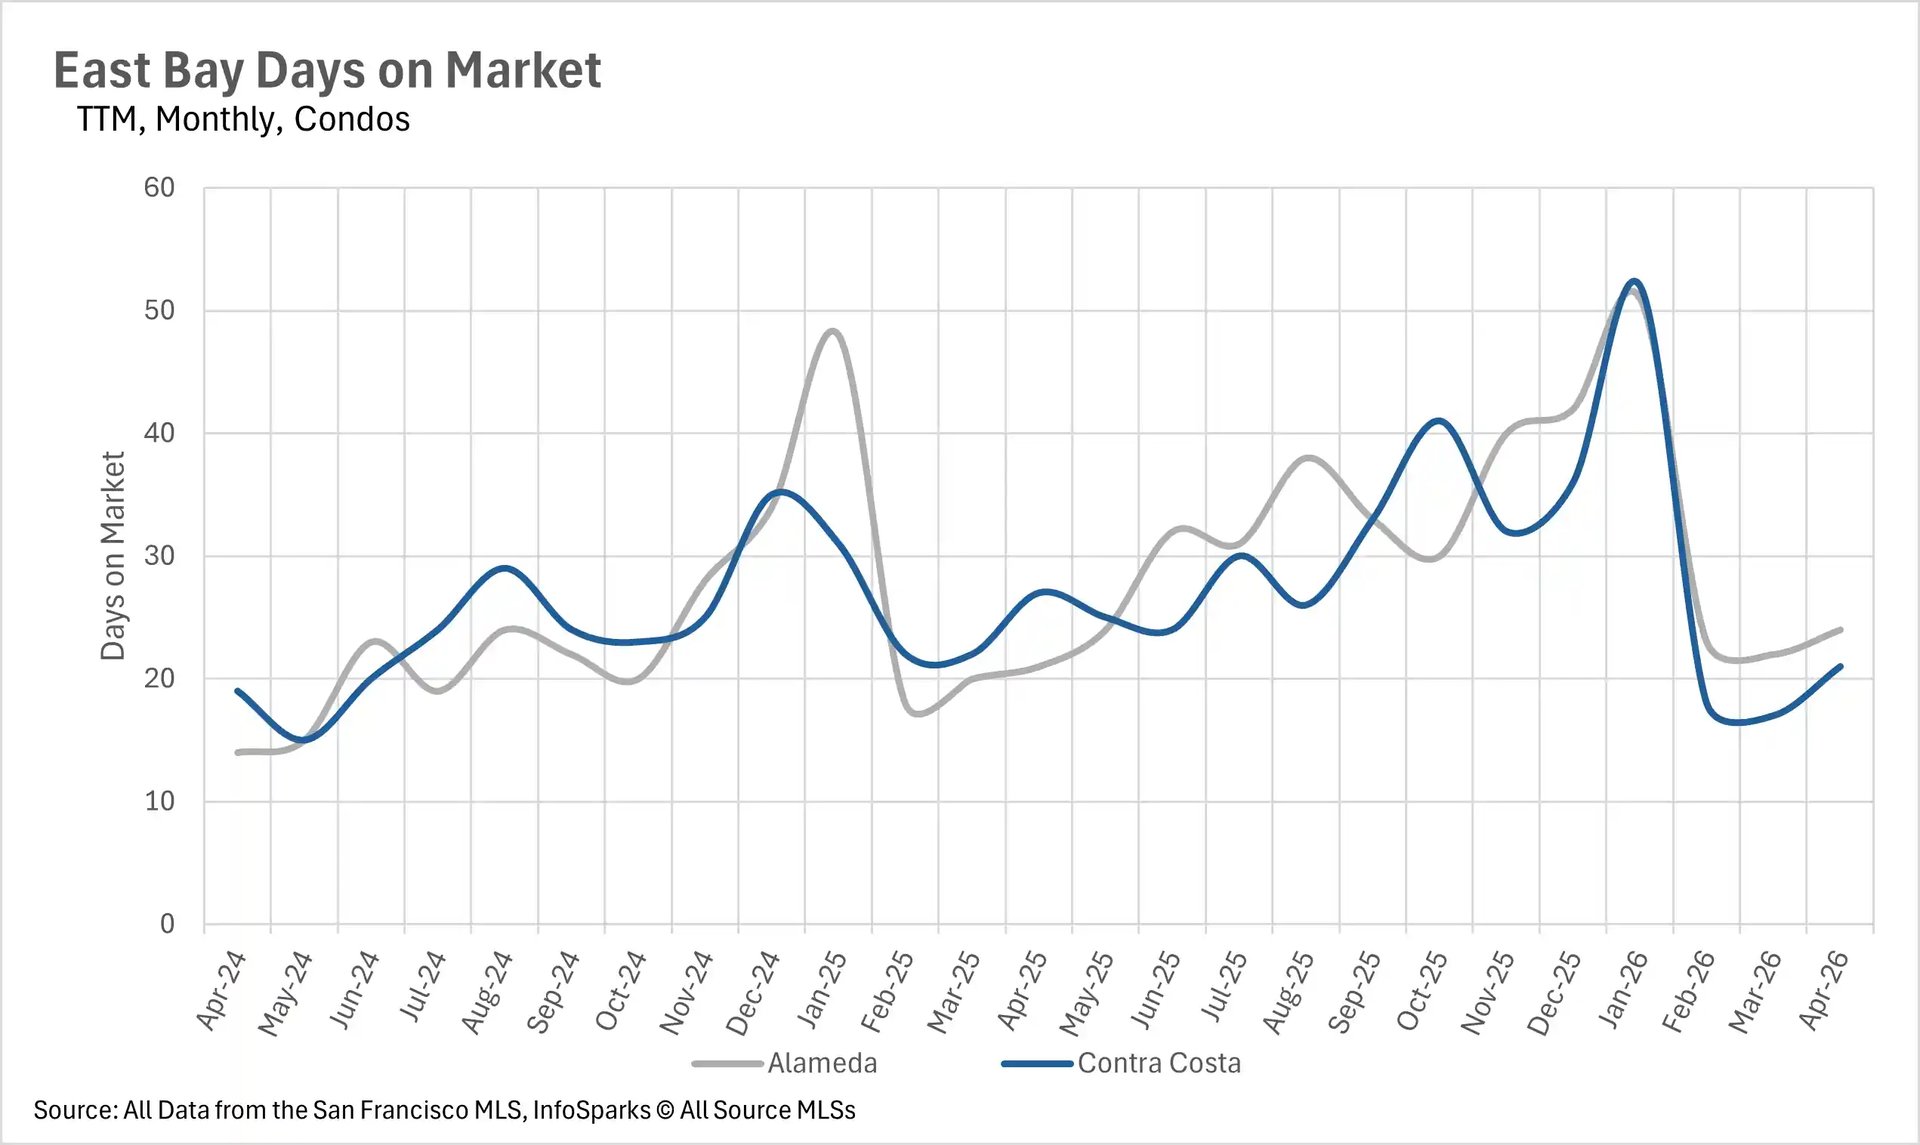
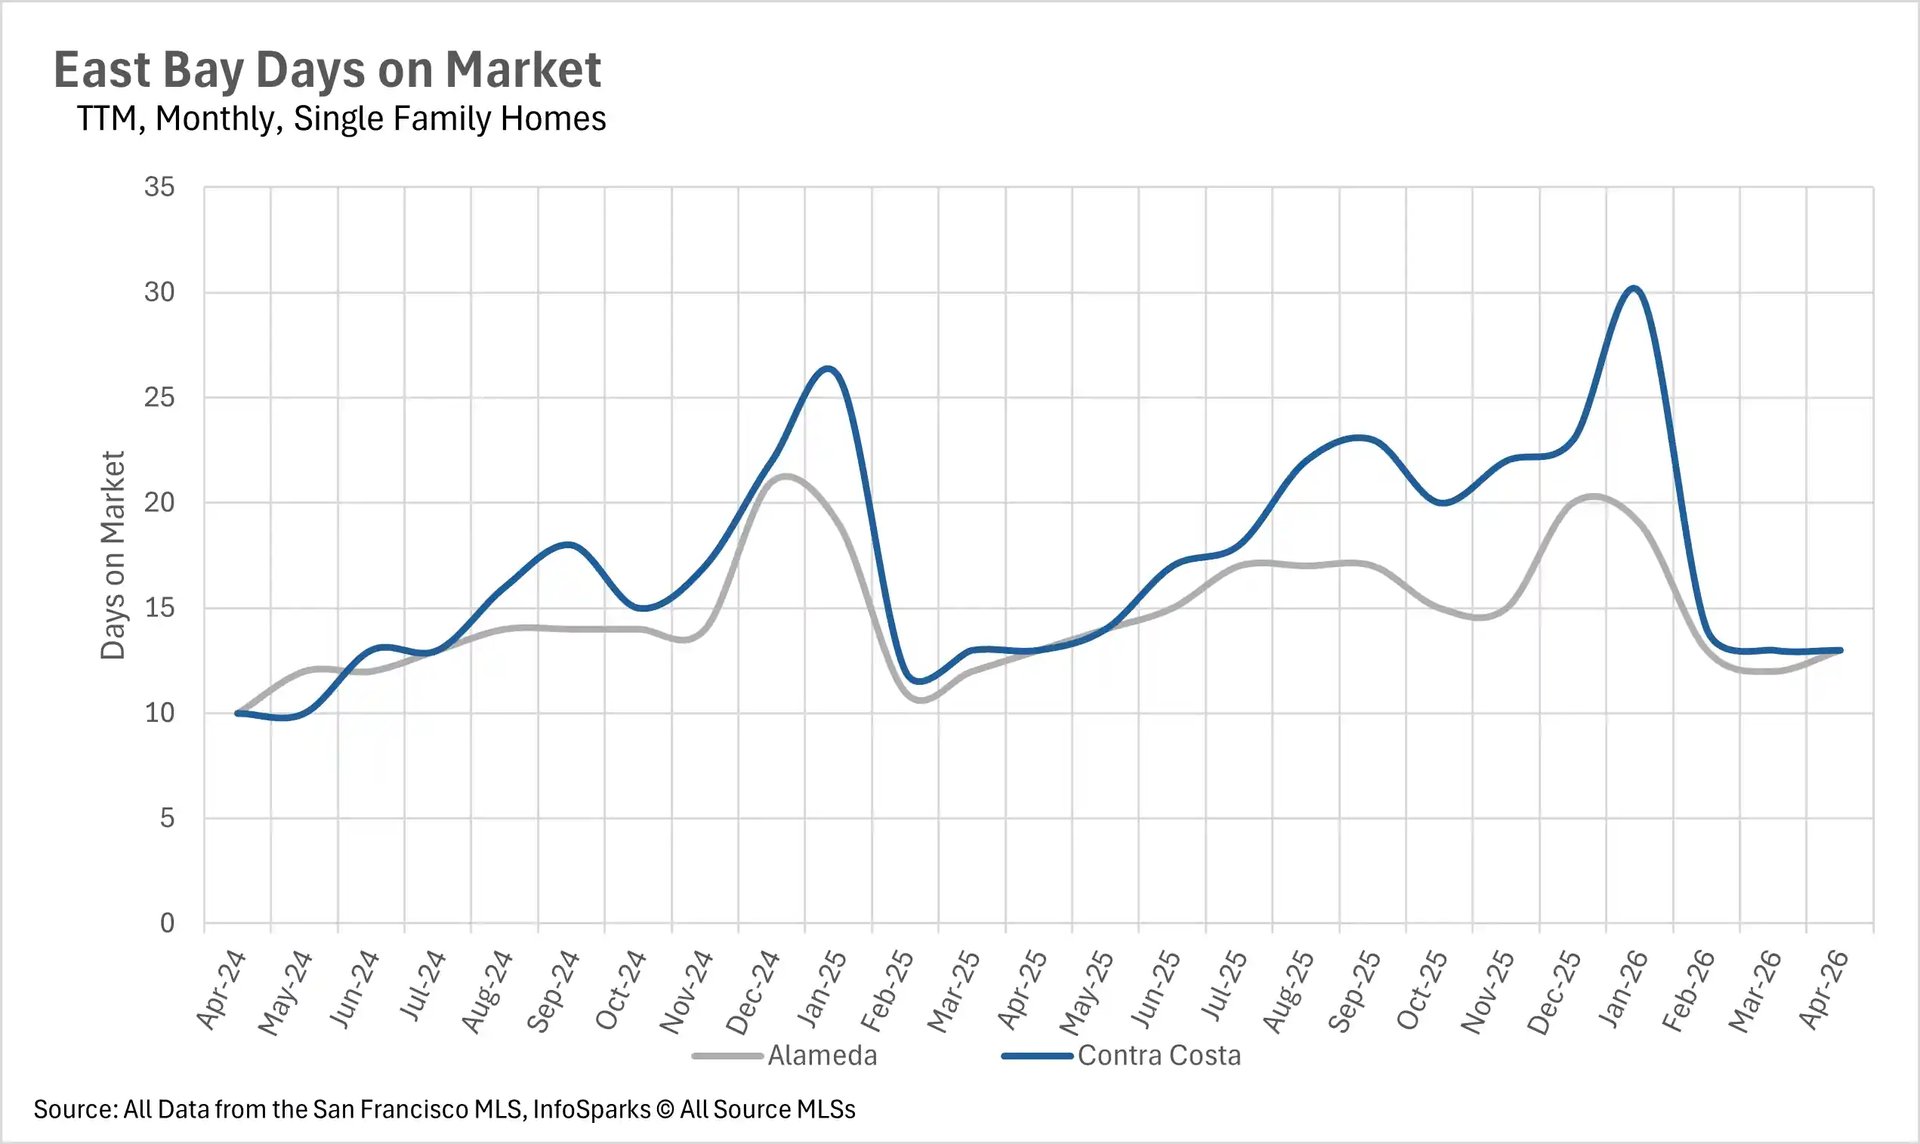
The pace of sales for single-family homes across the Bay Area remains exceptional. In Santa Clara County, the average home is selling in just 9 days. San Mateo County homes are moving in 11 days, San Francisco single-family homes in 12 days, and Marin County homes in just 13 days. East Bay listings are closing in 13 days in both Alameda and Contra Costa Counties, while Sonoma and Solano Counties are both clocking in at 26 days. These figures are largely unchanged from a year ago, demonstrating the sustained strength of buyer demand.

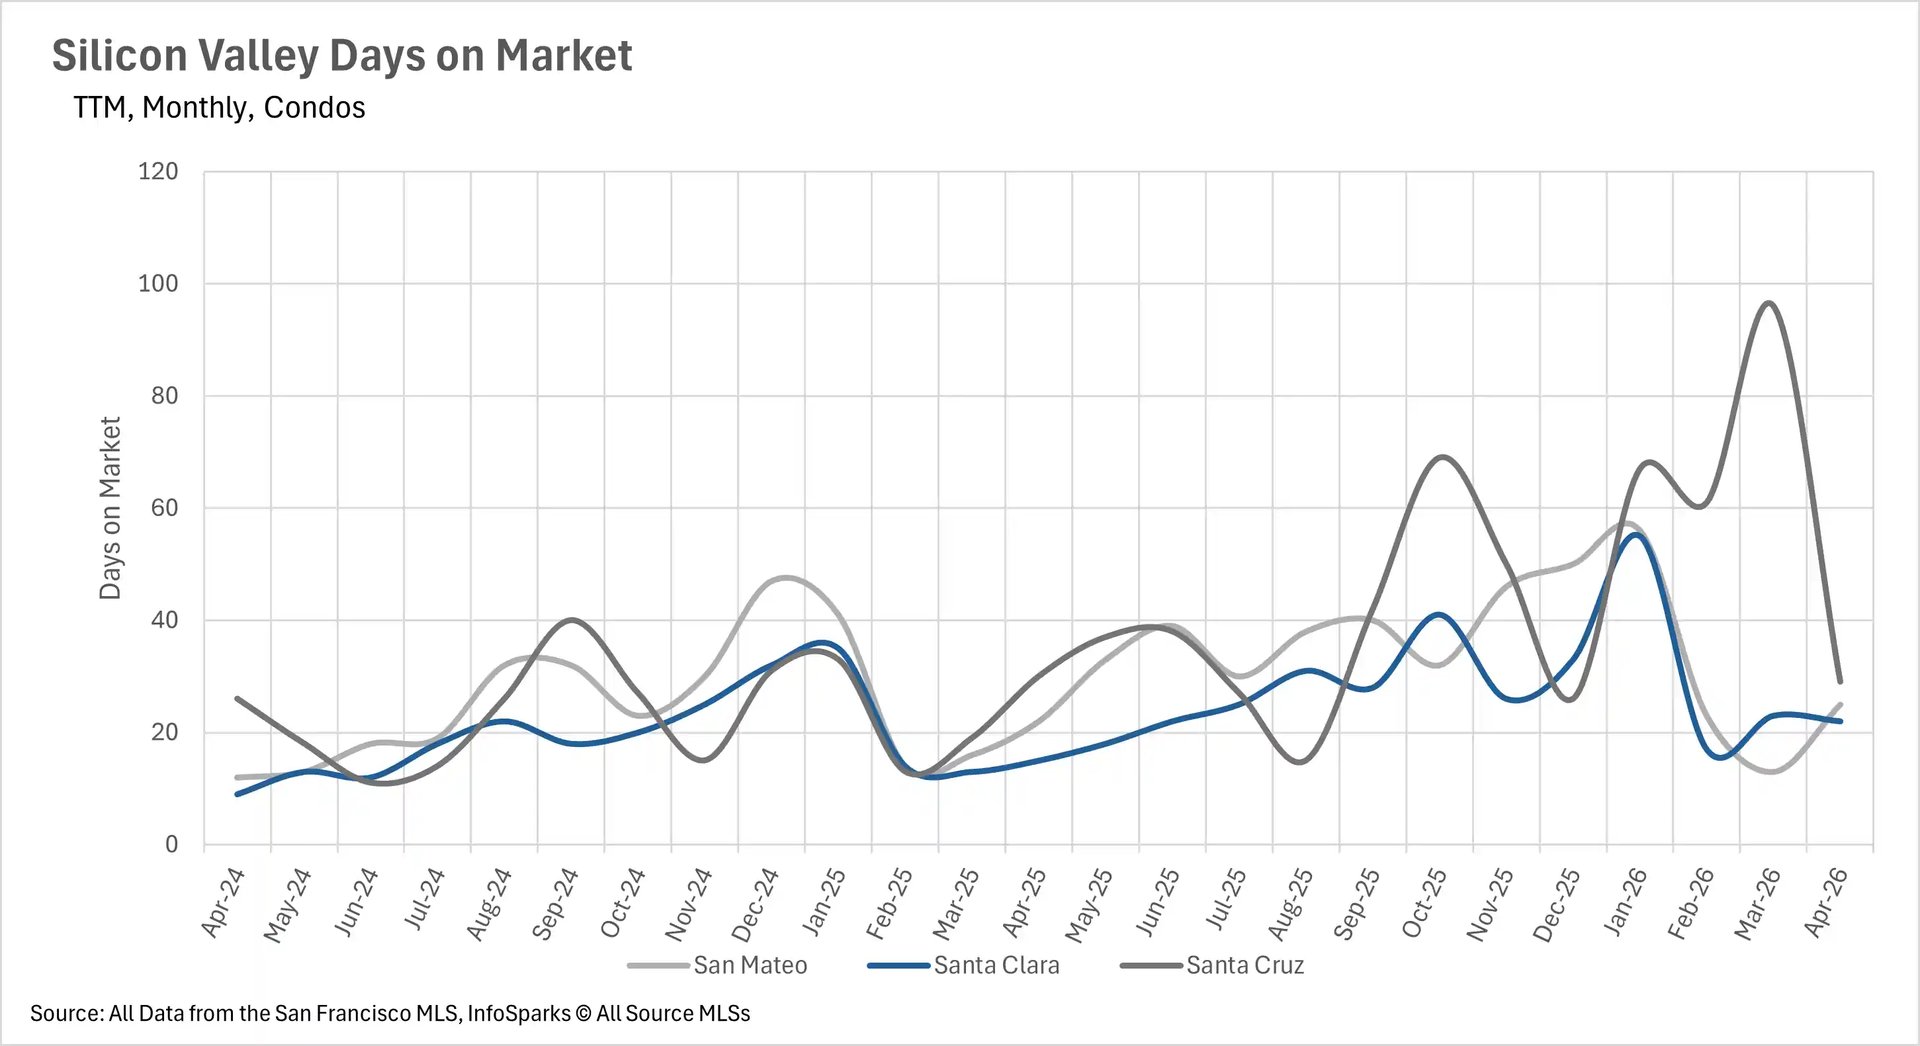
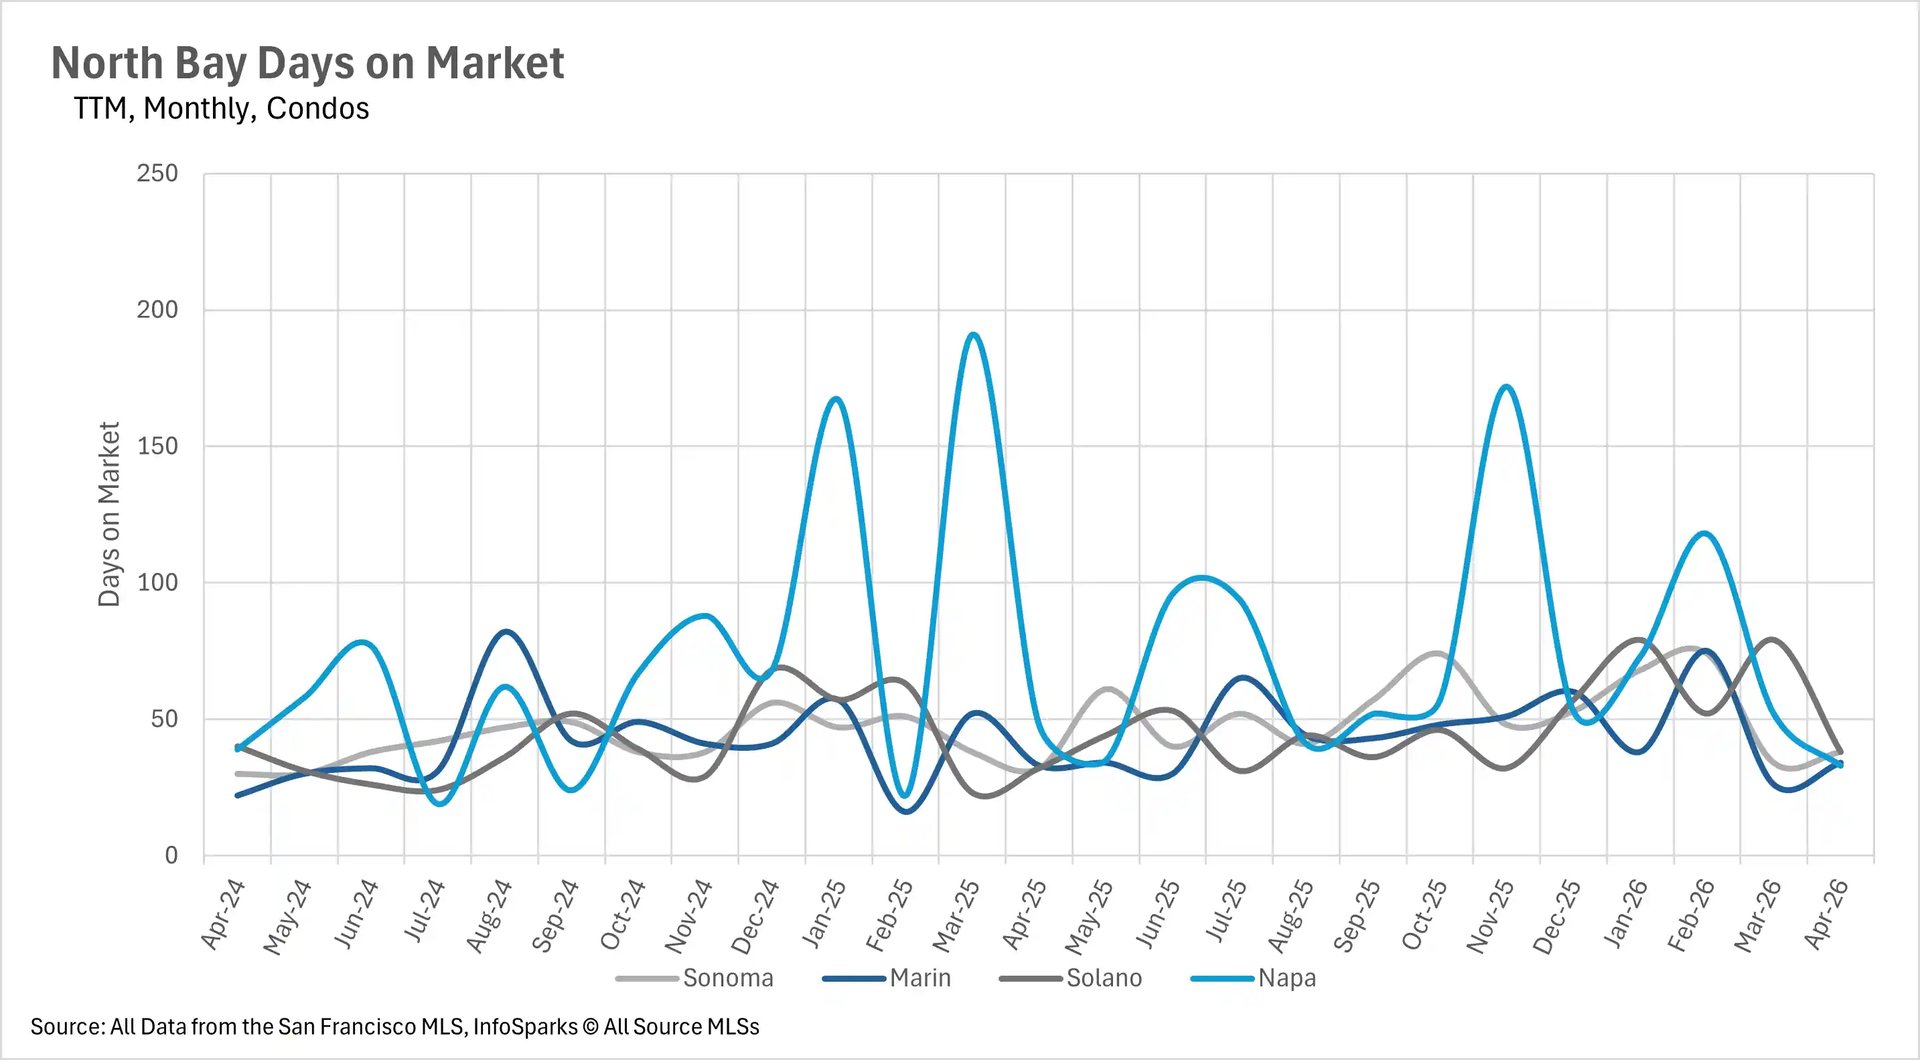
The condo market is a more complicated picture. San Francisco condos have seen one of the most dramatic transformations, selling in just 14 days compared to 33 days last April, a 57.58% year-over-year decline. However, Santa Clara County condos are spending 46.67% more time on the market than last year, and San Mateo County condos are up 13.64%. The lone bright spot outside of San Francisco is Santa Cruz County, where condo days on market actually improved by 3.33% compared to last April.

Sellers dominate the single-family market while condo buyers gain leverage

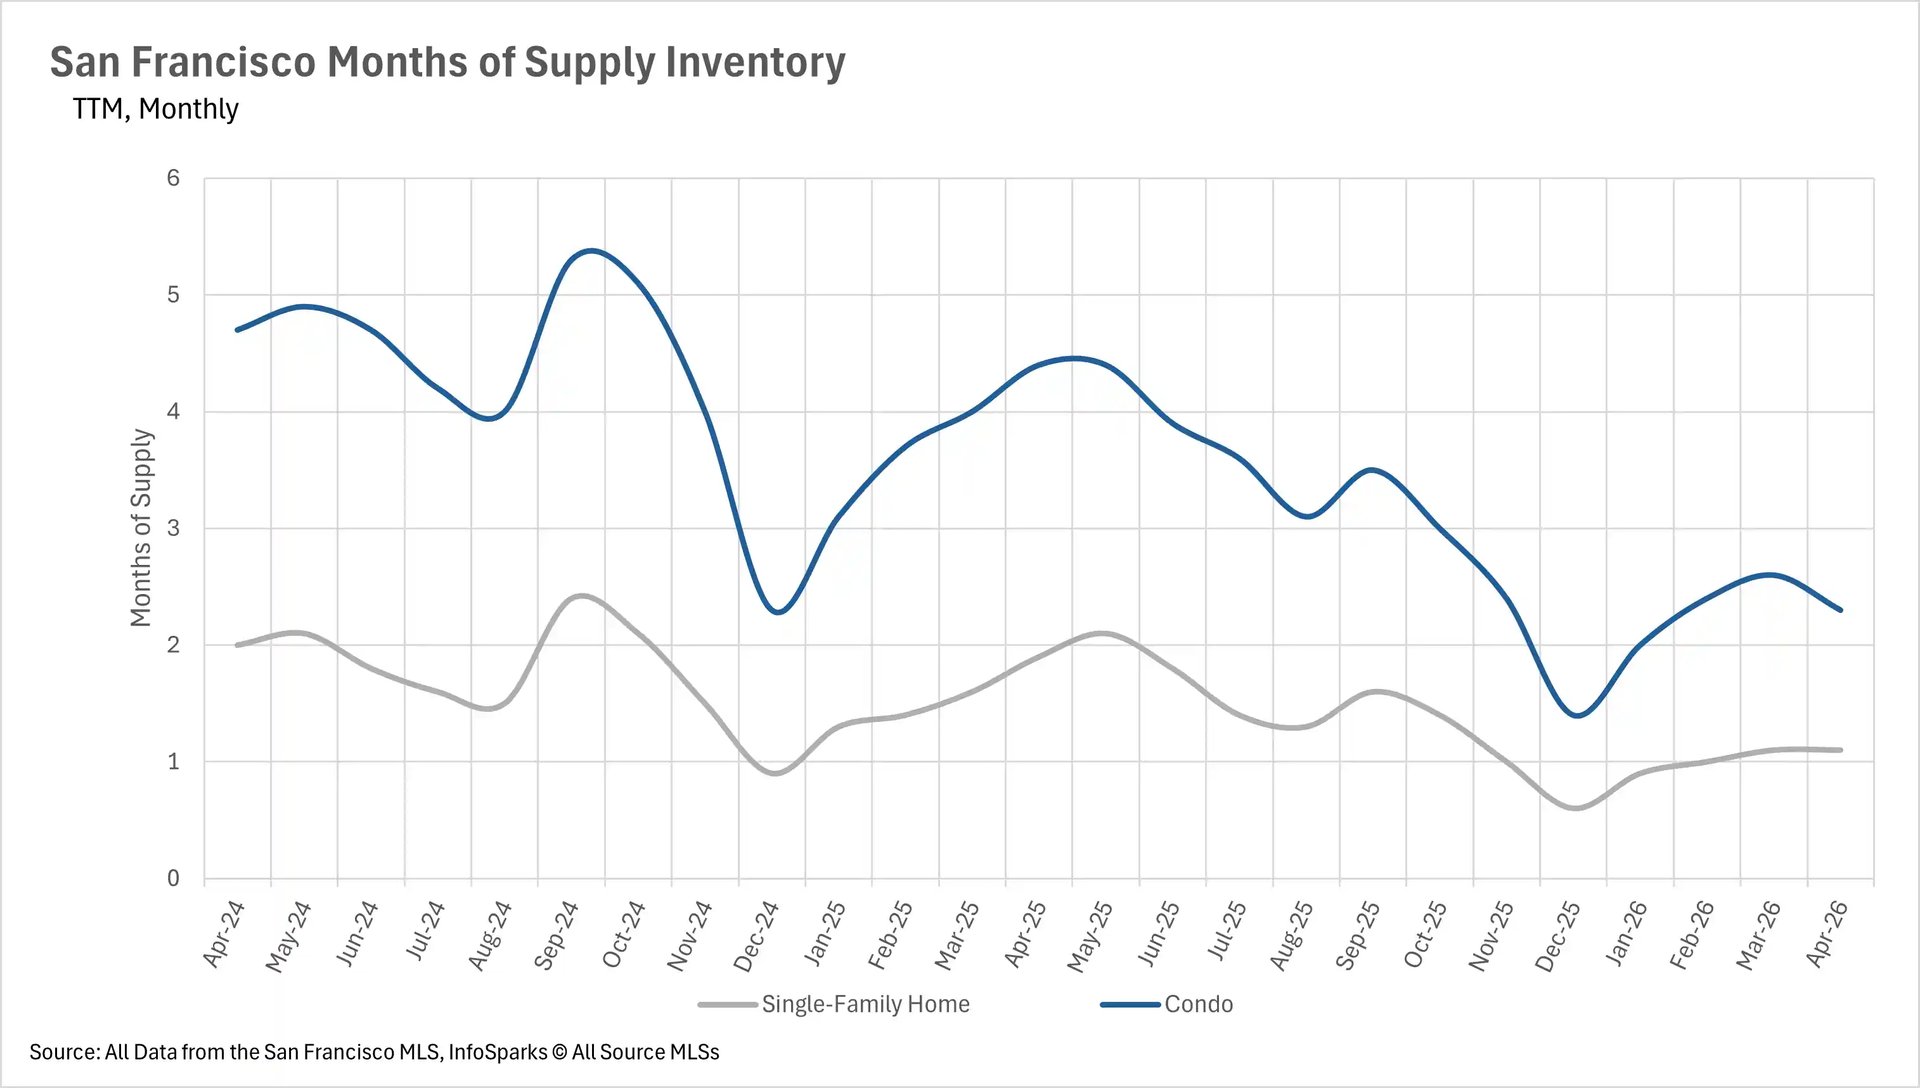
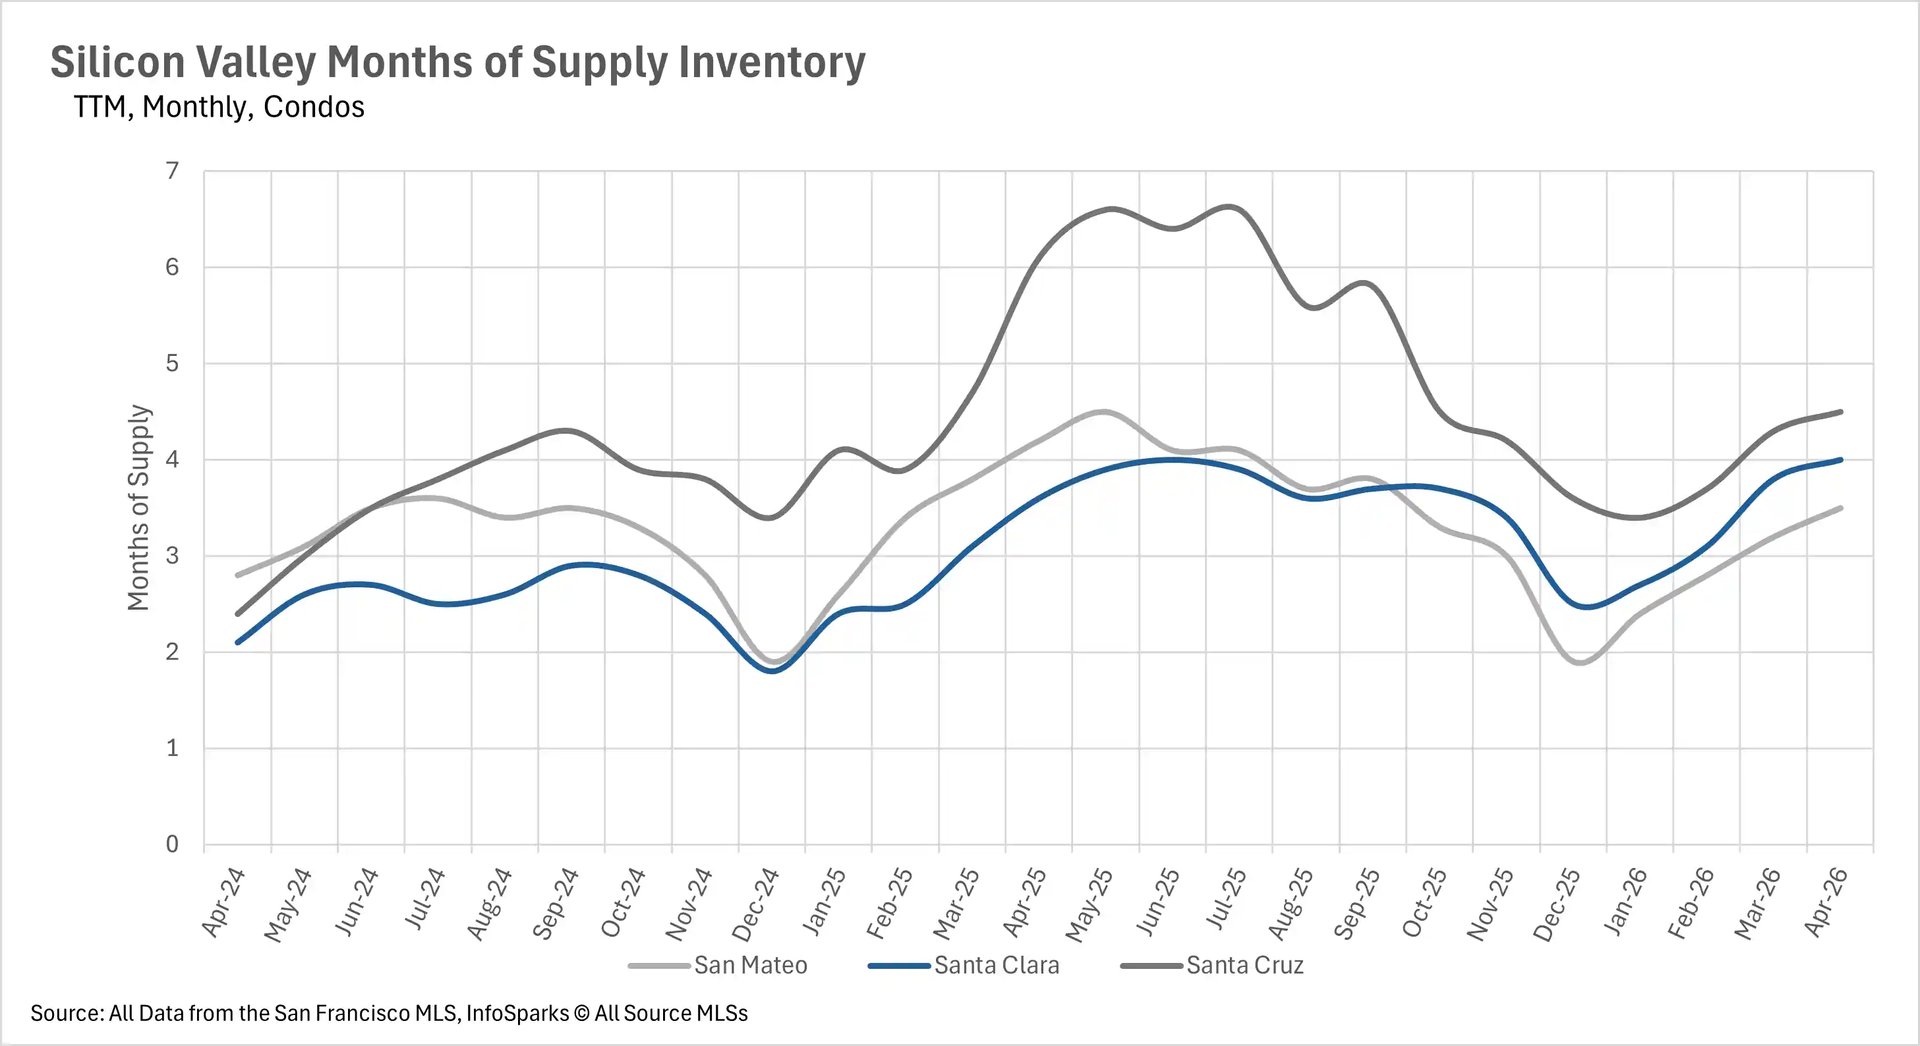
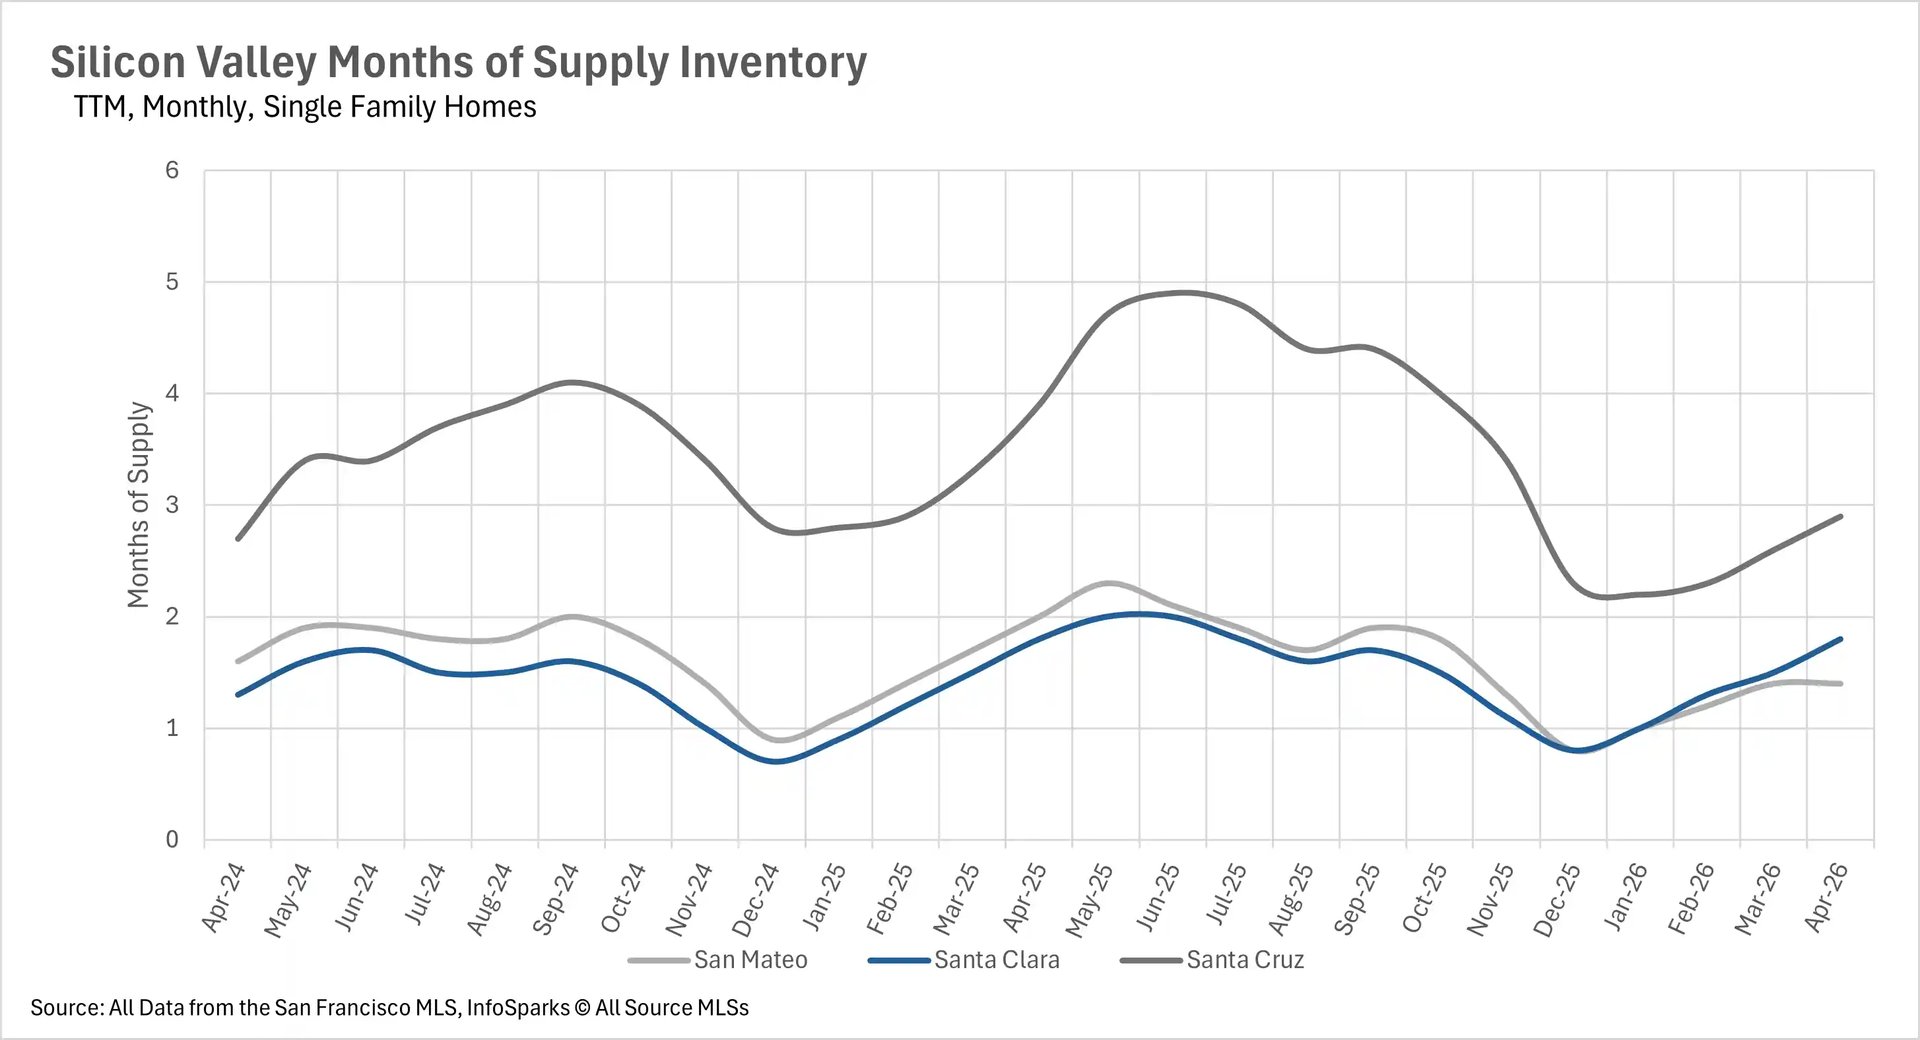
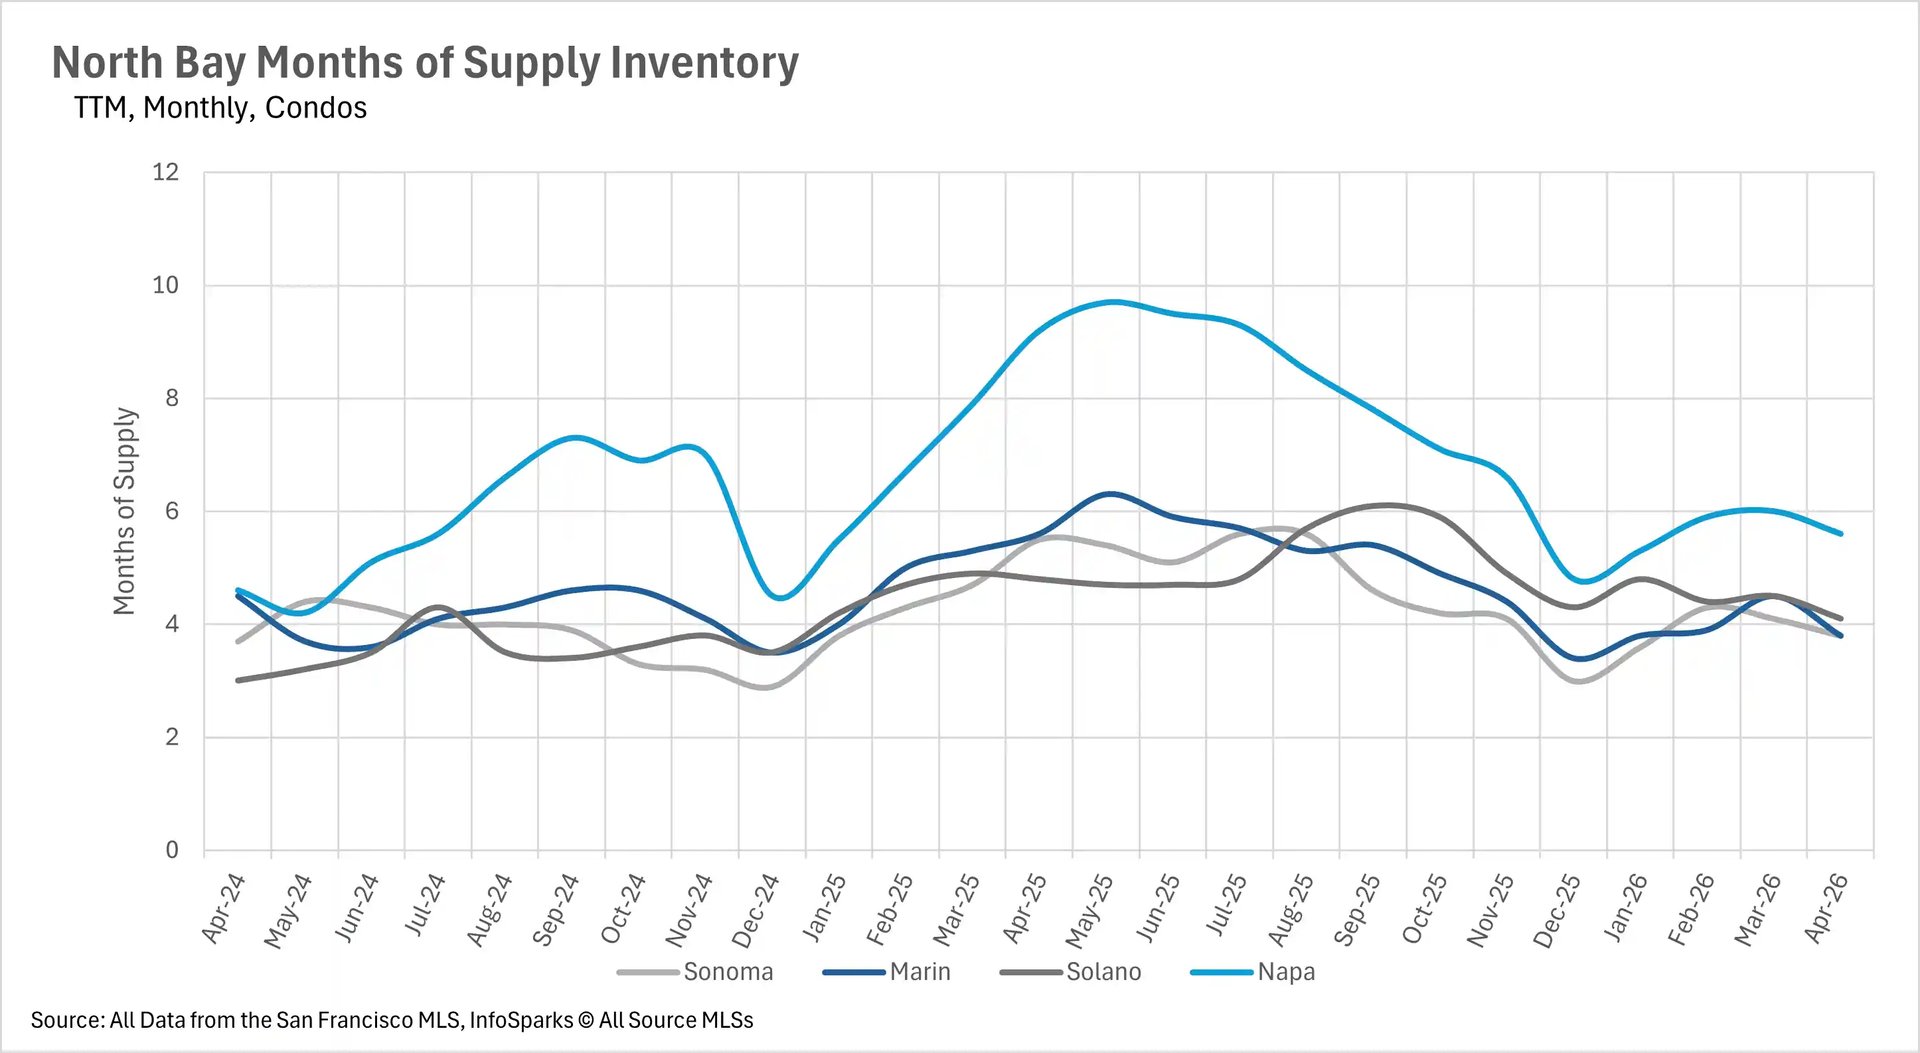
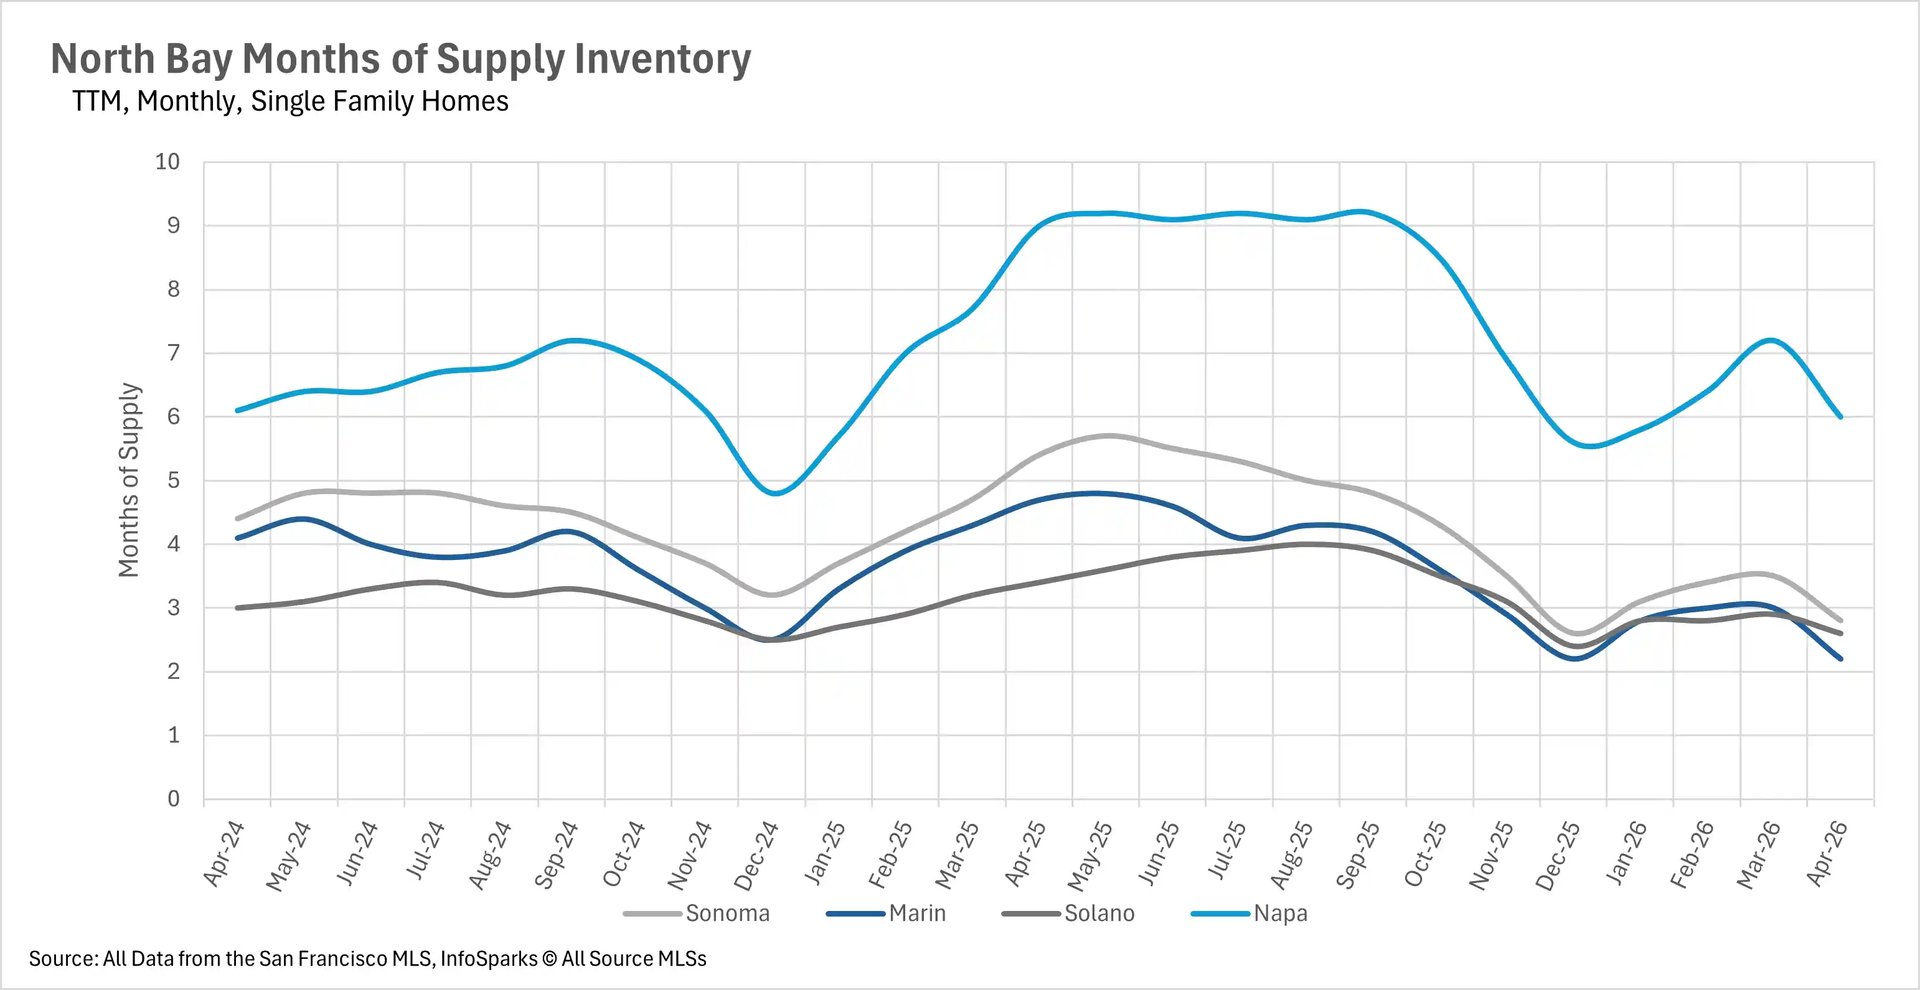
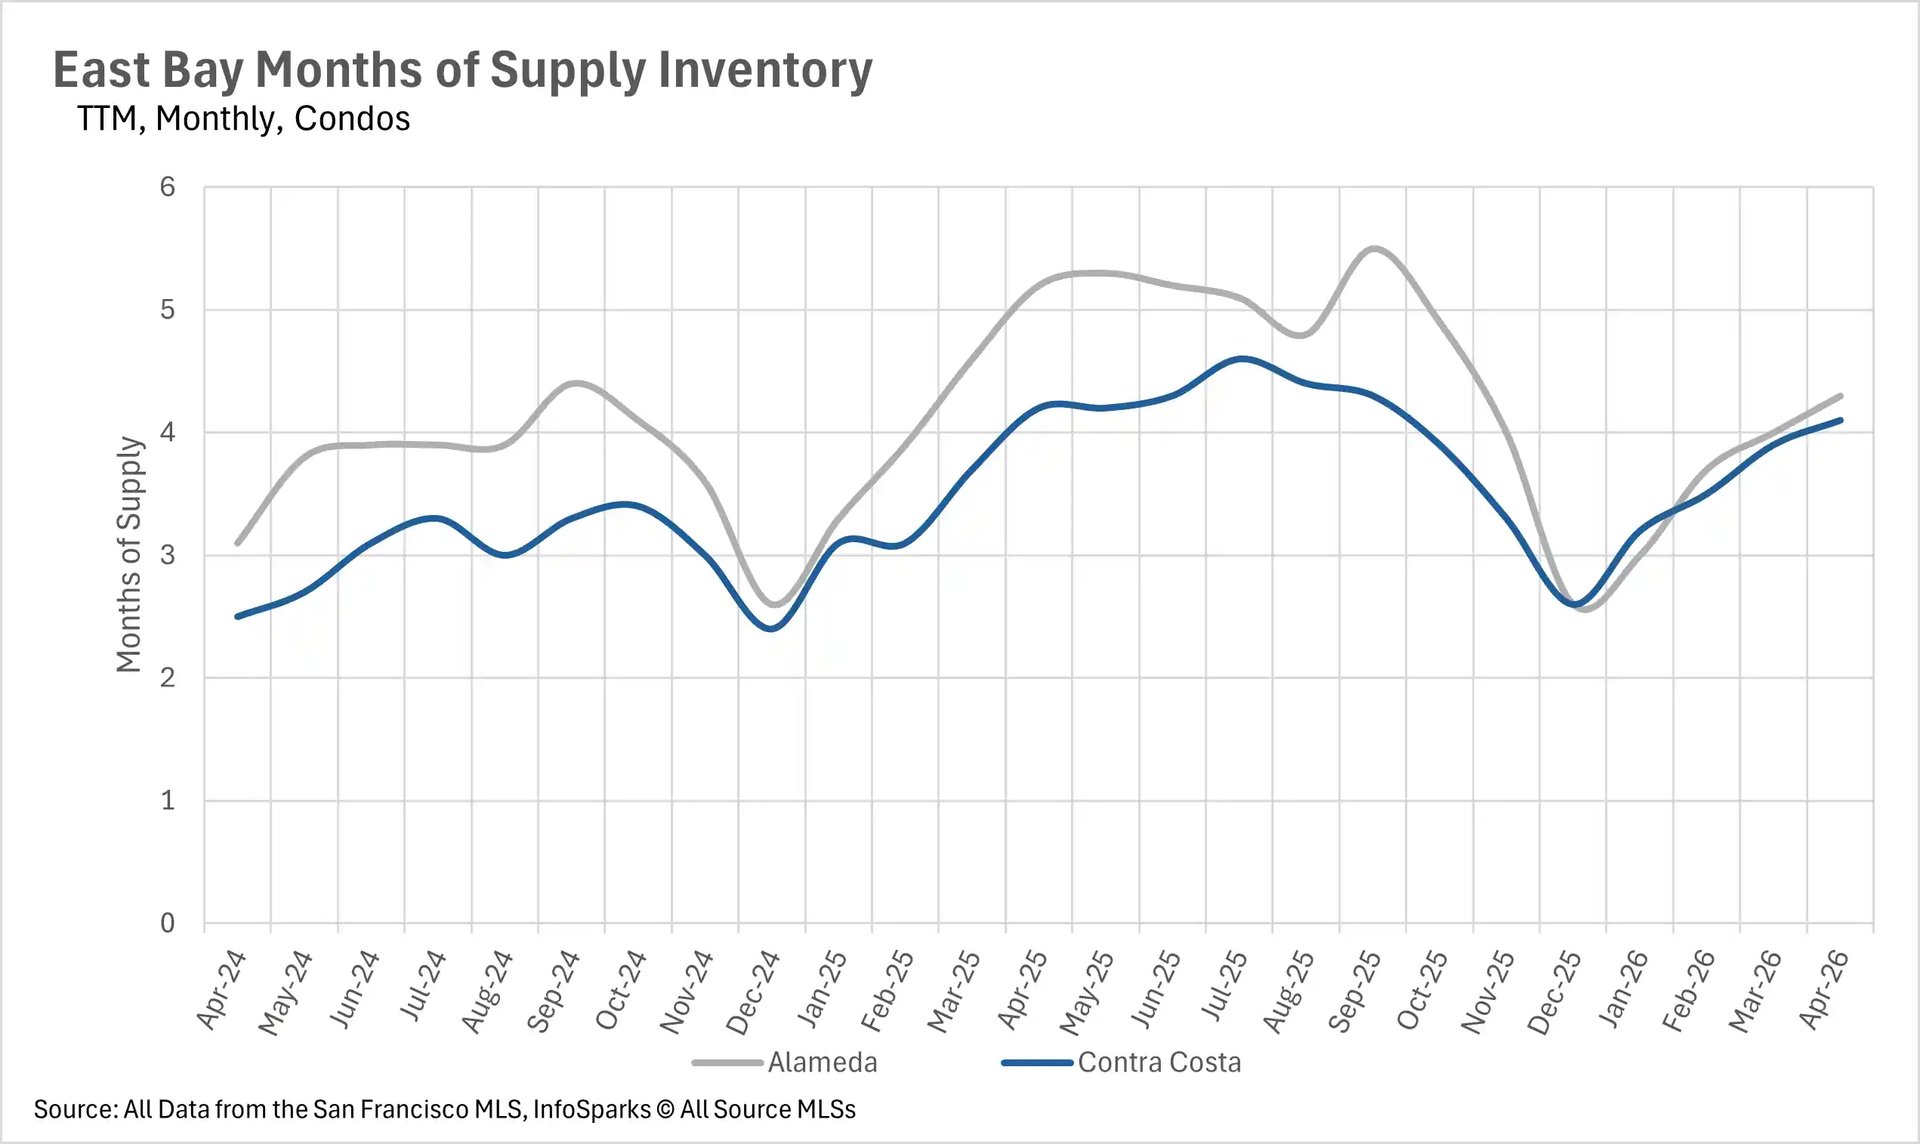
When determining whether a market is a buyers' market or a sellers' market, we look at the Months of Supply Inventory (MSI) metric. The state of California has historically averaged around three months of MSI, so any area with at or around three months of MSI is considered a balanced market. Any market that has less than three months of MSI is considered a seller's market, whereas markets with more than three months of MSI are considered a buyers' market.

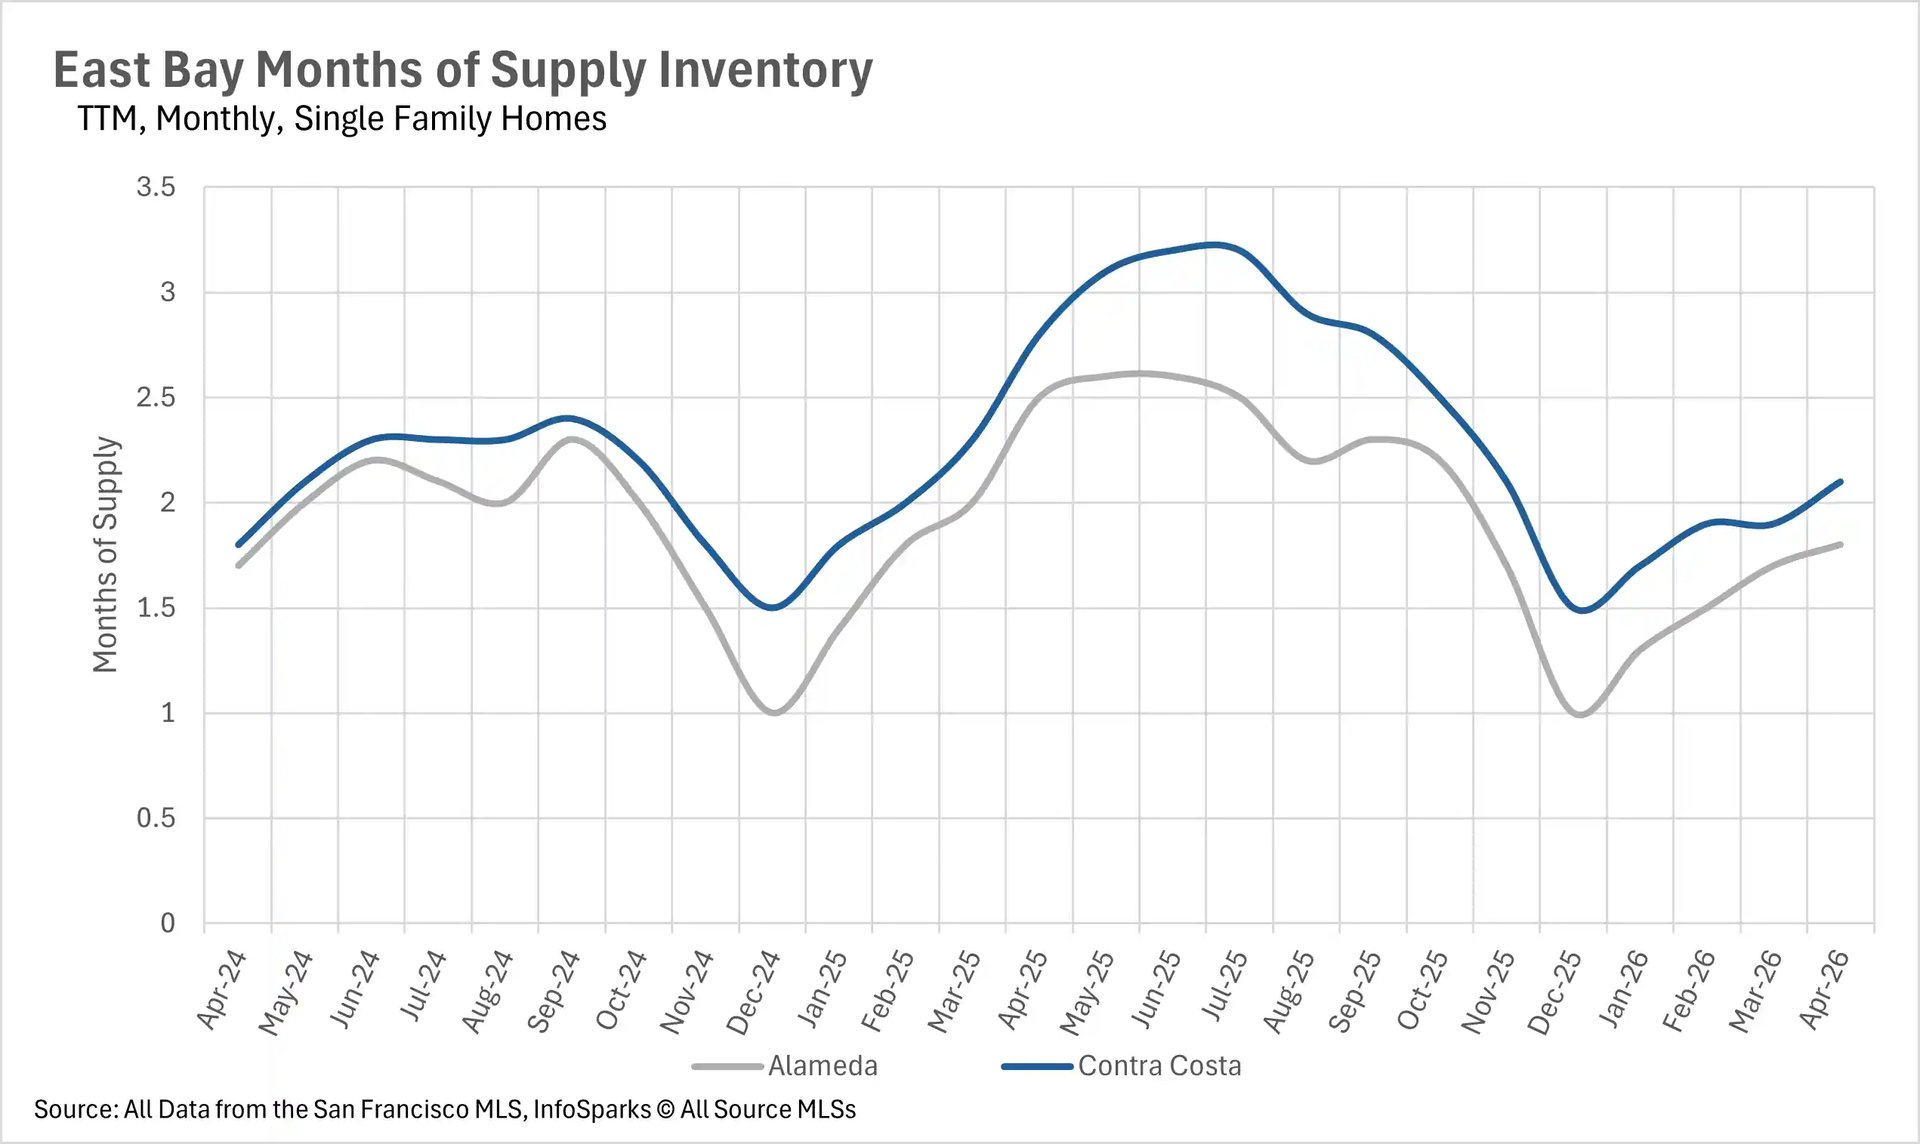
The single-family home market remains firmly in place eller's territory across the Bay Area. San Francisco has just 1.1 months of supply, while San Mateo County sits at 1.4 months and Santa Clara County at 1.8 months. Alameda County has 1.8 months, Contra Costa County 2.1 months, Marin County 2.2 months, Solano County 2.6 months, Sonoma County 2.8 months, and Santa Cruz County 2.9 months. Napa County remains the lone outlier at 6 months, although this still represents a 33.33% year-over-year decline. The condo market, however, has shifted decisively in favor of buyers in several areas. Alameda County has 4.3 months of condo supply, Contra Costa County 4.1 months, Santa Cruz County 4.5 months, Santa Clara County 4 months, and Napa County 5.6 months. San Francisco's condo market has bucked this trend entirely, transforming from a buyer's market last April at 4.4 months to a strong seller's market today at just 2.3 months. The growing divide between the single-family and condo markets remains one of the most defining characteristics of the Bay Area heading into the summer months.

Local Lowdown Data

Line chart displaying San Francisco median real estate prices over a three-year monthly period, comparing price trends between single-family homes and condos.

Bar chart illustrating San Francisco median real estate price changes year-over-year, showing percentage fluctuations for both single-family homes and condos.

Line graph tracking the average percentage of the original list price received in San Francisco over a three-year period, comparing single-family homes and condos.

Combination chart tracking two-year monthly condo inventory in San Francisco, detailing the volume of new listings, sold listings, and total active condos for sale.

Combination chart tracking two-year monthly single-family home inventory in San Francisco, highlighting the volume of new listings, sold units, and total active housing supply.

Line graph of San Francisco months of supply housing inventory, showing market saturation trends for single-family homes versus condos.

Line graph tracking the average days on market in San Francisco, comparing the speed of real estate sales between single-family homes and condos.

Line chart displaying Silicon Valley median condo prices over a three-year monthly period, comparing real estate trends in San Mateo, Santa Clara, and Santa Cruz counties.

Line chart showing Silicon Valley median single-family home prices over a three-year period, tracking values across San Mateo, Santa Clara, and Santa Cruz counties.

Bar chart illustrating year-over-year median condo price changes in Silicon Valley, comparing percentage fluctuations for the San Mateo, Santa Clara, and Santa Cruz markets.

Bar chart showing year-over-year median single-family home price percentage changes for Silicon Valley real estate markets across San Mateo, Santa Clara, and Santa Cruz.

Combination chart tracking two-year monthly condo inventory in Silicon Valley, detailing the volume of new listings, sold listings, and total active homes for sale.

Combination chart tracking two-year monthly single-family home inventory in Silicon Valley, highlighting the volume of new listings, sold units, and total active housing supply.

Line graph depicting months of supply inventory for Silicon Valley condos, comparing market saturation and supply levels in San Mateo, Santa Clara, and Santa Cruz.

Line graph showing months of supply housing inventory for Silicon Valley single-family homes, tracking market balance across San Mateo, Santa Clara, and Santa Cruz.

Line graph tracking the average days on market for condos in Silicon Valley, comparing the speed of real estate sales in San Mateo, Santa Clara, and Santa Cruz.

Line graph tracking the average days on market for single-family homes in Silicon Valley, comparing sales cycles and buyer velocity for San Mateo, Santa Clara, and Santa Cruz counties.

Line chart displaying North Bay median condo prices over a three-year monthly period, comparing real estate trends in Sonoma, Marin, Solano, and Napa counties.

Line chart showing North Bay median single-family home prices over a three-year period, tracking values across Sonoma, Marin, Solano, and Napa counties.

Bar chart illustrating year-over-year median condo price changes in the North Bay, comparing percentage fluctuations for the Sonoma, Marin, Solano, and Napa markets.

Bar chart showing year-over-year median single-family home price percentage changes for North Bay real estate markets across Sonoma, Marin, Solano, and Napa.

Combination chart tracking two-year monthly condo inventory in the North Bay, detailing the volume of new listings, sold listings, and total active homes for sale.

Combination chart tracking two-year monthly single-family home inventory in the North Bay, highlighting the volume of new listings, sold units, and total active housing supply.

Line graph depicting months of supply inventory for North Bay condos, comparing market saturation and supply levels in Sonoma, Marin, Solano, and Napa counties.

Line graph showing months of supply housing inventory for North Bay single-family homes, tracking market balance across Sonoma, Marin, Solano, and Napa counties.

Line graph tracking the average days on market for condos in the North Bay, comparing the speed of real estate sales in Sonoma, Marin, Solano, and Napa counties.

Line graph tracking the average days on market for single-family homes in the North Bay, comparing sales cycles and buyer velocity for Sonoma, Marin, Solano, and Napa counties.

Line chart displaying East Bay median condo prices over a three-year monthly period, comparing real estate trends in Alameda and Contra Costa counties.

Line chart showing East Bay median single-family home prices over a three-year period, tracking values across Alameda and Contra Costa counties.

Bar chart illustrating year-over-year median condo price changes in the East Bay, comparing percentage fluctuations for the Alameda and Contra Costa real estate markets.

Bar chart showing year-over-year median single-family home price percentage changes for East Bay real estate markets across Alameda and Contra Costa counties.

Combination chart tracking two-year monthly condo inventory in the East Bay, detailing the volume of new listings, sold listings, and total active homes for sale.

Combination chart tracking two-year monthly single-family home inventory in the East Bay, highlighting the volume of new listings, sold units, and total active housing supply.

Line graph depicting months of supply inventory for East Bay condos, comparing market saturation and supply levels in Alameda and Contra Costa counties.

Line graph showing months of supply housing inventory for East Bay single-family homes, tracking market balance across Alameda and Contra Costa counties.

Line graph tracking the average days on market for condos in the East Bay, comparing the speed of real estate sales in Alameda and Contra Costa counties.

Line graph tracking the average days on market for single-family homes in the East Bay, comparing sales cycles and buyer velocity for Alameda and Contra Costa counties.

Let’s Talk

You’ve got questions and we can’t wait to answer them.

Follow Us on Instagram