The Local Lowdown
Quick Take:
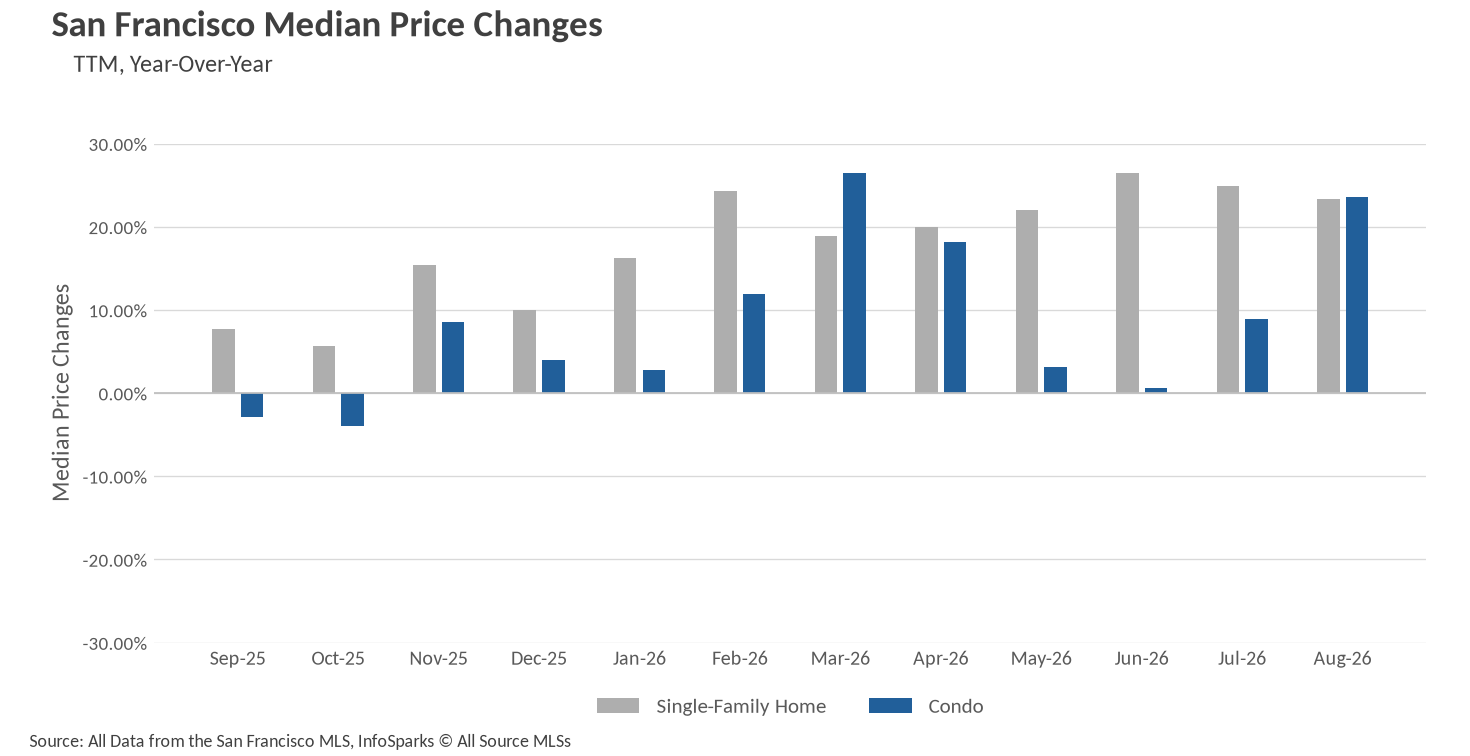
- Single-family prices told four different stories in August, with San Francisco up 23.33% and Marin up 15.83% year over year, while Sonoma, Solano, Napa, Santa Clara, and Santa Cruz Counties all slipped modestly below last August's levels.
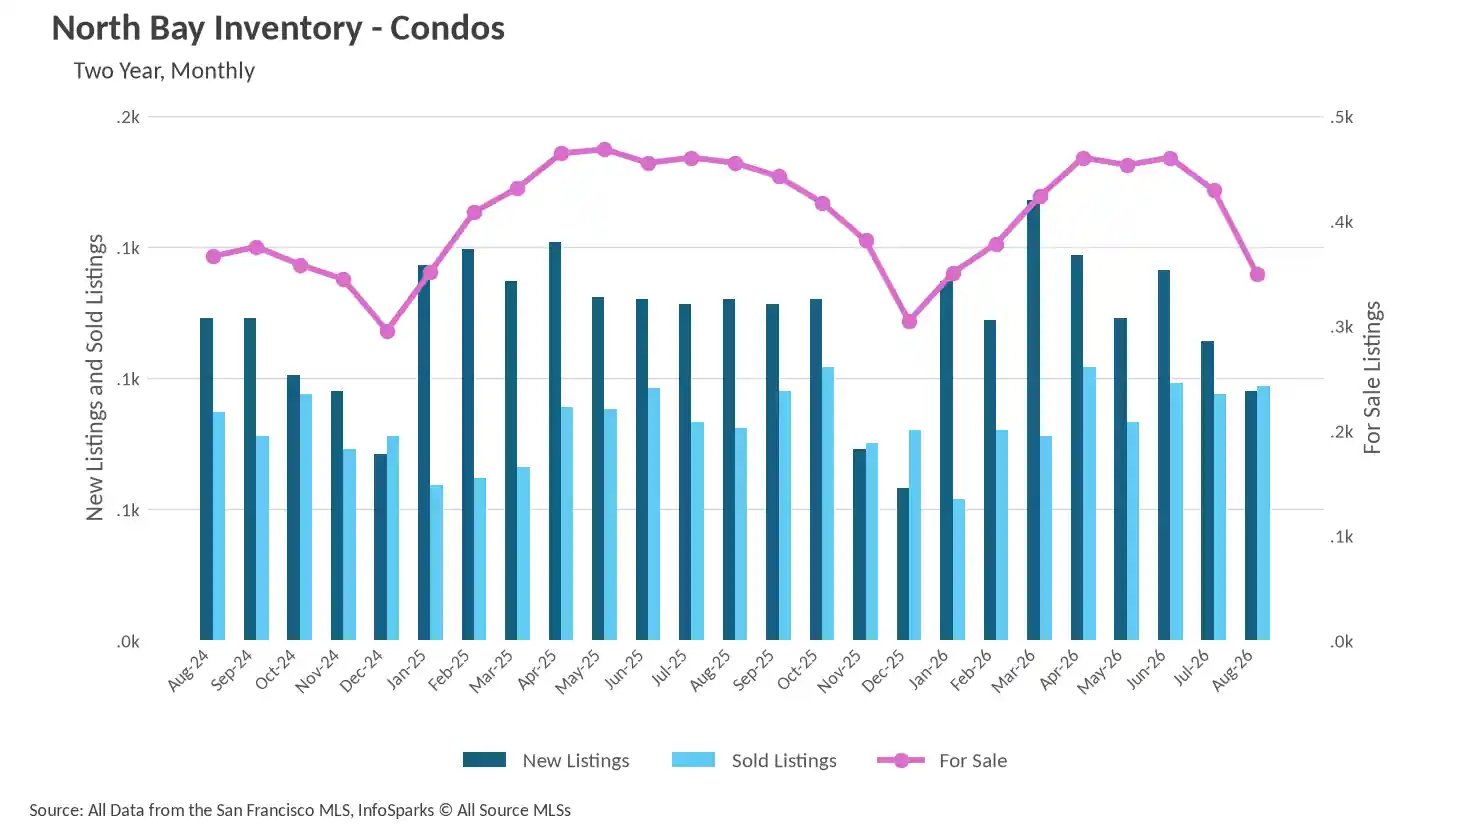
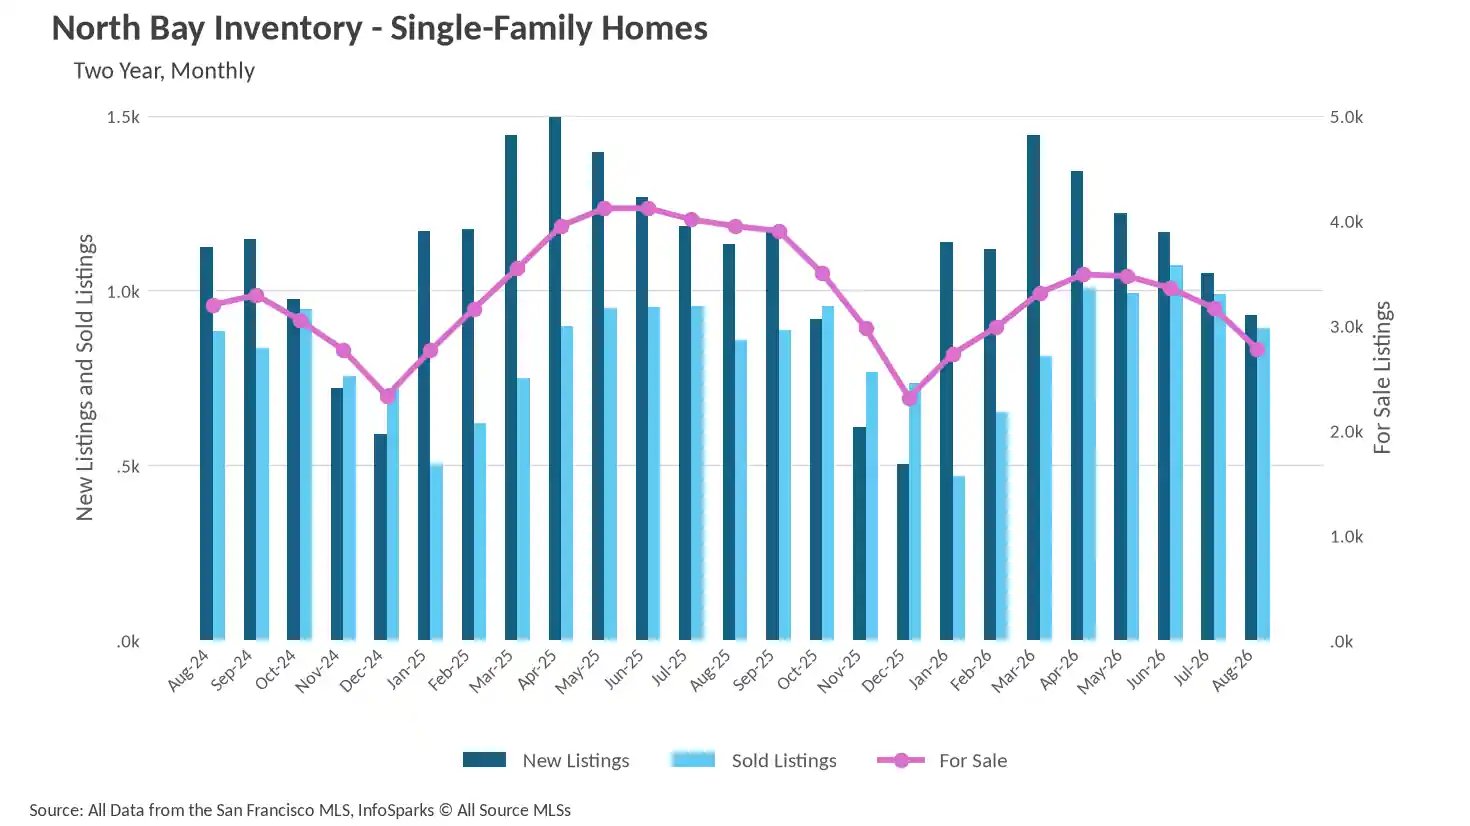
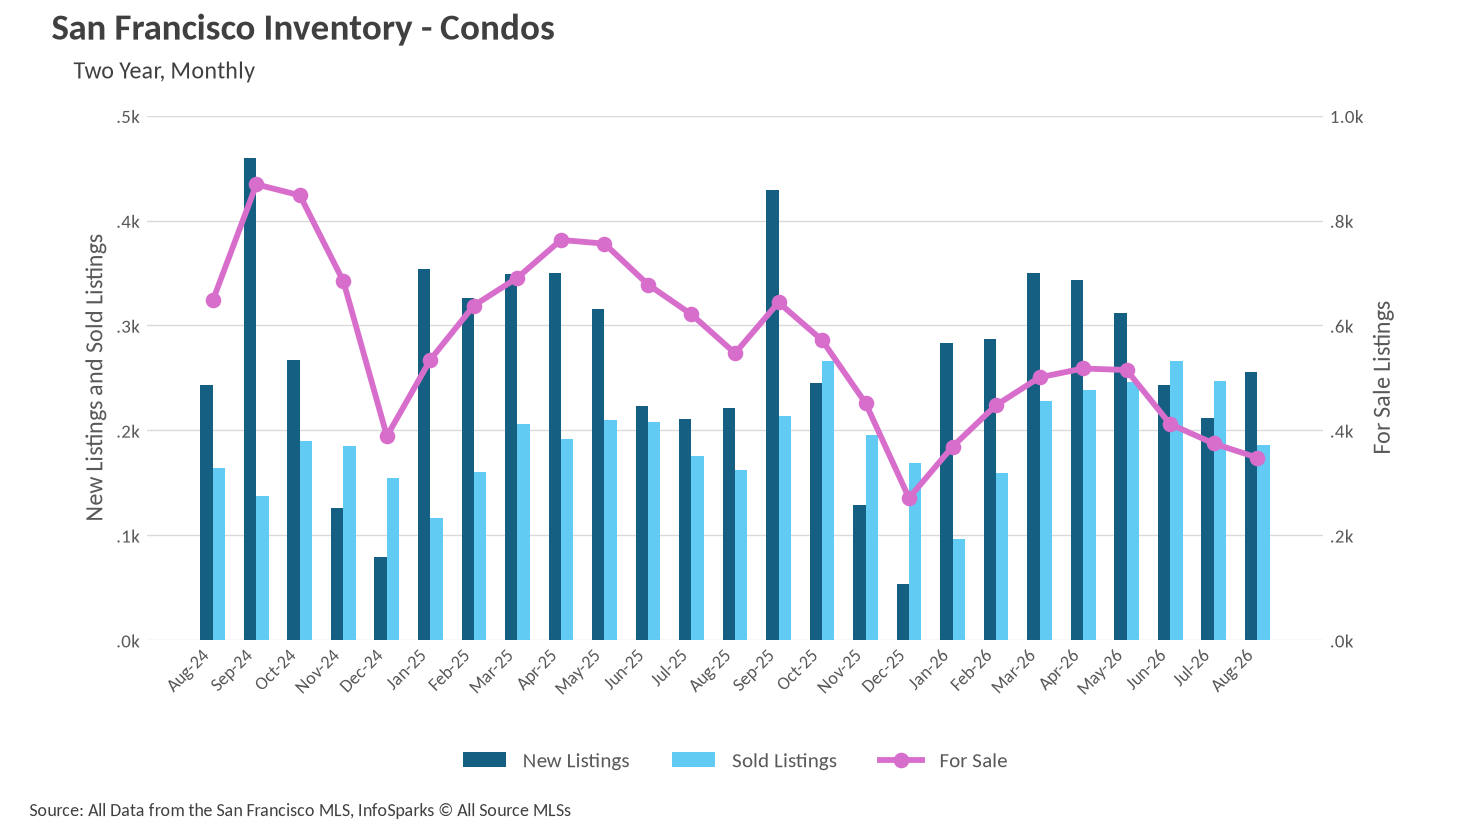
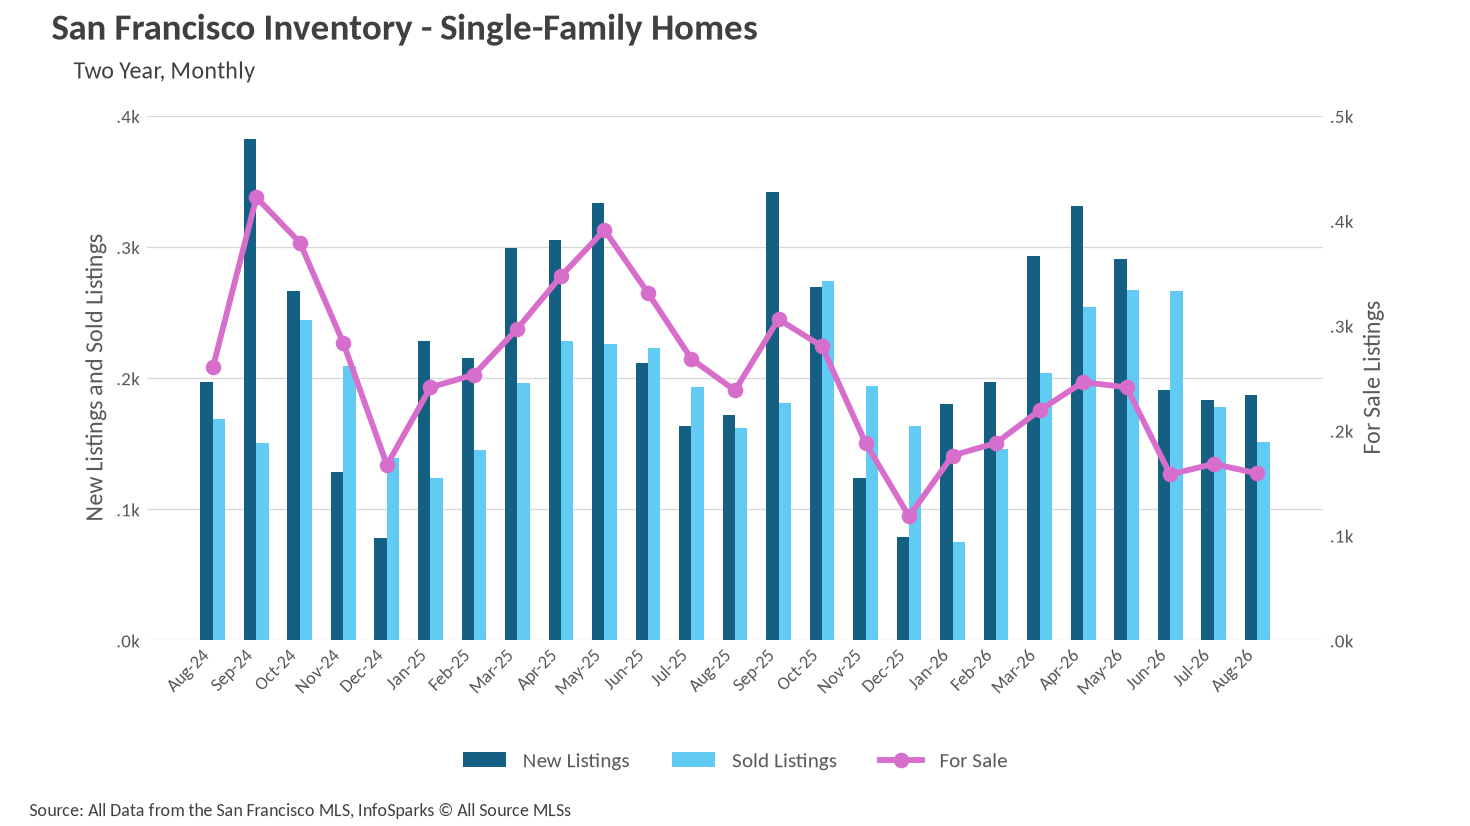
- Inventory contracted across every corner of the region, led by San Francisco's 33.19% single-family decline and the North Bay's 29.62% drop, with condo supply falling even faster in San Francisco and the North Bay.
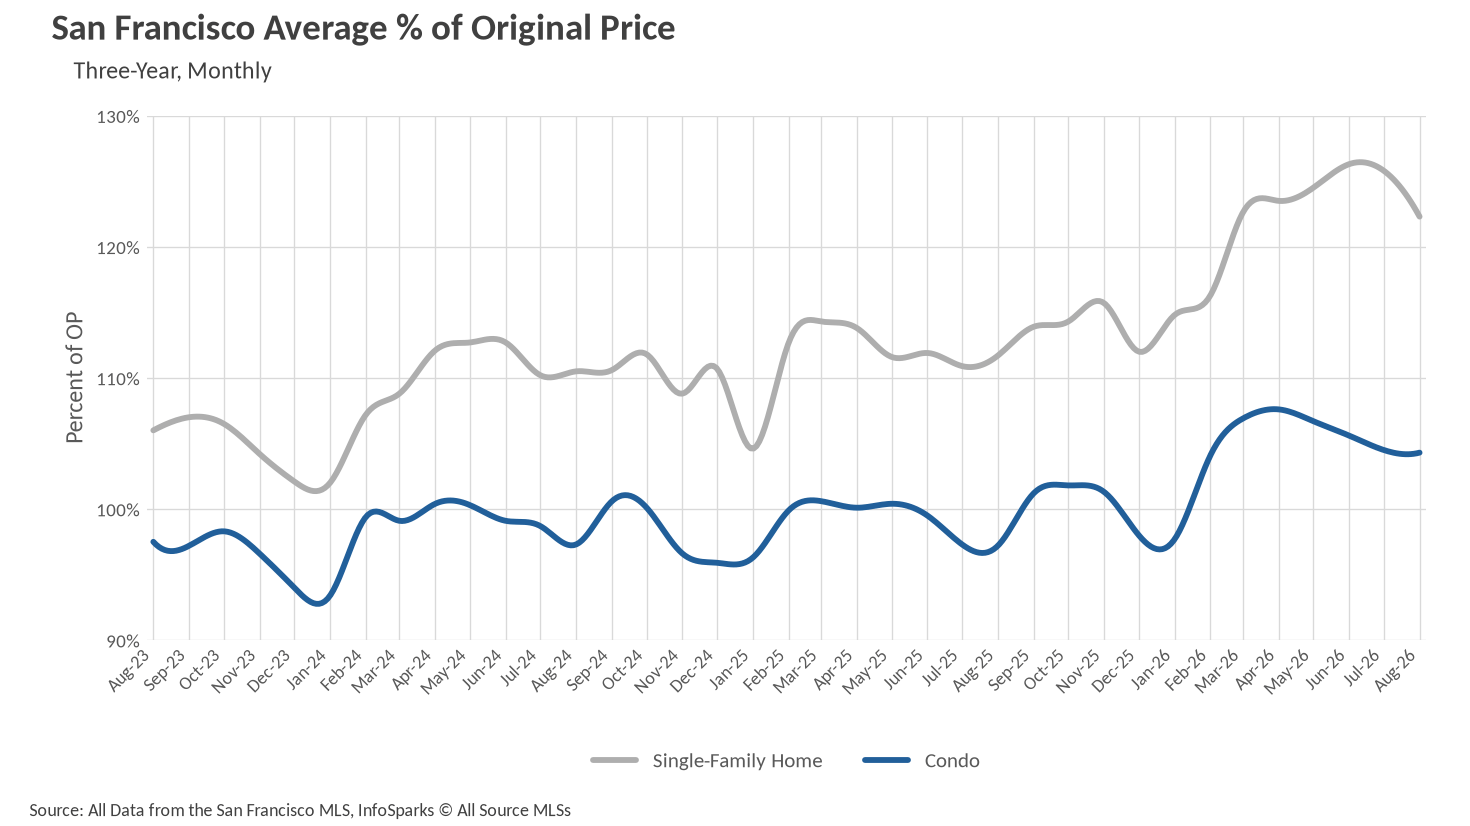
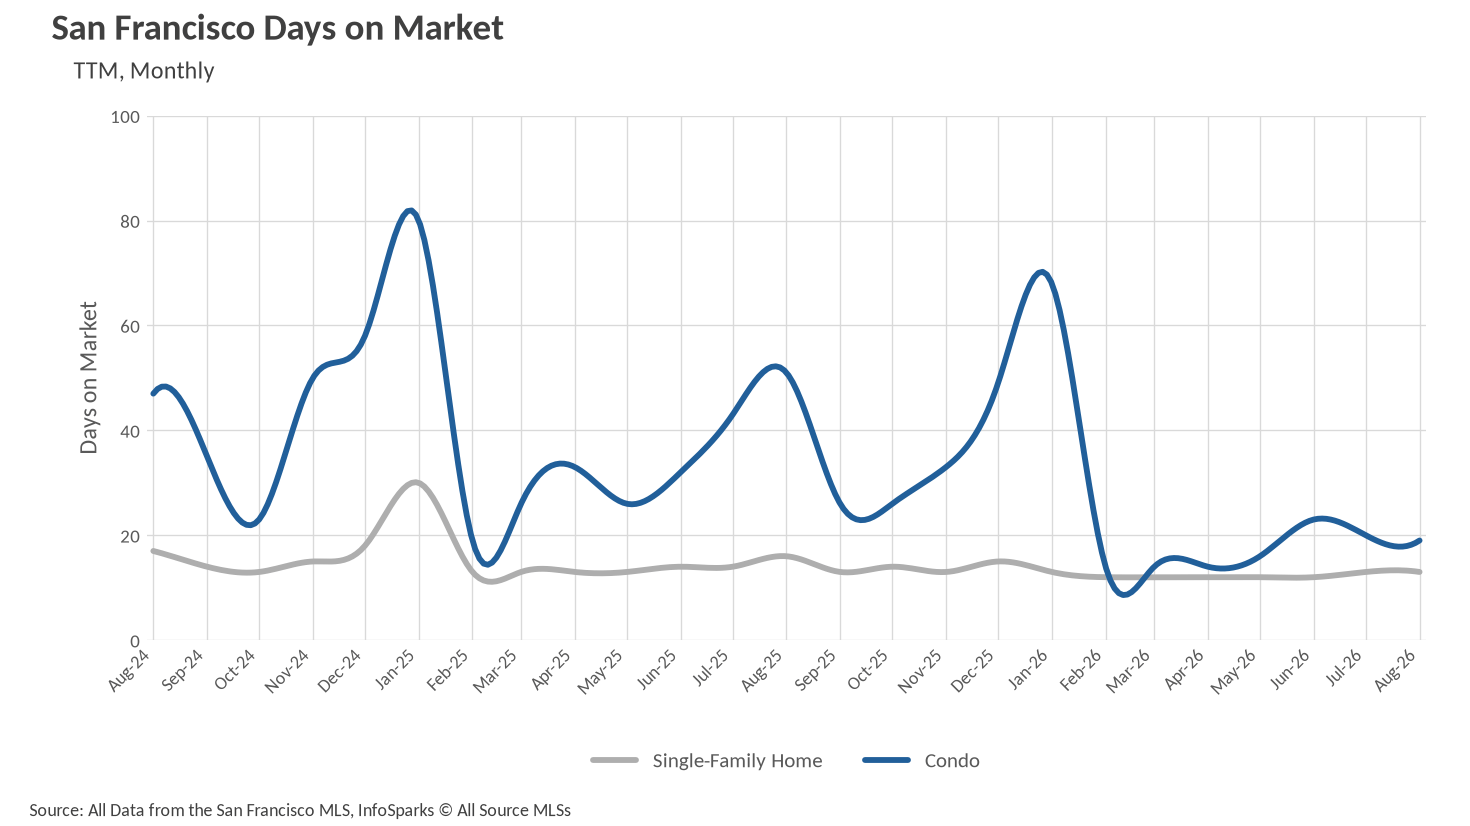
- Single-family homes are selling in roughly two weeks across the region's core markets, and San Francisco condos posted the year's most dramatic turnaround, closing in 19 days versus 51 last August.
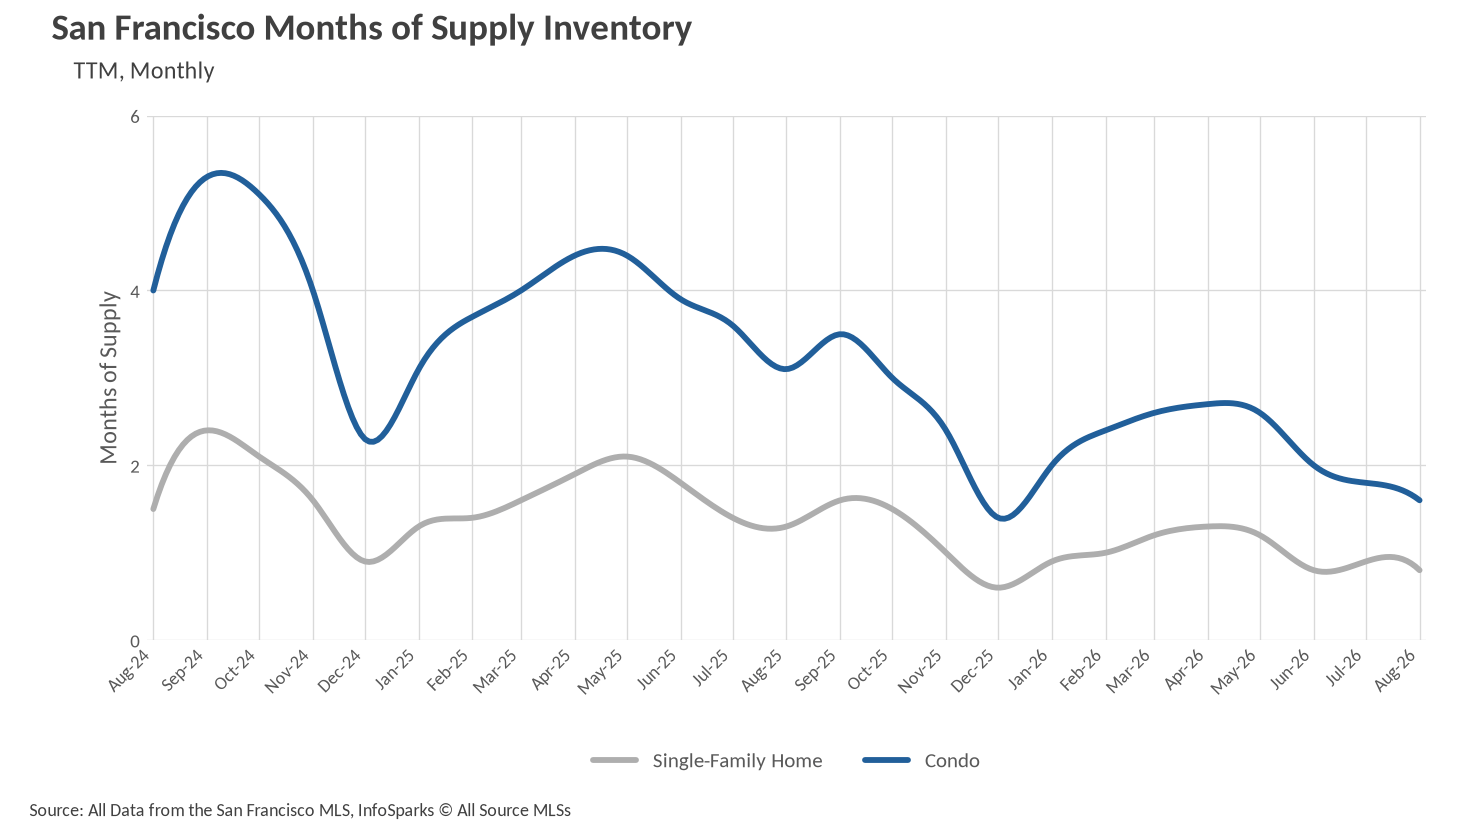
- Months of supply fell nearly everywhere, pushing San Francisco condos to 1.6 months and San Mateo County condos to 2.5 months, while East Bay and outer North Bay condos remain the last reliable pockets of buyer leverage.
Note: You can find the charts/graphs for the Local Lowdown at the end of this section.
A region of haves and holding steady
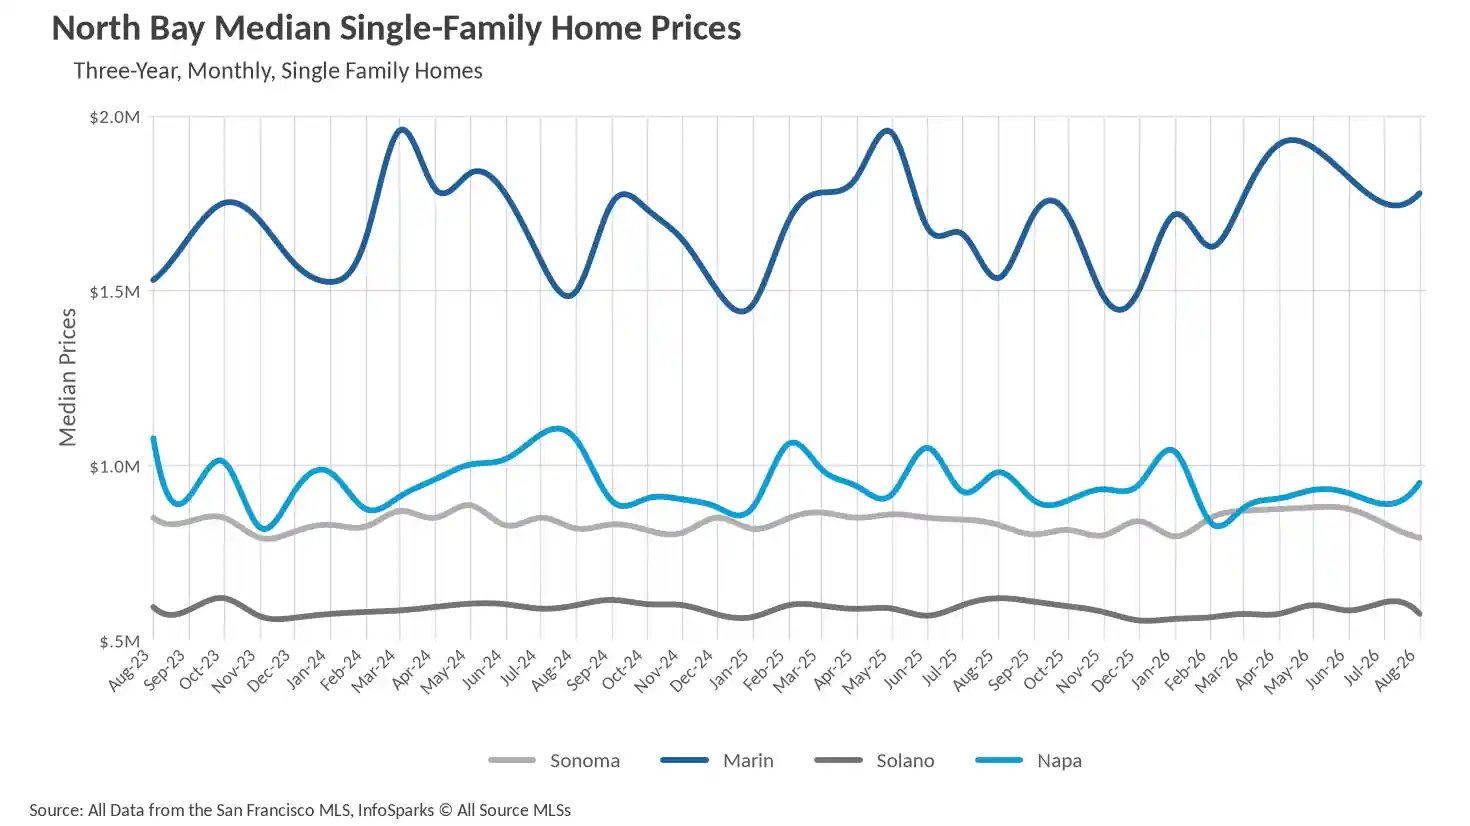
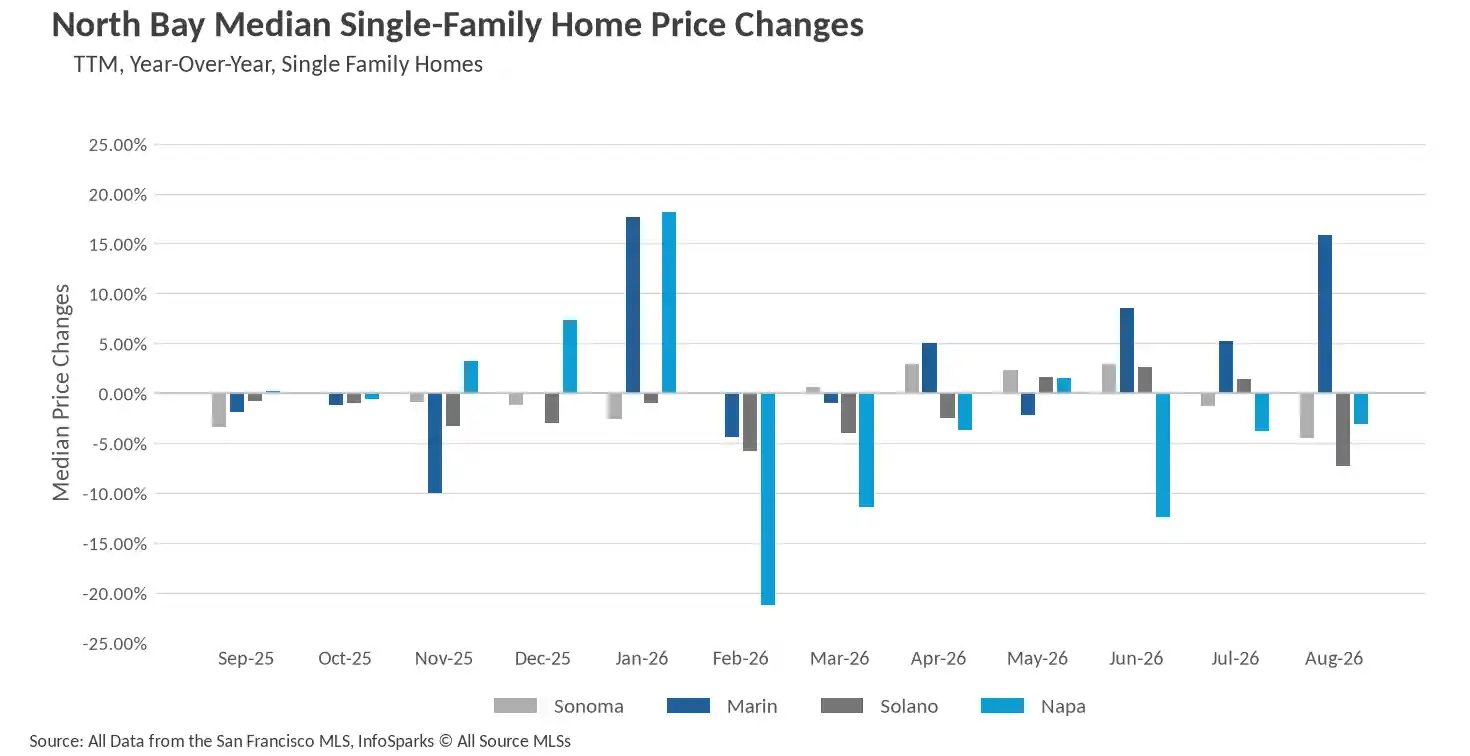
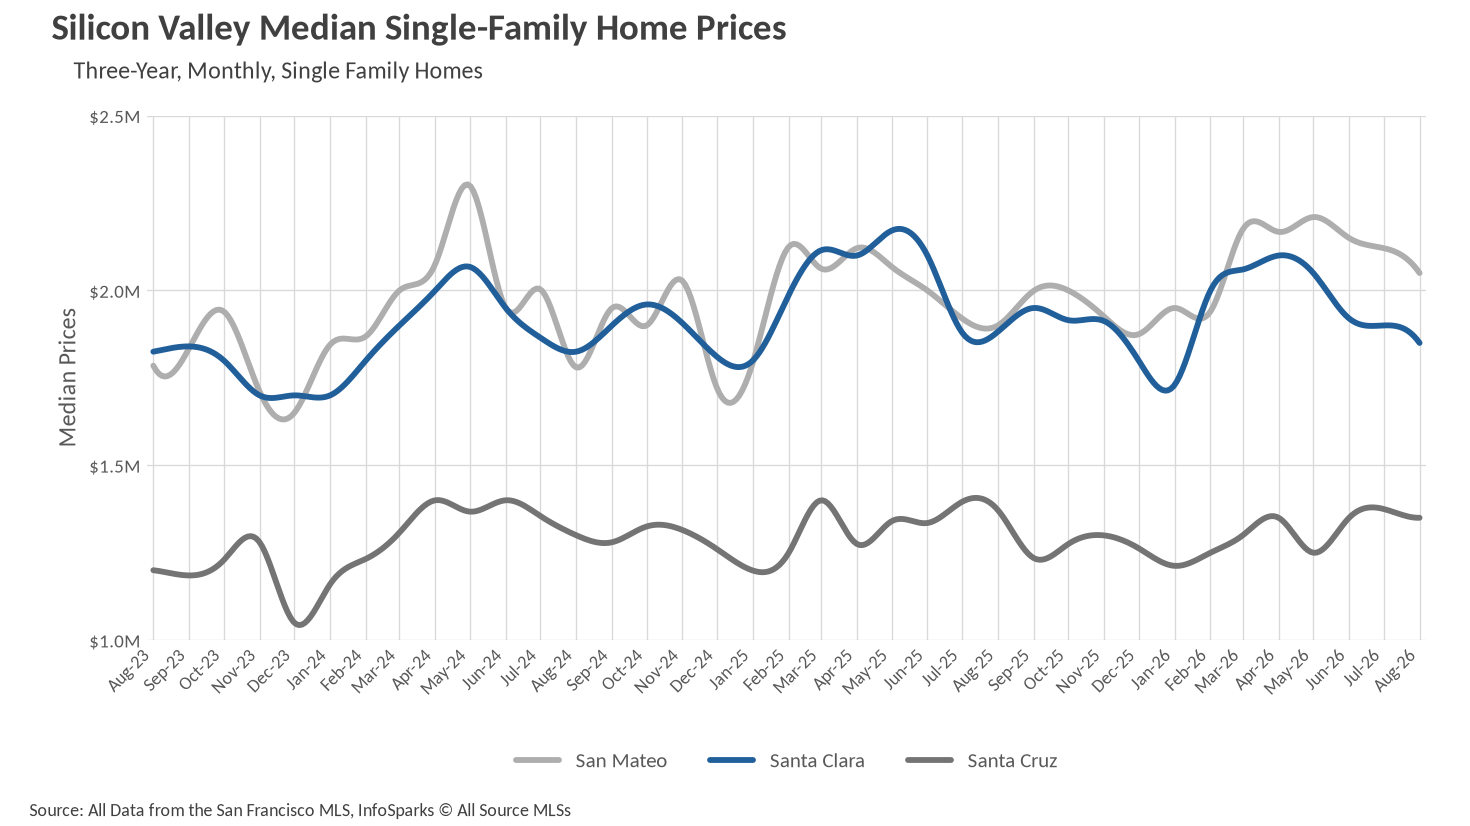
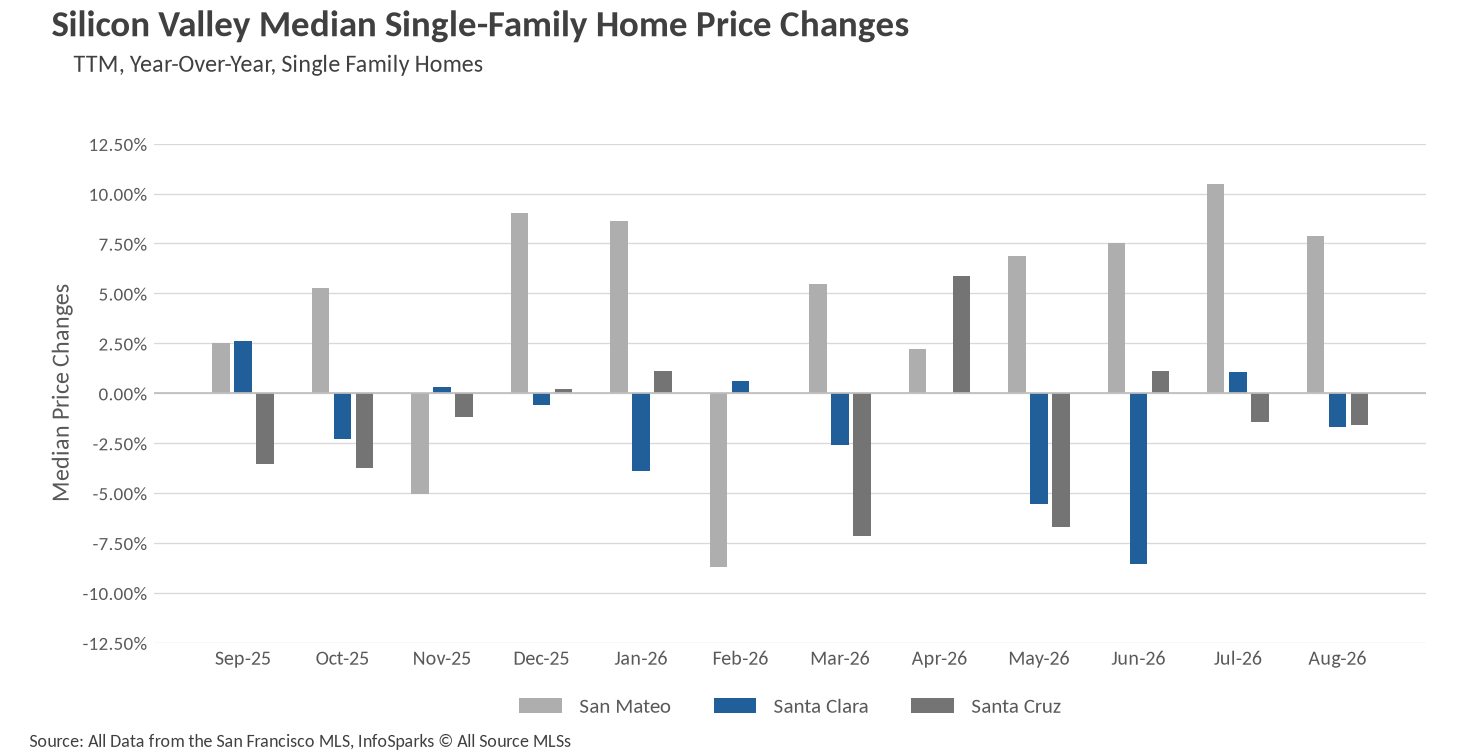
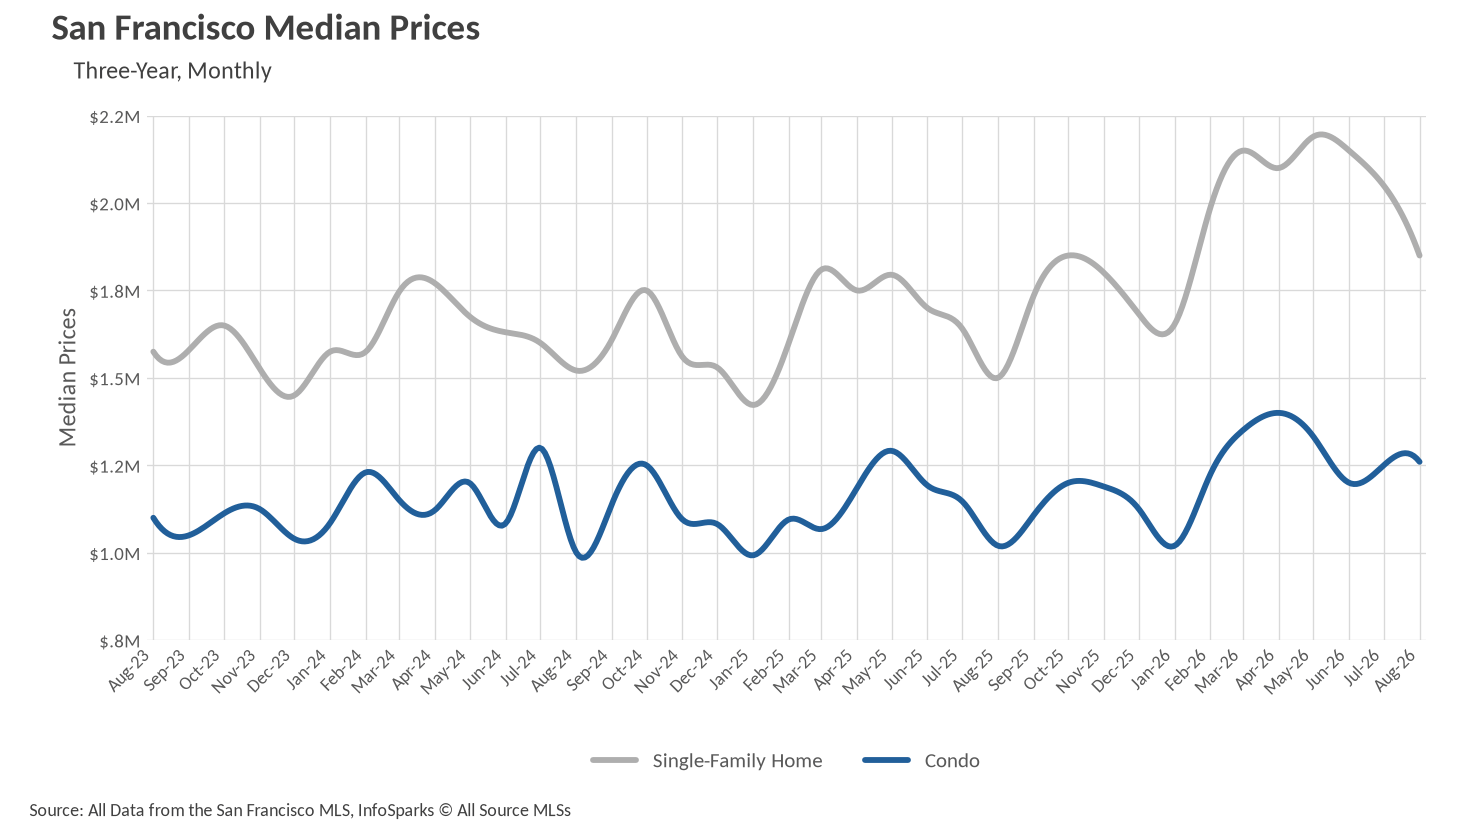
The Bay Area's August pricing map looked less like a single market and more like a collection of them. San Francisco led on annual growth, with the median single-family home at $1,850,000, up 23.33% from $1,500,000 last August, and Marin County was not far behind at $1,778,000, a 15.83% gain. San Mateo County held the region's high-water mark at $2,050,000, up 7.89% year over year and now six straight months above $1.9 million. Those three markets carried the headline growth for the entire region.
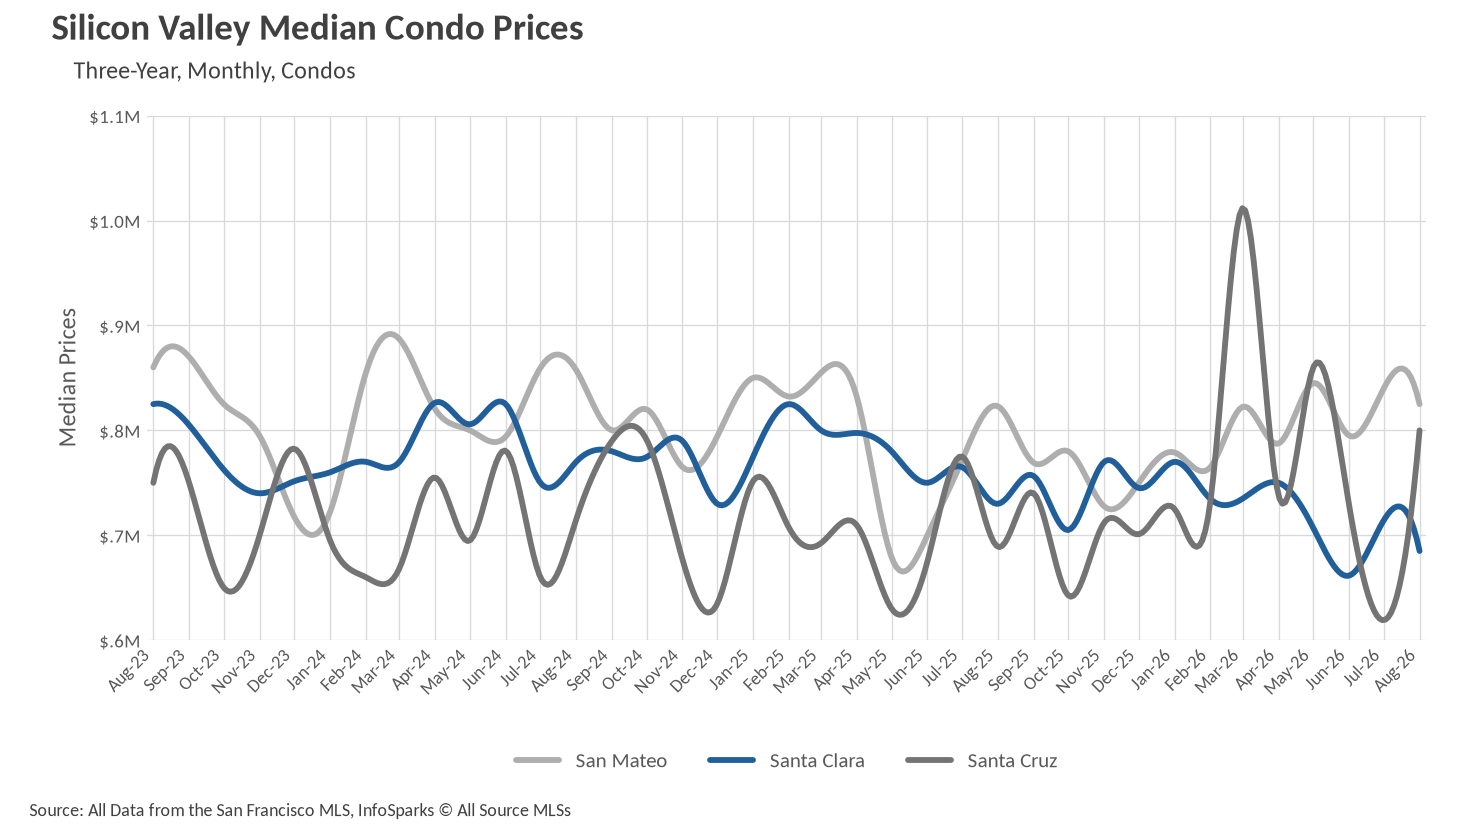
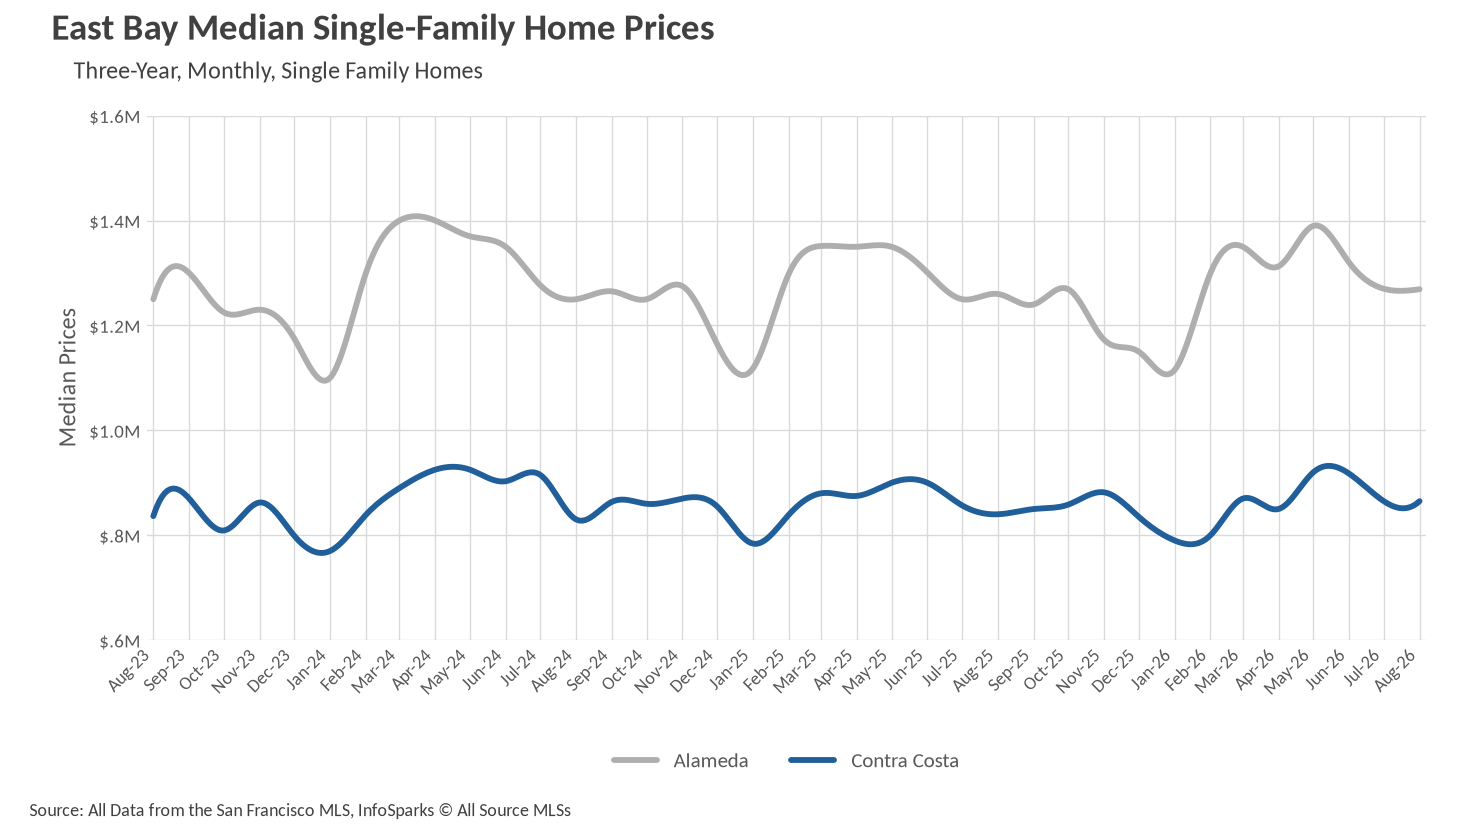
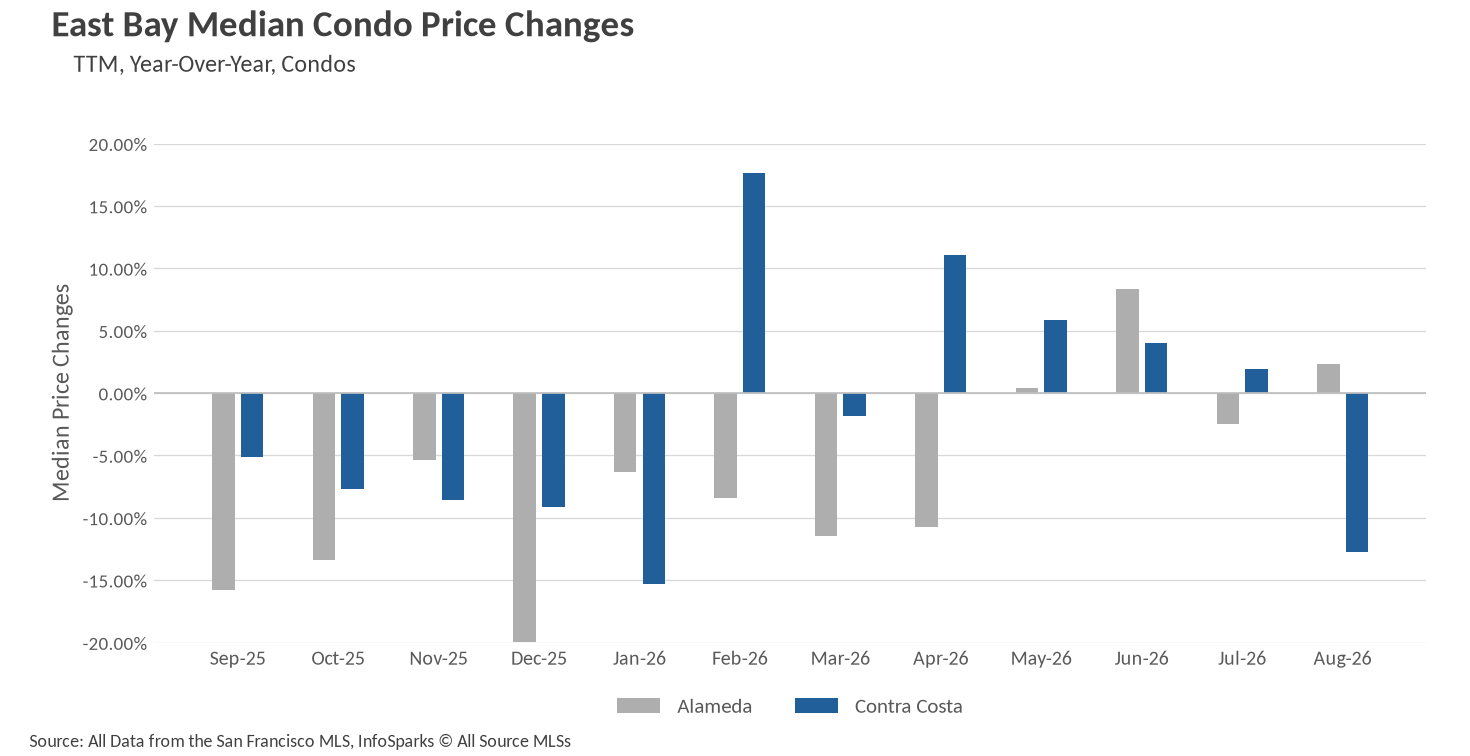
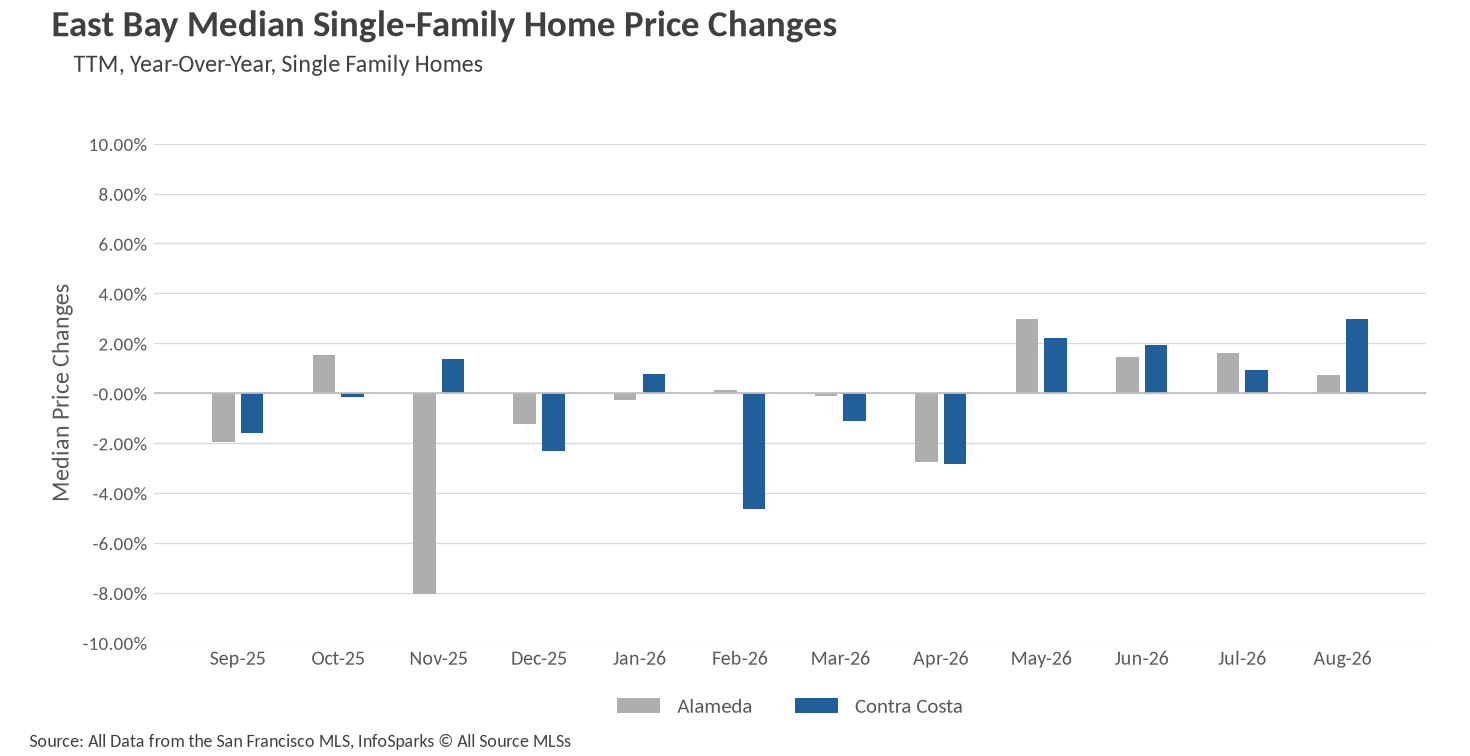
Everywhere else, the year-over-year needle sat just below the flat line. Santa Clara County came in at $1,850,000, down 1.70%, and Santa Cruz County at $1,350,000, down 1.60%. Sonoma slipped 4.46% to $793,000, Solano fell 7.26% to $575,000, and Napa eased 3.06% to $950,000. The East Bay split the difference, with Alameda County up 0.71% to $1,269,000 and Contra Costa County up 2.98% to $865,000. Nearly every one of these markets also stepped down from spring peaks, which is the ordinary seasonal fade rather than a signal of distress.
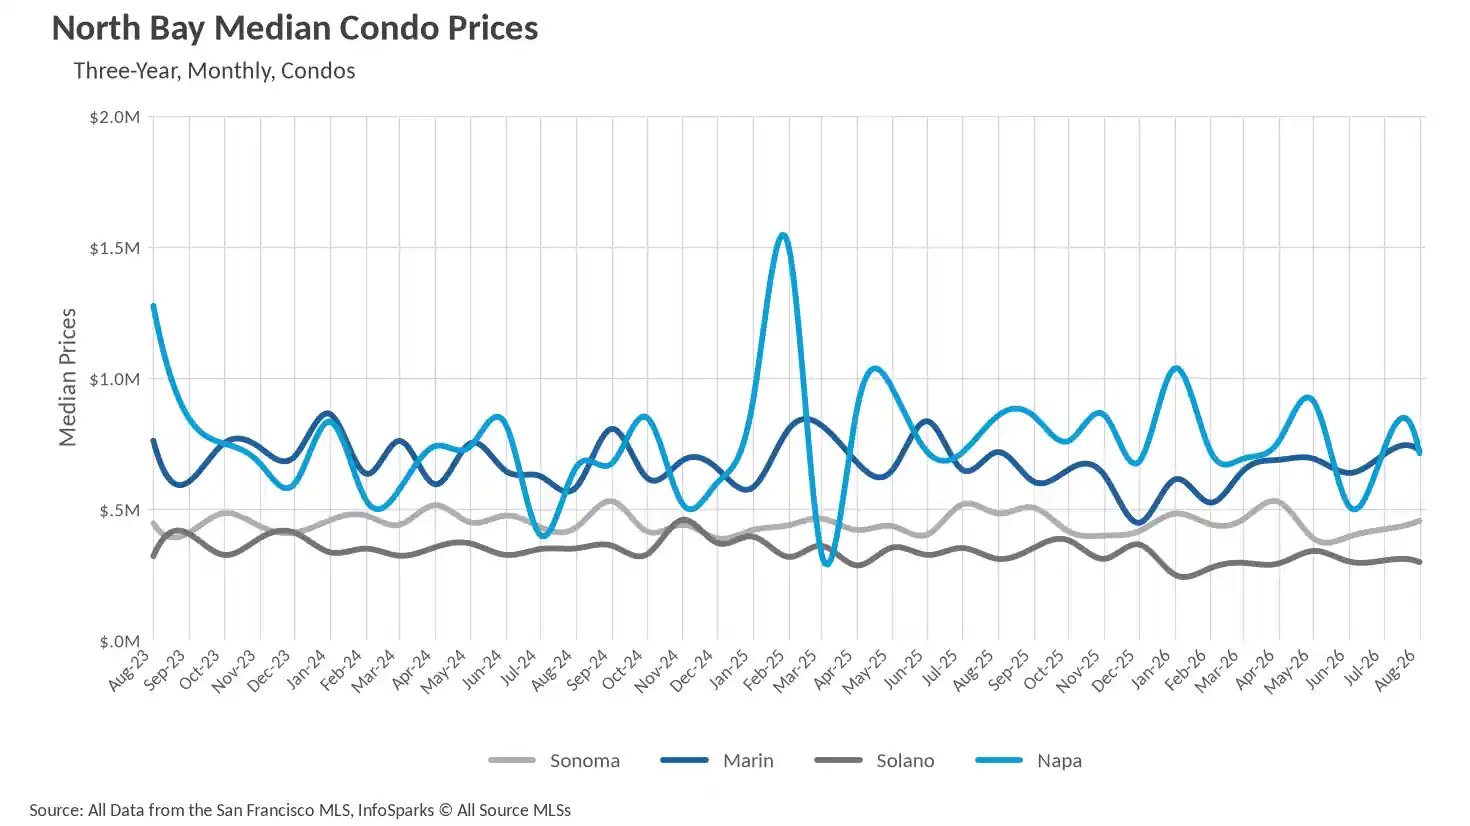
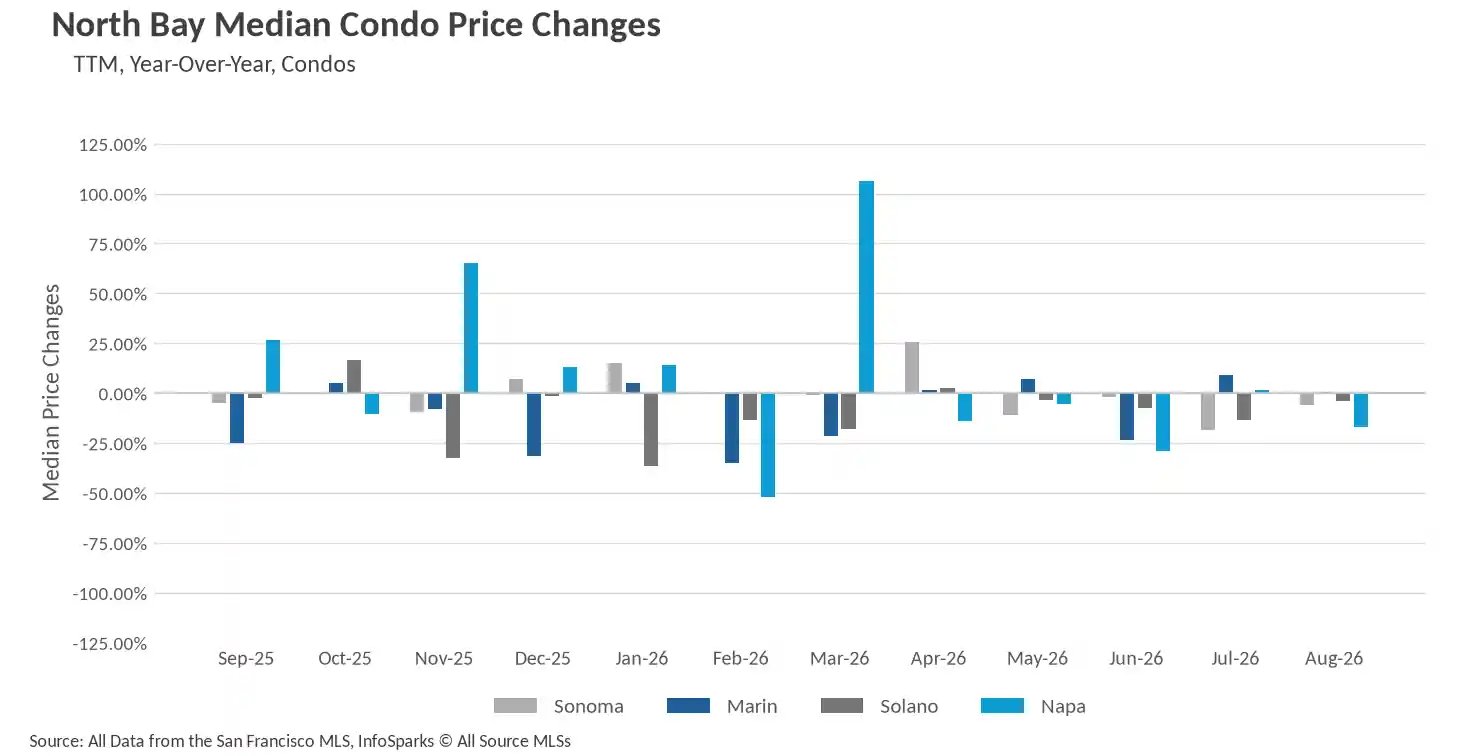
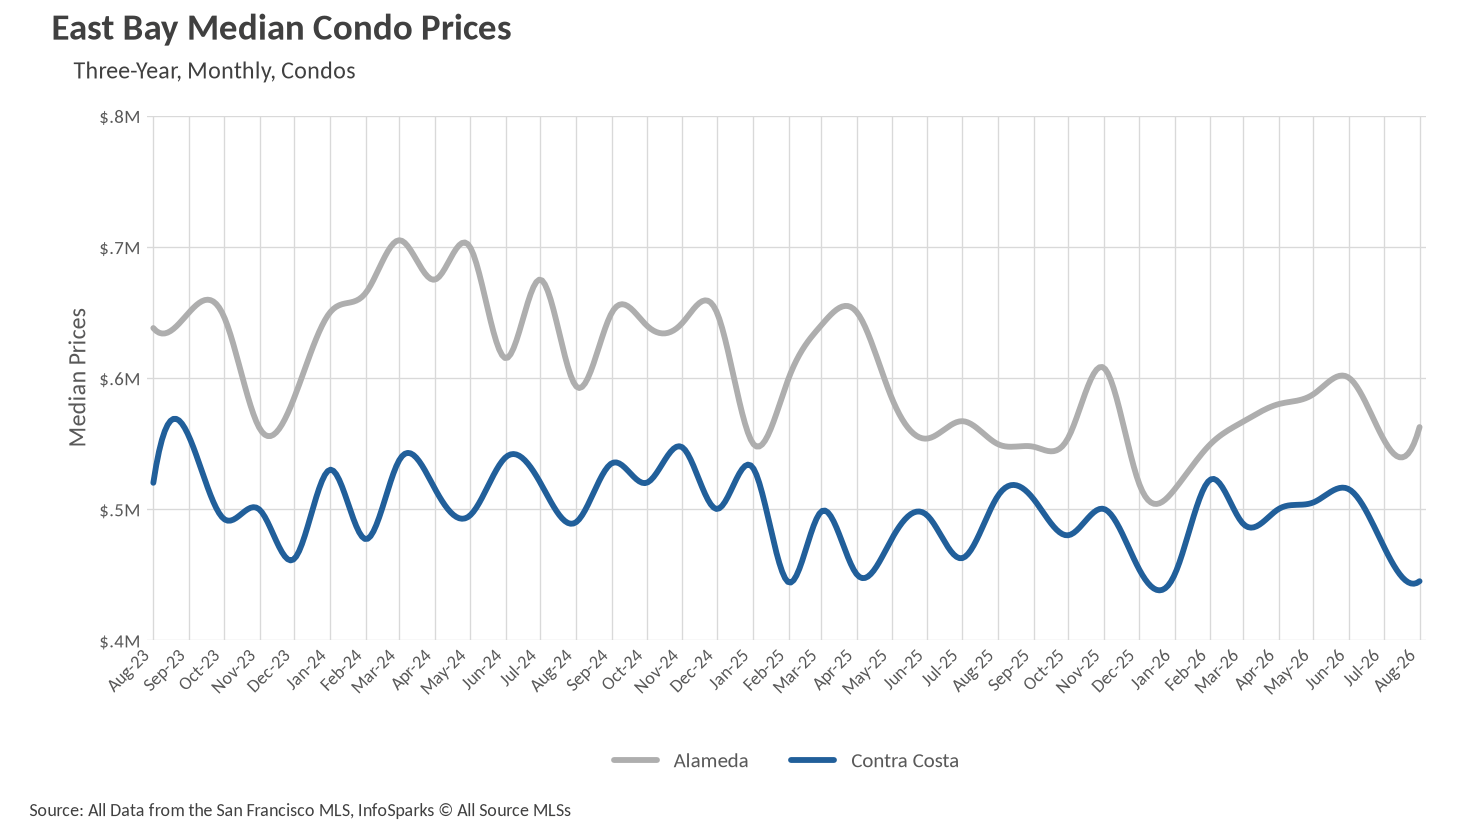
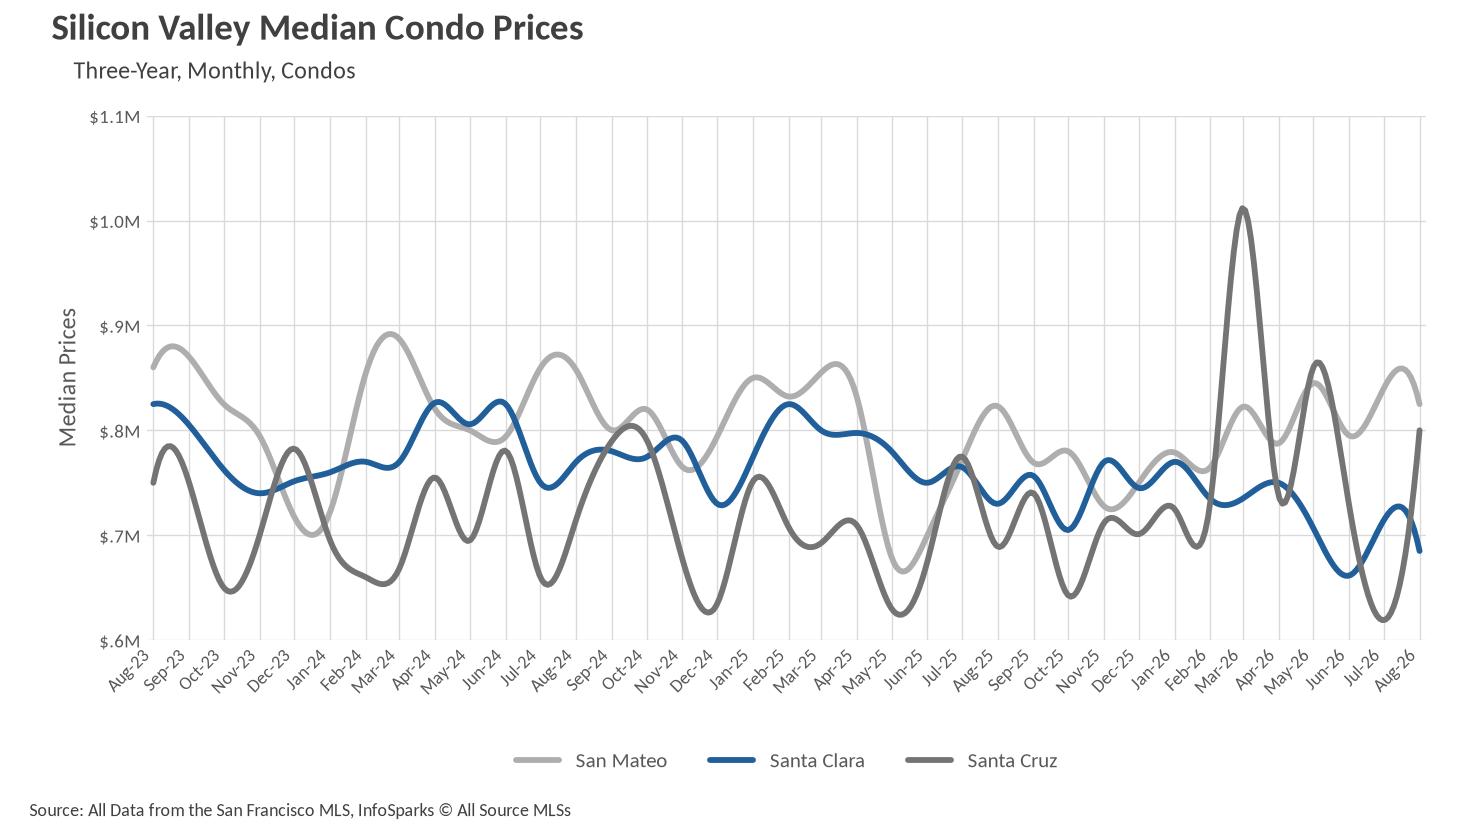
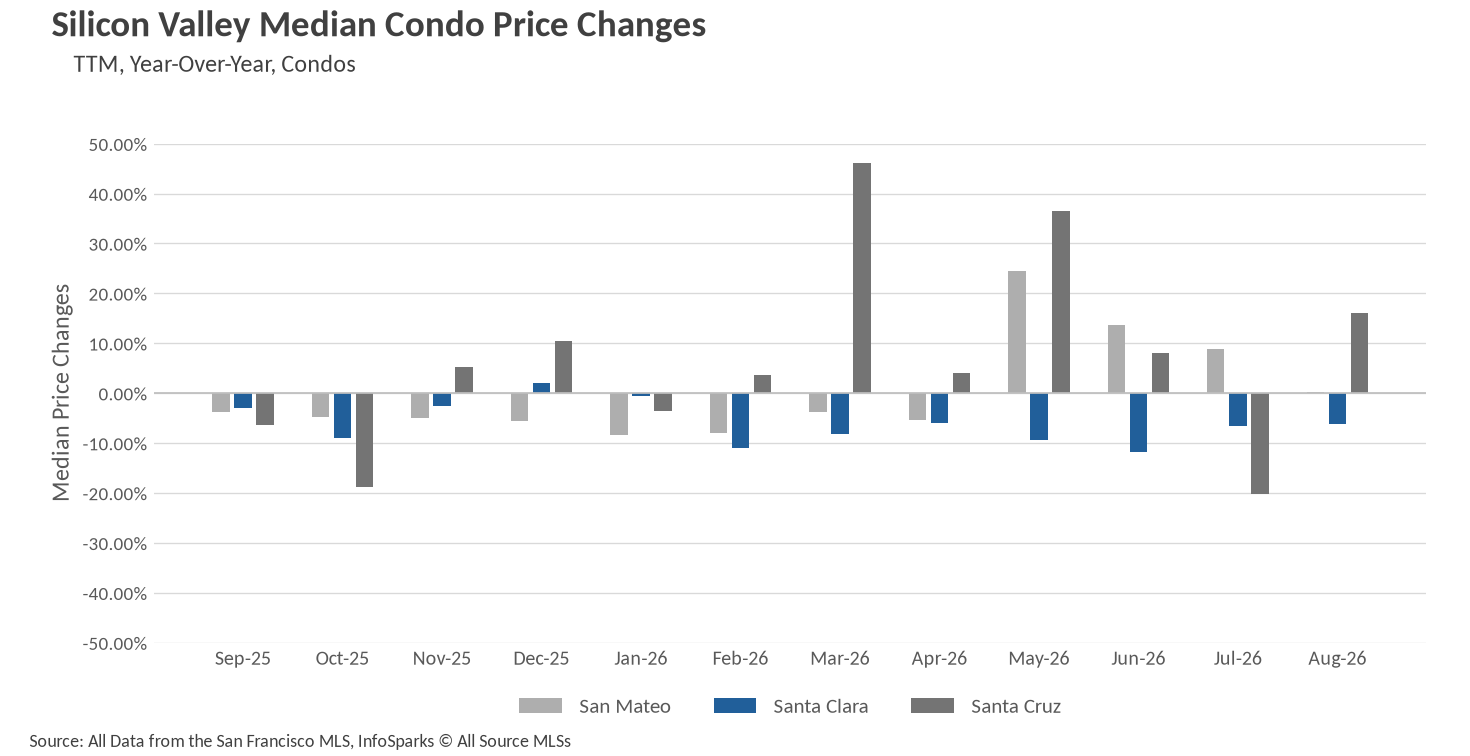
Condos were more scattered still. San Francisco condos matched their single-family counterparts at $1,260,000, up 23.53% year over year and stable in the $1.2 million range for three consecutive months. Alameda County condos ground higher to $562,500, up 2.37%, while Marin condos edged up 0.81% to $723,313. The soft spots were real, though: Contra Costa condos dropped 12.75% to $444,950, Napa condos fell 16.74%, Santa Clara condos slid 6.16% to $685,000, and Sonoma and Solano condos both finished below last August. Thin monthly transaction counts amplify these swings, which is why Santa Cruz County's 16.11% condo gain to $800,000 deserves the same caution as Napa's decline.
The listing shortage is regionwide, and it is not a seller problem
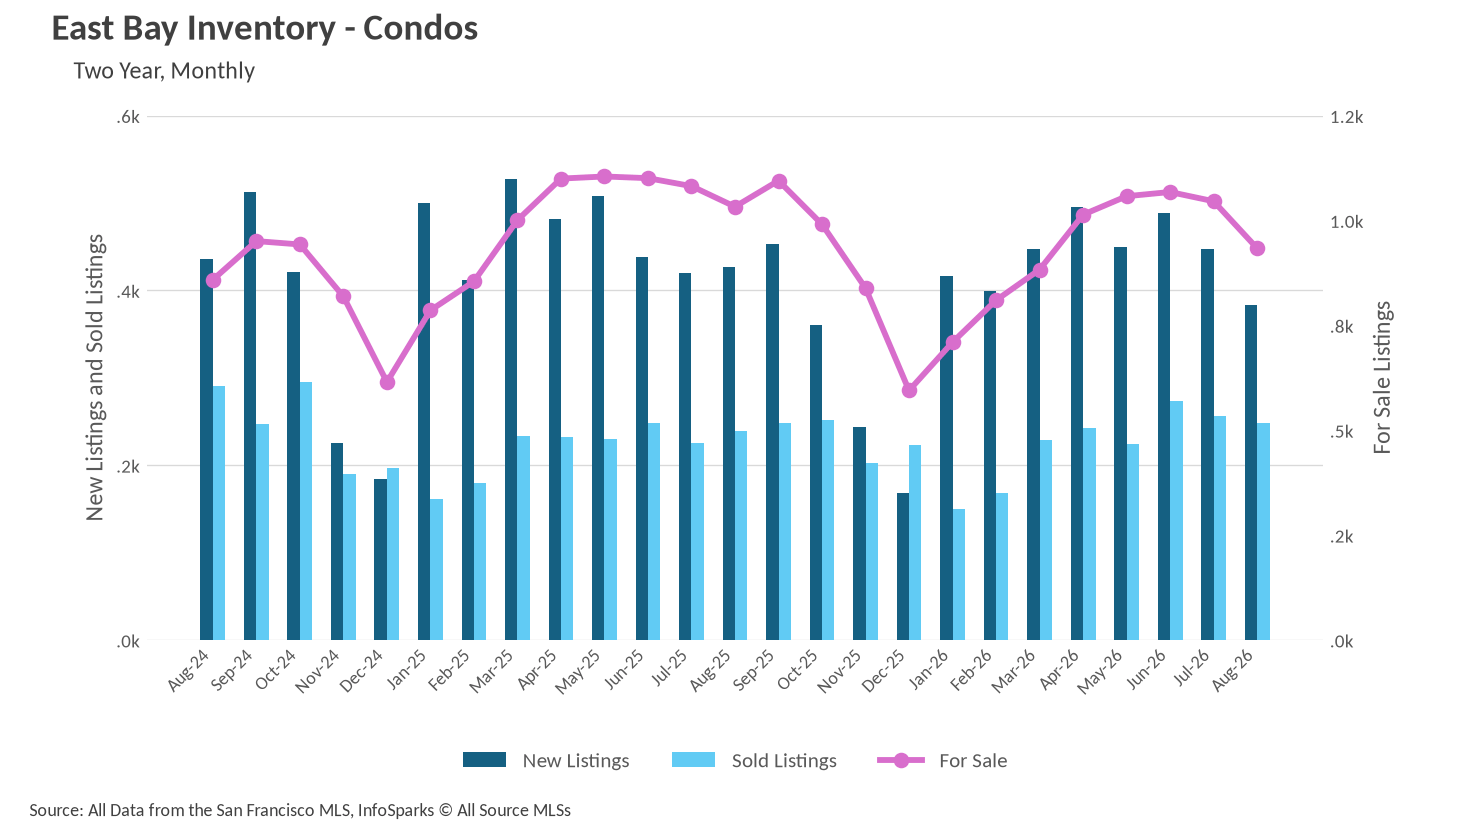
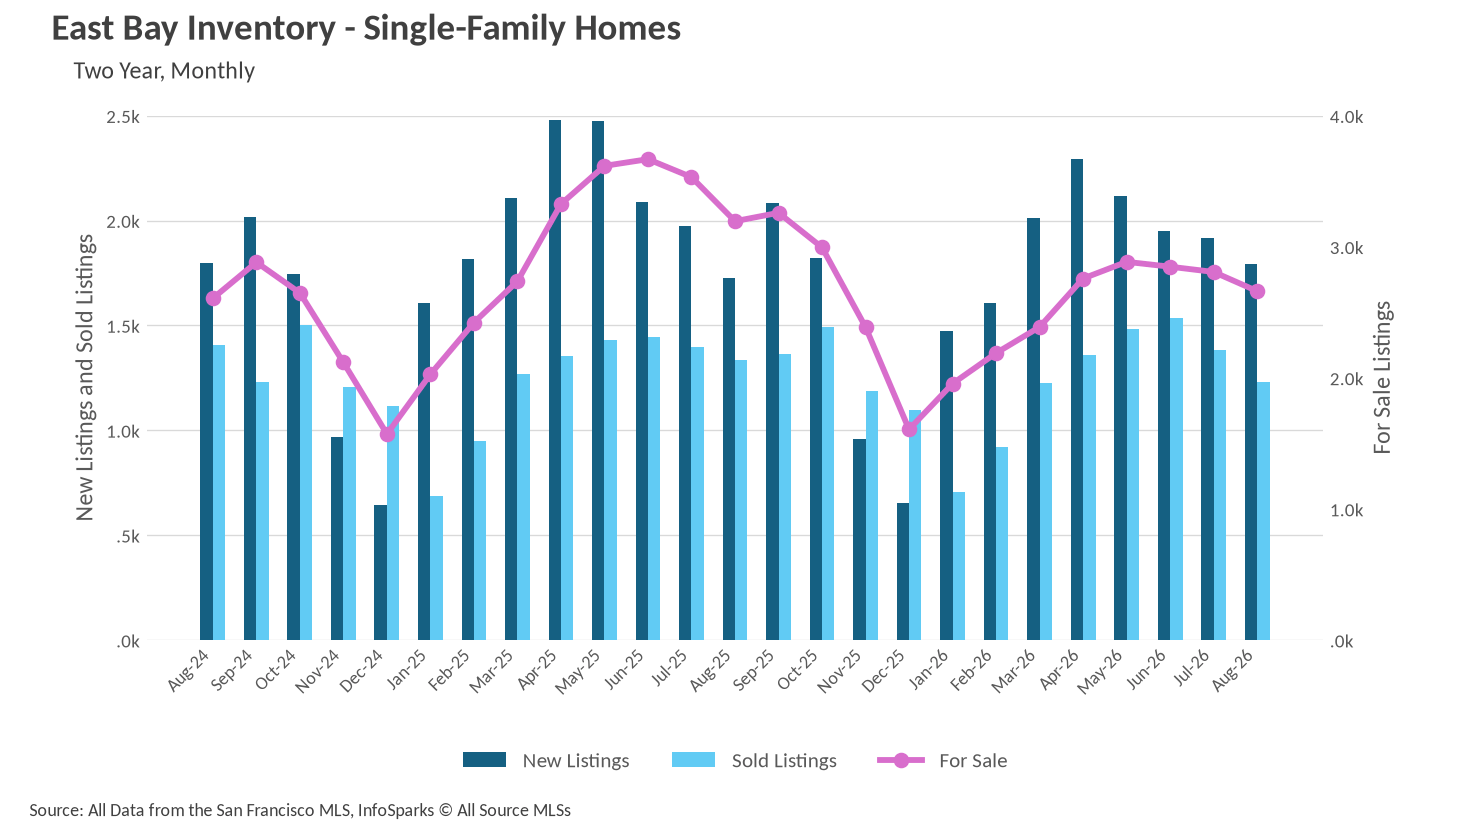
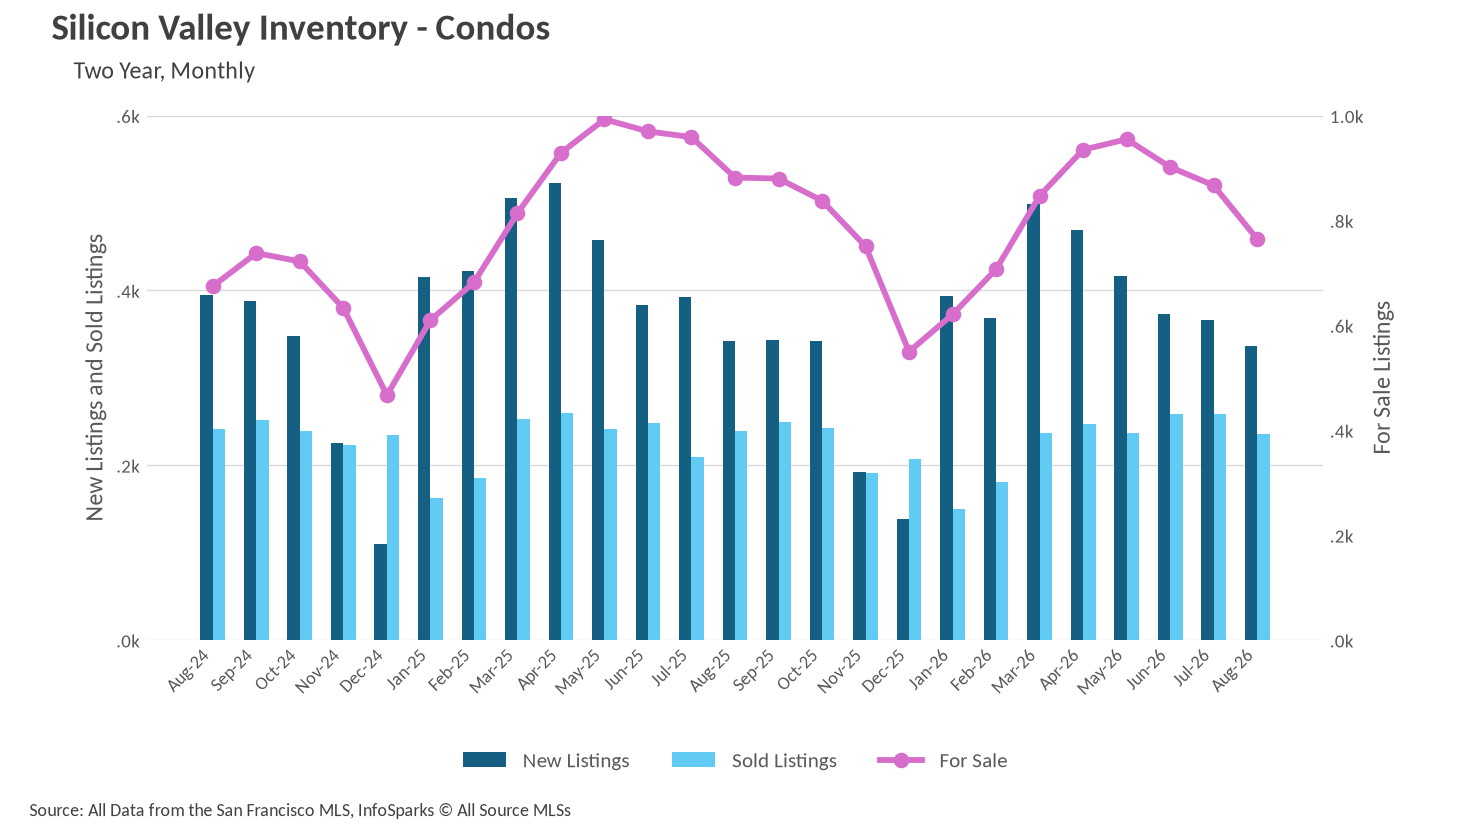
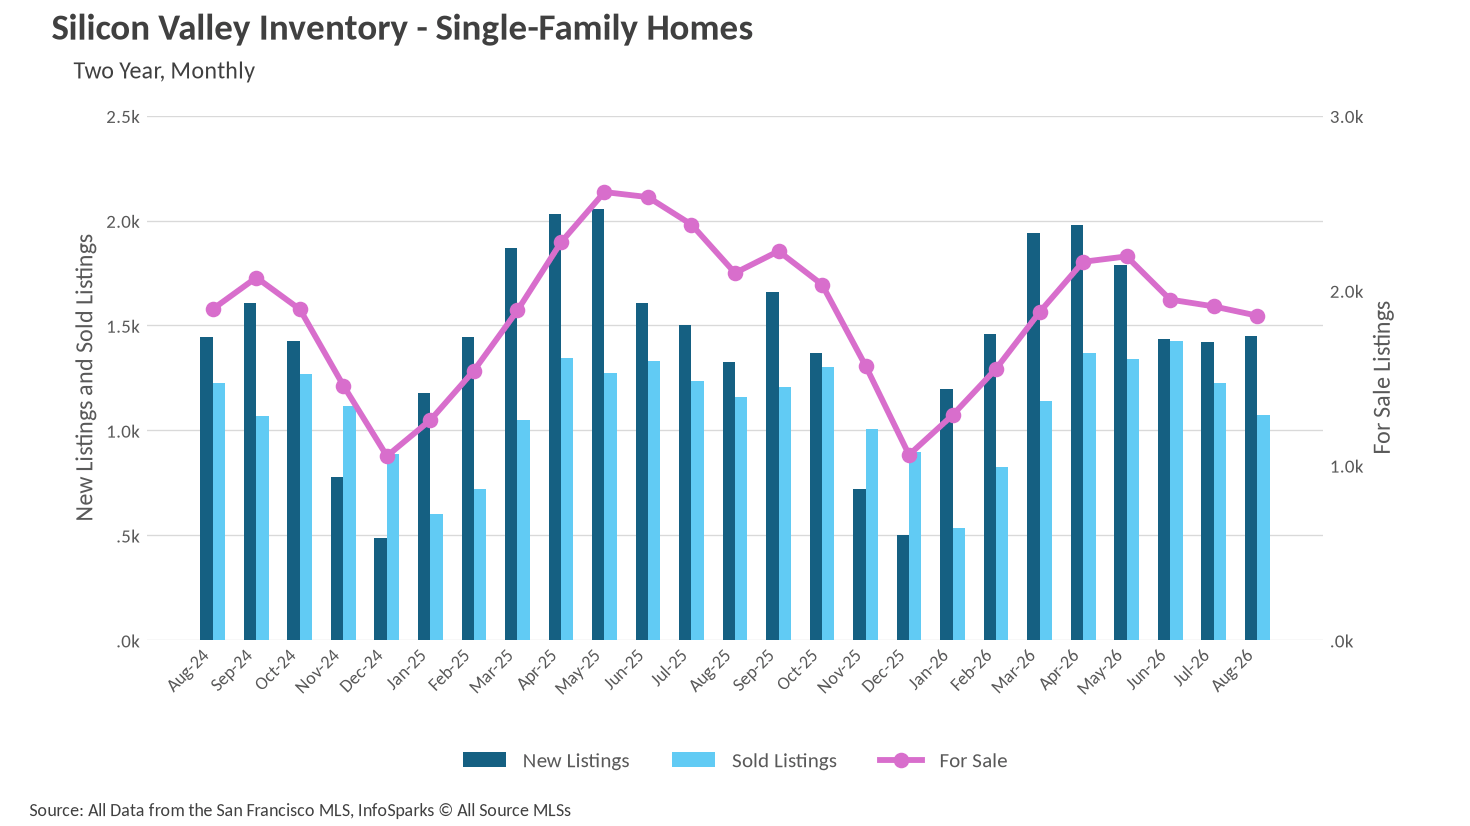
If there is one number that defines the Bay Area in August, it is the shrinking count of homes available to buy. San Francisco ended the month with just 159 single-family homes and 348 condos citywide, down 33.19% and 36.38% respectively from last August. The North Bay saw single-family inventory fall to 2,778 homes, a 29.62% year-over-year decline, with condos off 23.30% to only 349 units. The East Bay carried 2,662 single-family listings, down 16.68%, and 934 condos, down 9.58%. Silicon Valley held 1,856 single-family homes, down 11.62%, and 765 condos, down 13.27%.
What makes this contraction interesting is that it is not primarily a story of sellers sitting out. New single-family listings rose 9.51% year over year in Silicon Valley, 8.72% in San Francisco, and 3.76% in the East Bay. In each case, buyers absorbed the new supply faster than it arrived. San Francisco was the clearest example, where new condo listings climbed 15.84% and closed condo sales jumped 14.81%, and inventory still fell. The North Bay was the exception, with new single-family listings down 17.84% and new condo listings down 26.92%, a genuine supply pullback that coincided with a 4.20% gain in single-family sales and a 19.75% jump in condo closings.
Silicon Valley was the one market where the tightening came partly from the demand side, with 1,073 single-family sales in August, down 7.58% year over year and off 12.48% from July. Fewer closings and fewer listings at the same time keeps that market feeling tight without feeling frenzied.
Two weeks to sell a house almost anywhere
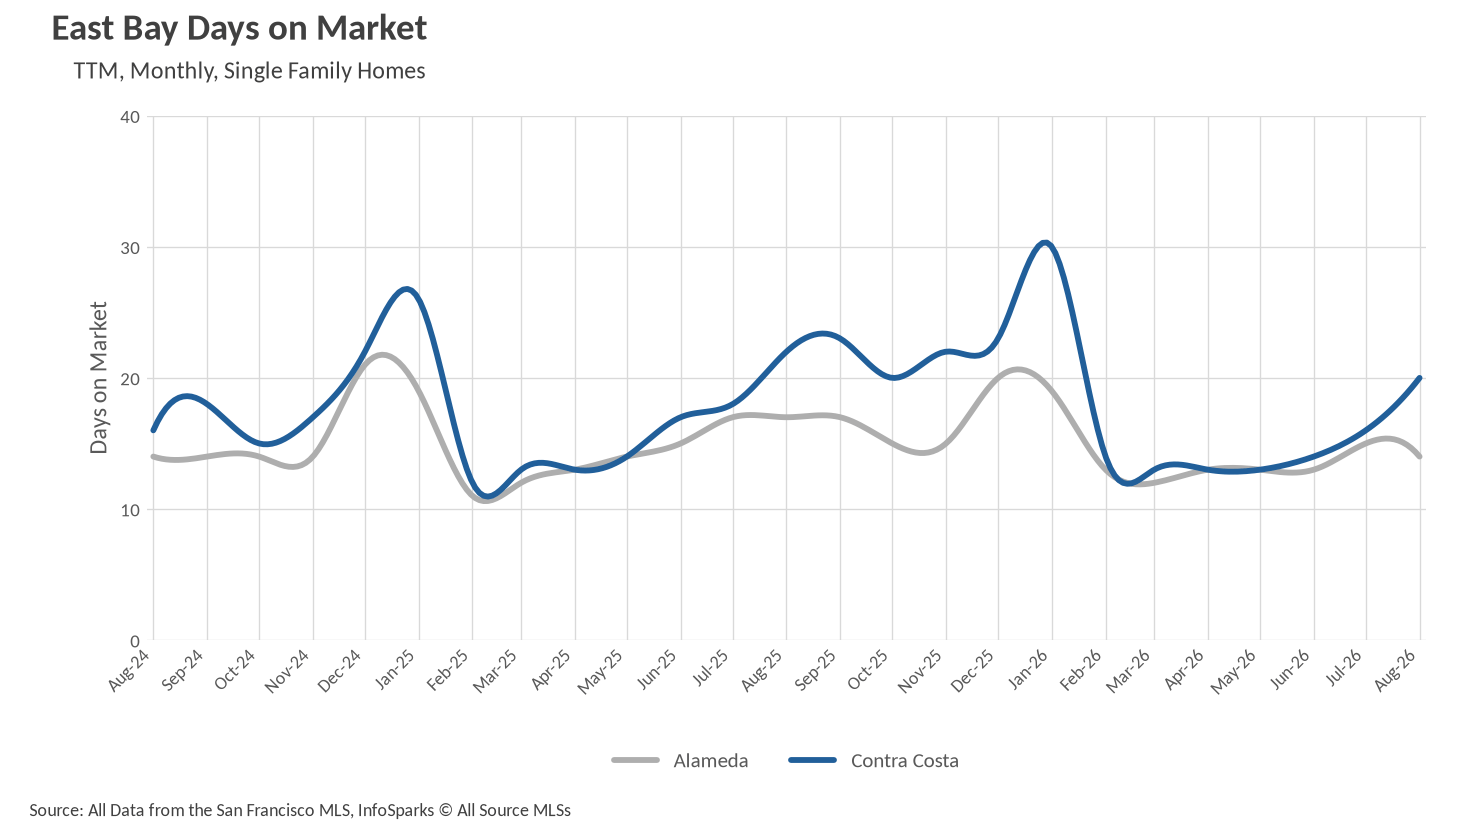
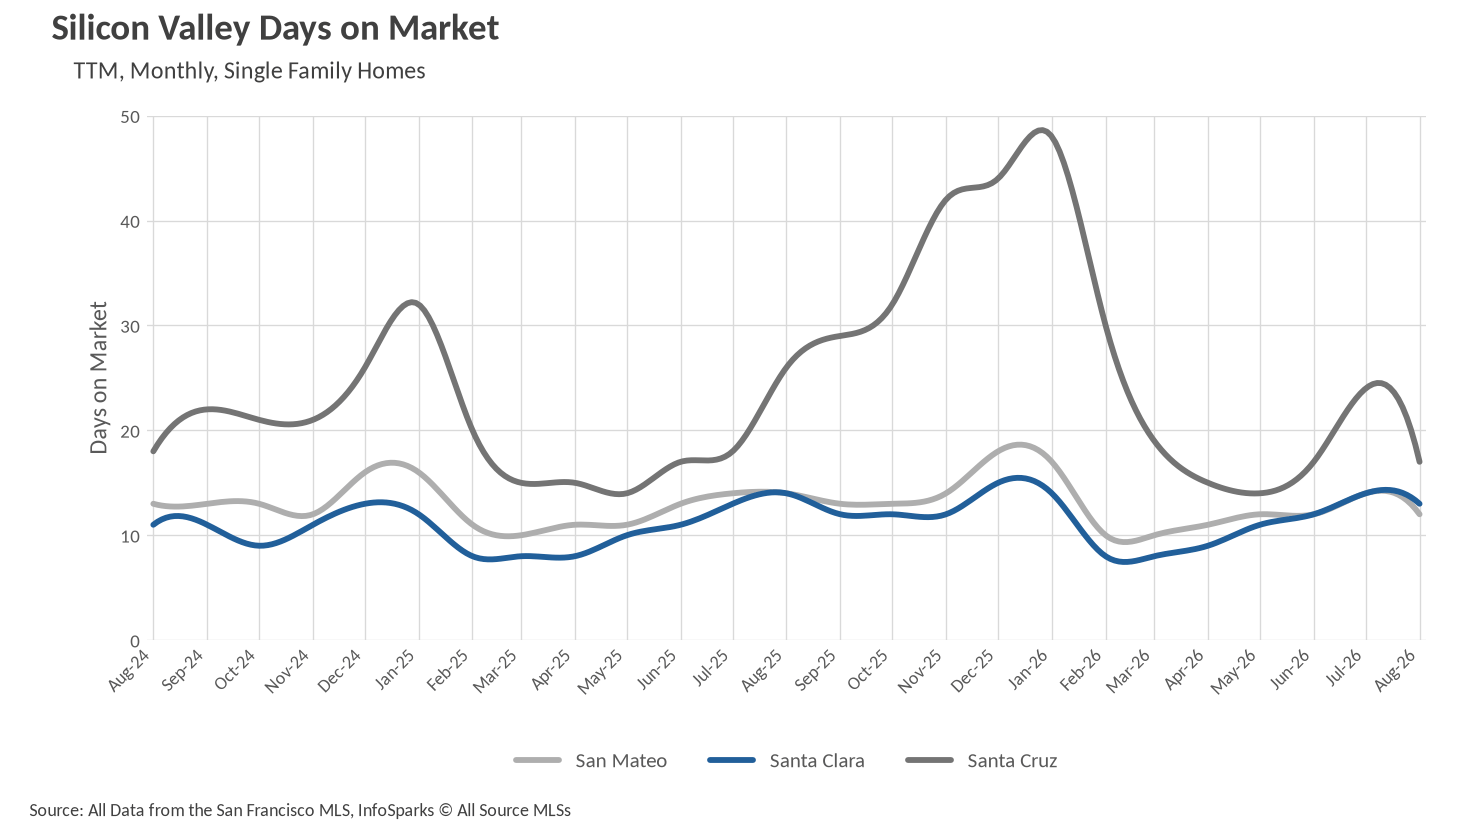
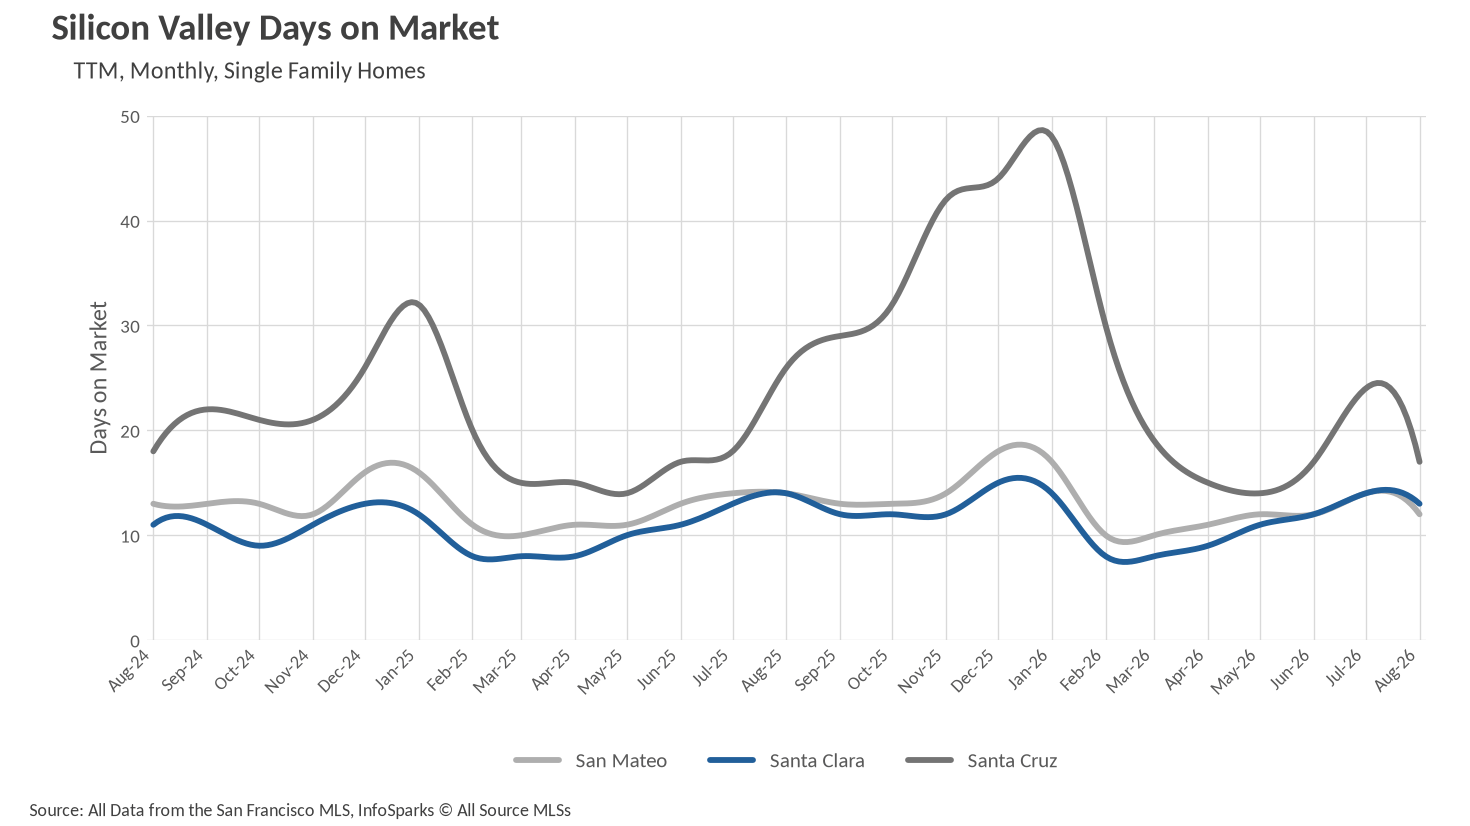
Single-family sales velocity improved year over year in nearly every county the region tracks. San Mateo County was fastest at 12 days, followed by San Francisco and Santa Clara County at 13, and Alameda County at 14. Santa Cruz County delivered the sharpest acceleration, selling in 17 days against 26 last August, a 34.62% improvement for a market that had days on market in the 40s over the winter. Contra Costa County came in at 20 days and Marin at 21, the latter a 27.59% improvement year over year. The outer North Bay remains the slower end of the spectrum, with Solano at 29 days, Sonoma at 39, and Napa the region's slowest single-family market at 53 days.
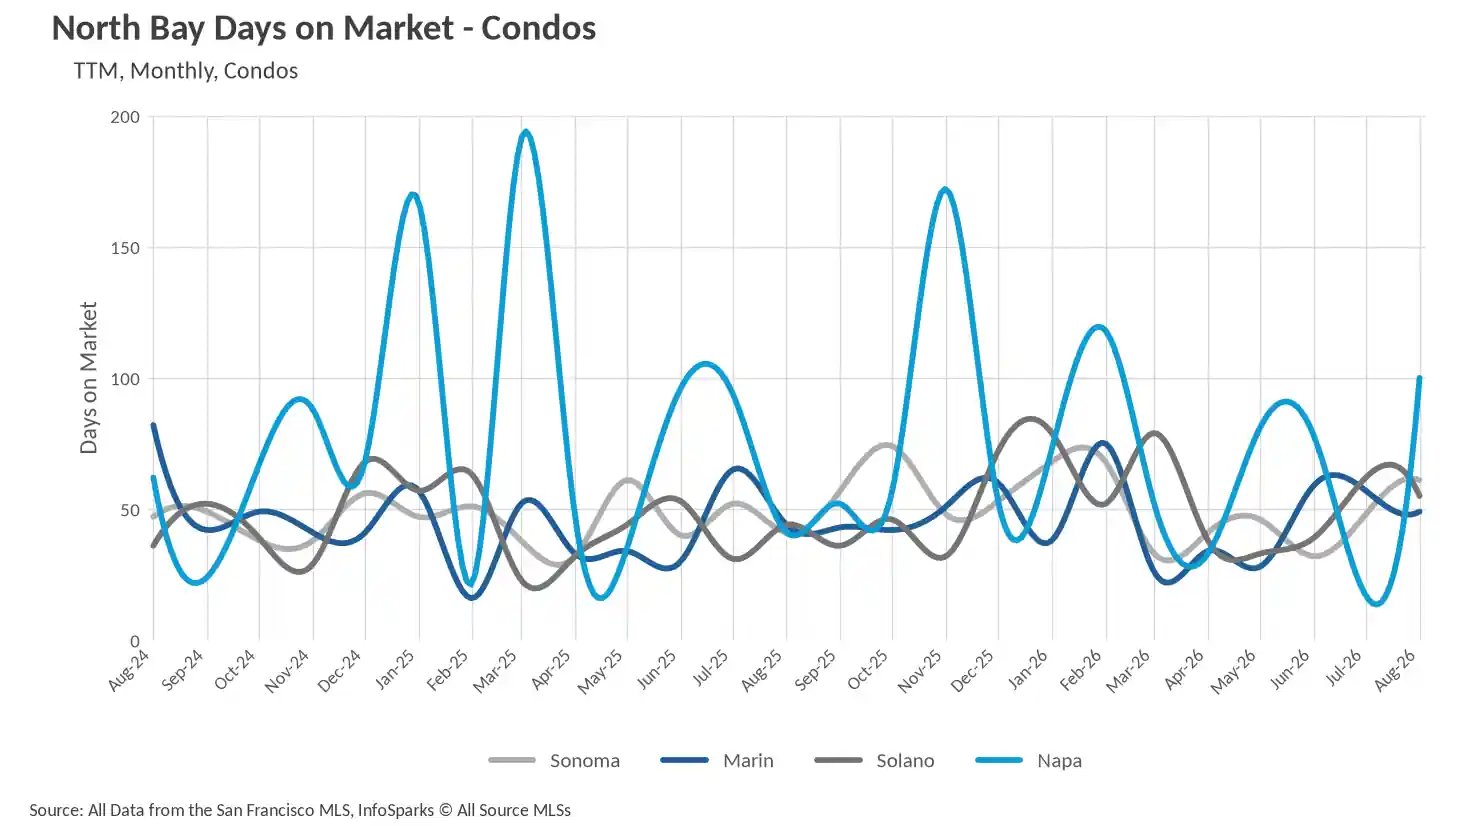
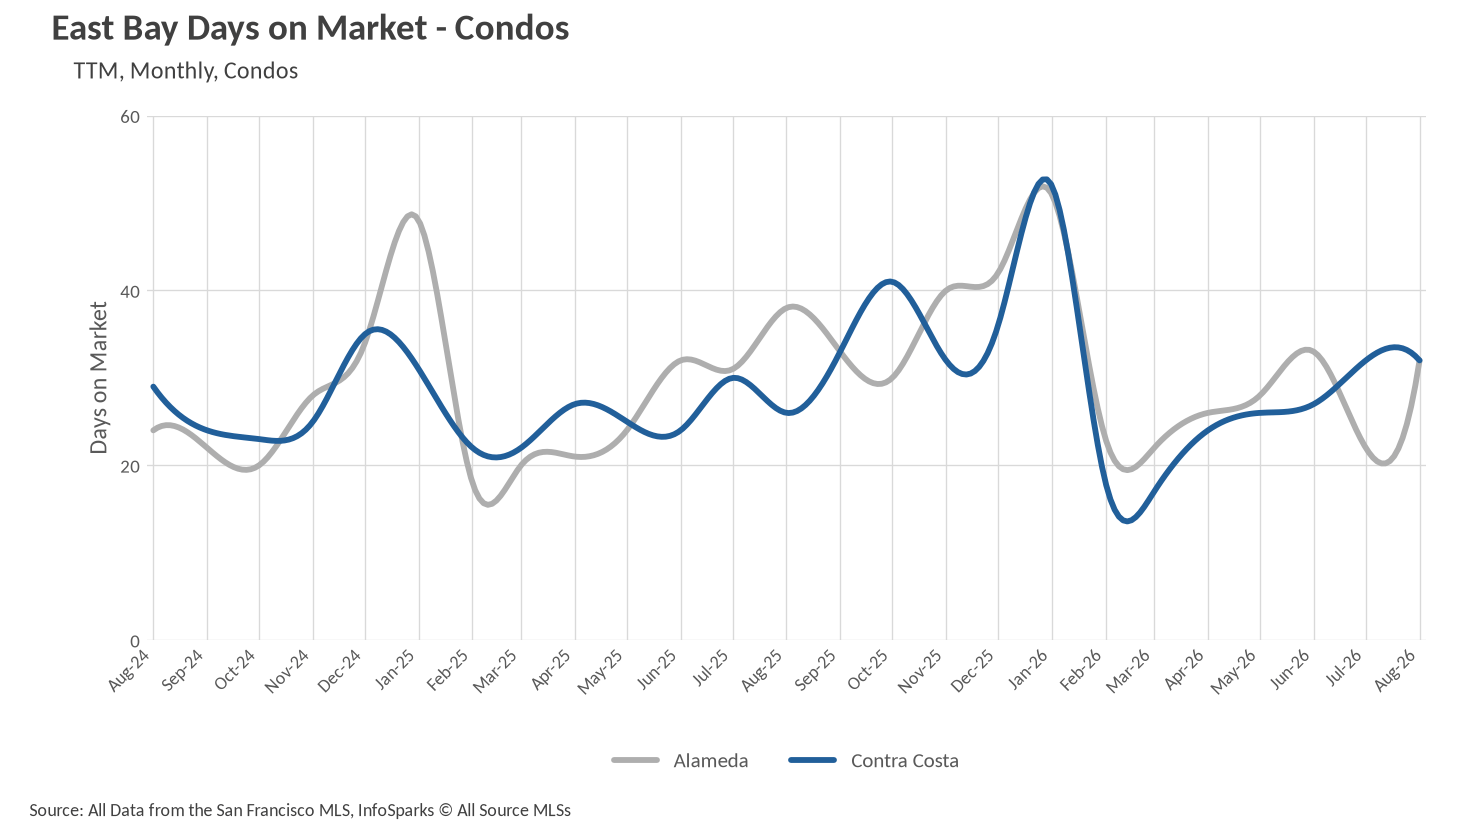
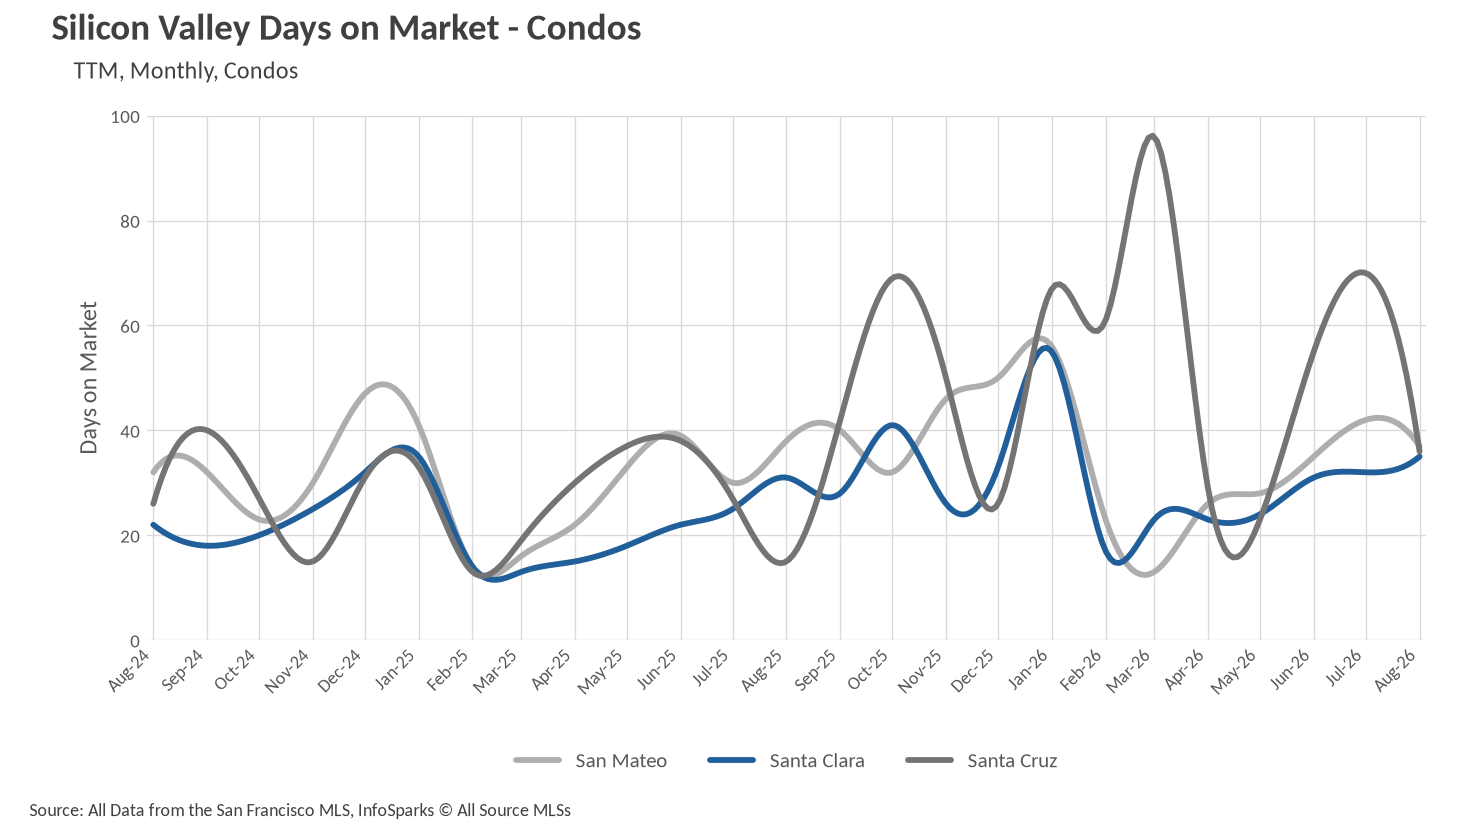
Condos are where the regional story genuinely divides. San Francisco condos sold in 19 days, down 62.75% from the 51 days they required last August, closing the gap with single-family homes to less than a week after years of running five weeks or wider. The East Bay was steady, with both Alameda and Contra Costa condos at 32 days. Silicon Valley condos clustered in the mid-30s, ranging from 35 days in Santa Clara County to 37 in San Mateo. The North Bay moved the other direction entirely, with every county's condo segment slowing: Marin at 49 days, Solano at 55, Sonoma at 61, and Napa stretching to 100 days on a very thin sample.
Sellers hold the leverage, and buyers have fewer places to find it
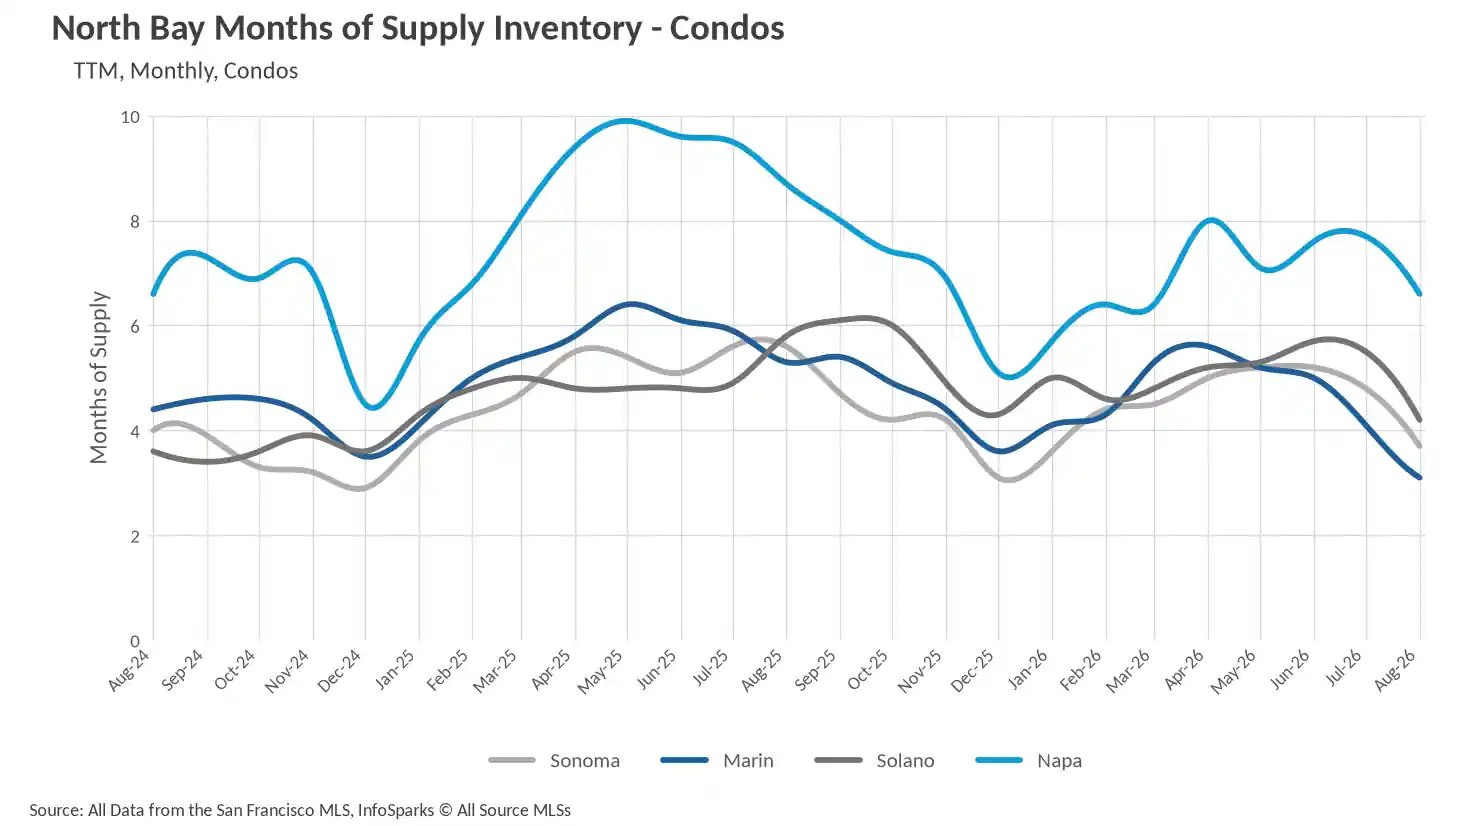
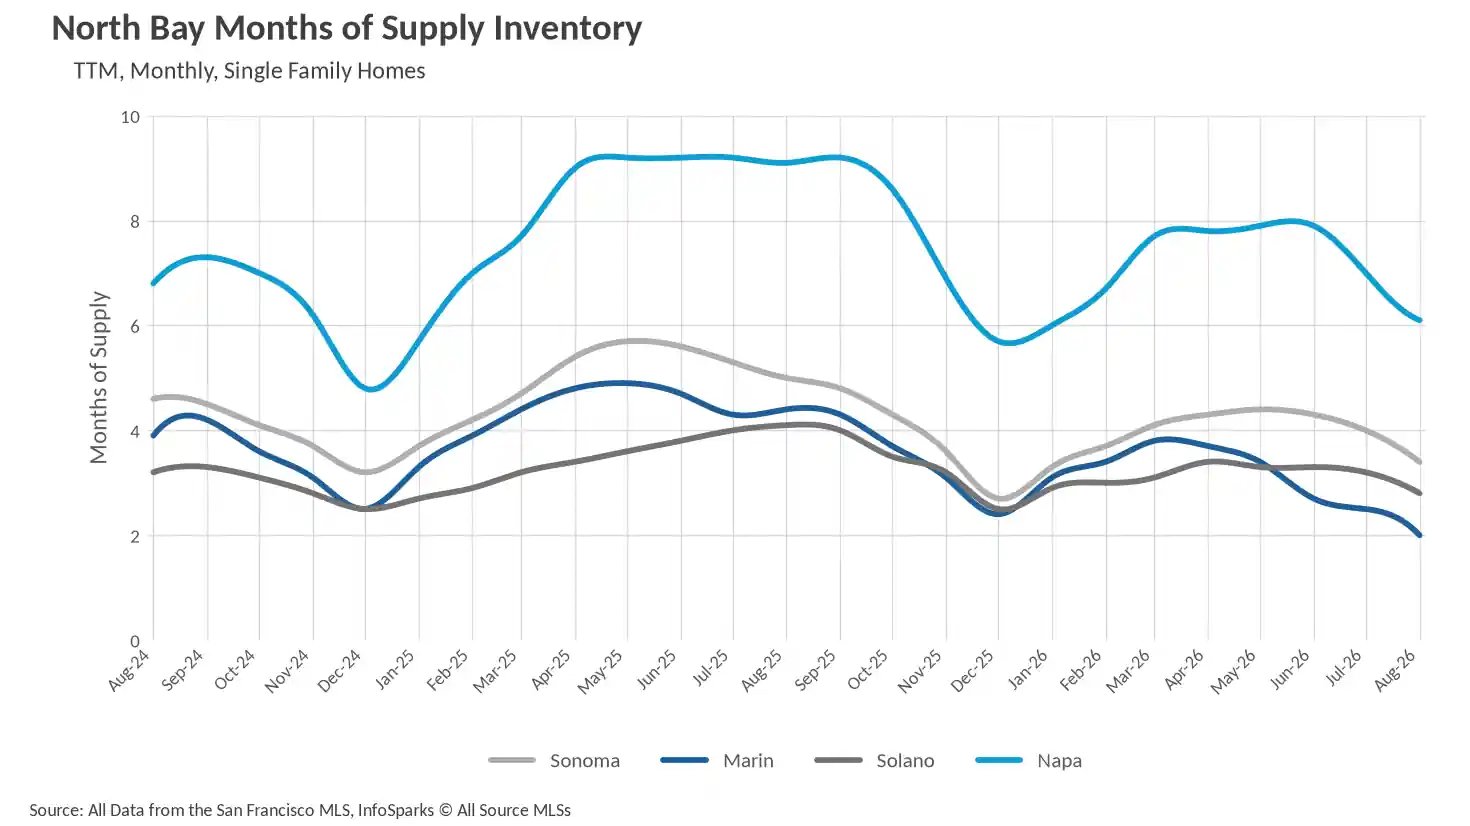
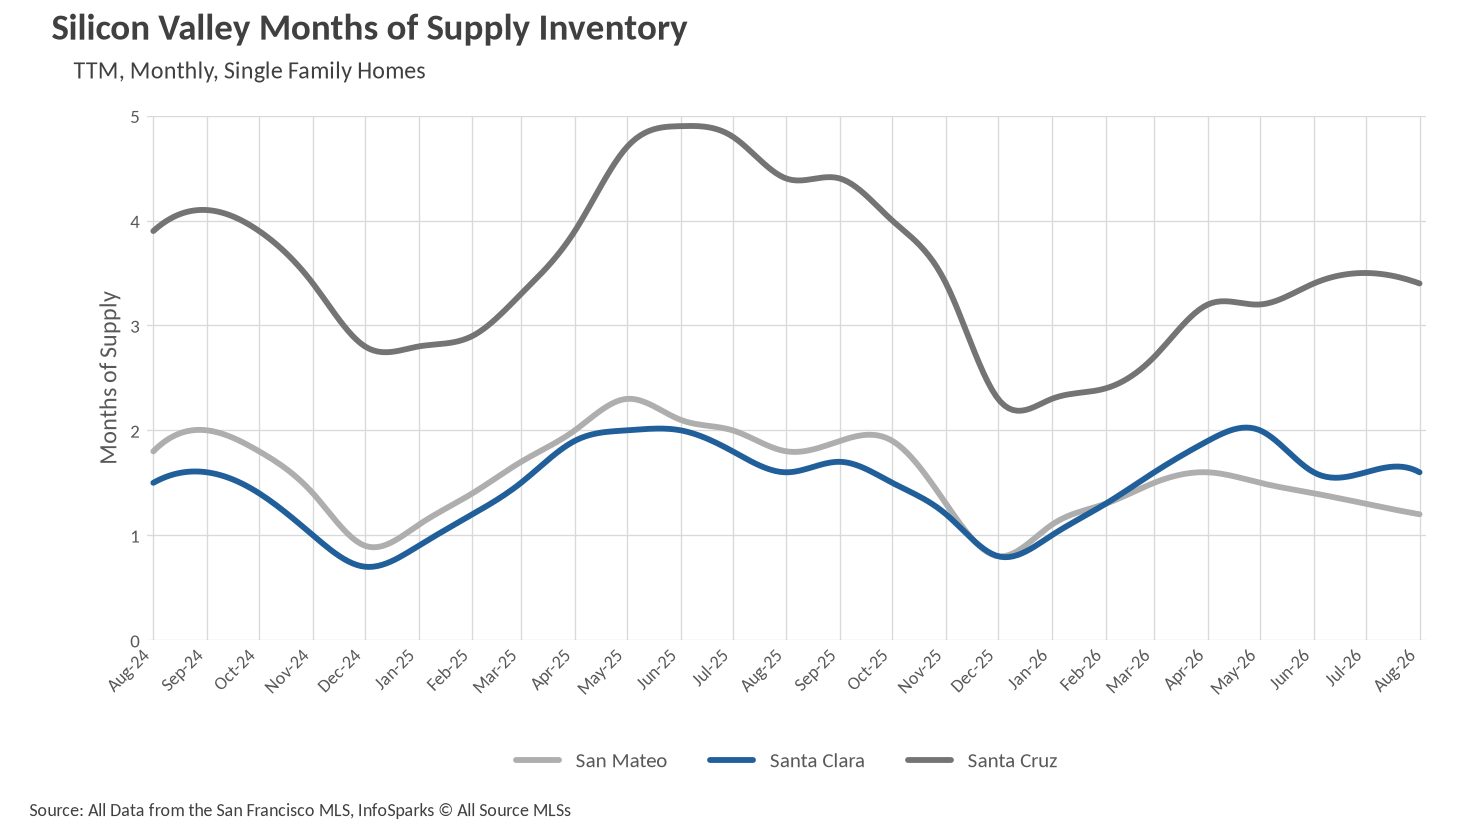
When determining whether a market is a buyers’ market or a sellers’ market, we look to the Months of Supply Inventory (MSI) metric. The state of California has historically averaged around three months of MSI, so any area with at or around three months of MSI is considered a balanced market. Any market that has lower than three months of MSI is considered a seller’s market, whereas markets with more than three months of MSI are considered buyers’ markets.
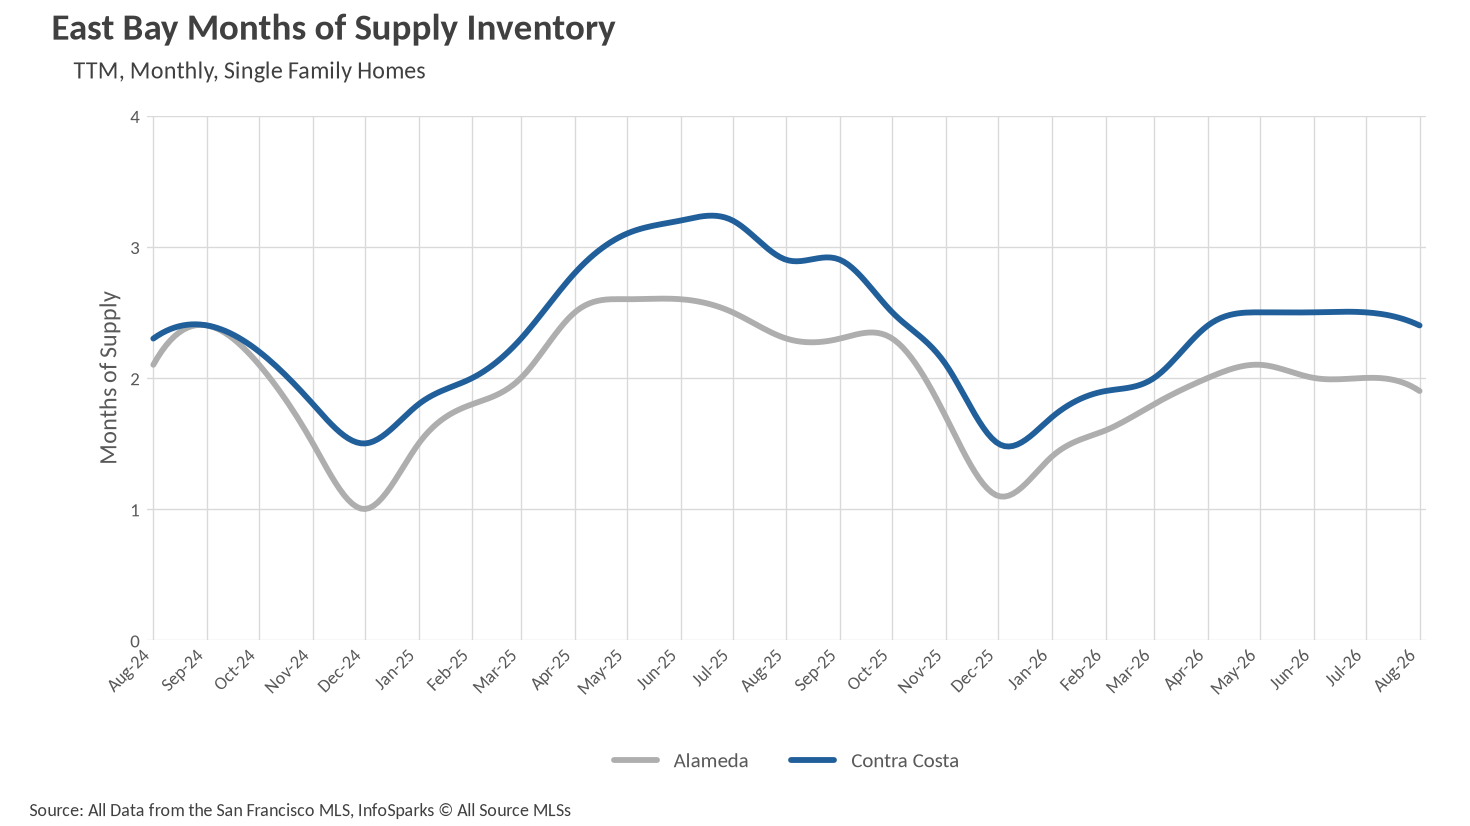
By that measure, the Bay Area's single-family market is a seller's market almost without exception. San Francisco sits at an extraordinary 0.8 months of supply, down 38.46% year over year, meaning the city's entire detached inventory would clear in roughly 24 days at the current pace. San Mateo County follows at 1.2 months, Santa Clara County at 1.6, Alameda County at 1.9, Marin County at 2.0 after a 54.55% year-over-year collapse from 4.4 months, Contra Costa County at 2.4, and Solano County at 2.8. Only Santa Cruz and Sonoma Counties, both at 3.4 months, register as roughly balanced, and Napa County stands alone as a true buyers' market at 6.1 months, though even that is down sharply from 9.1 months a year ago.
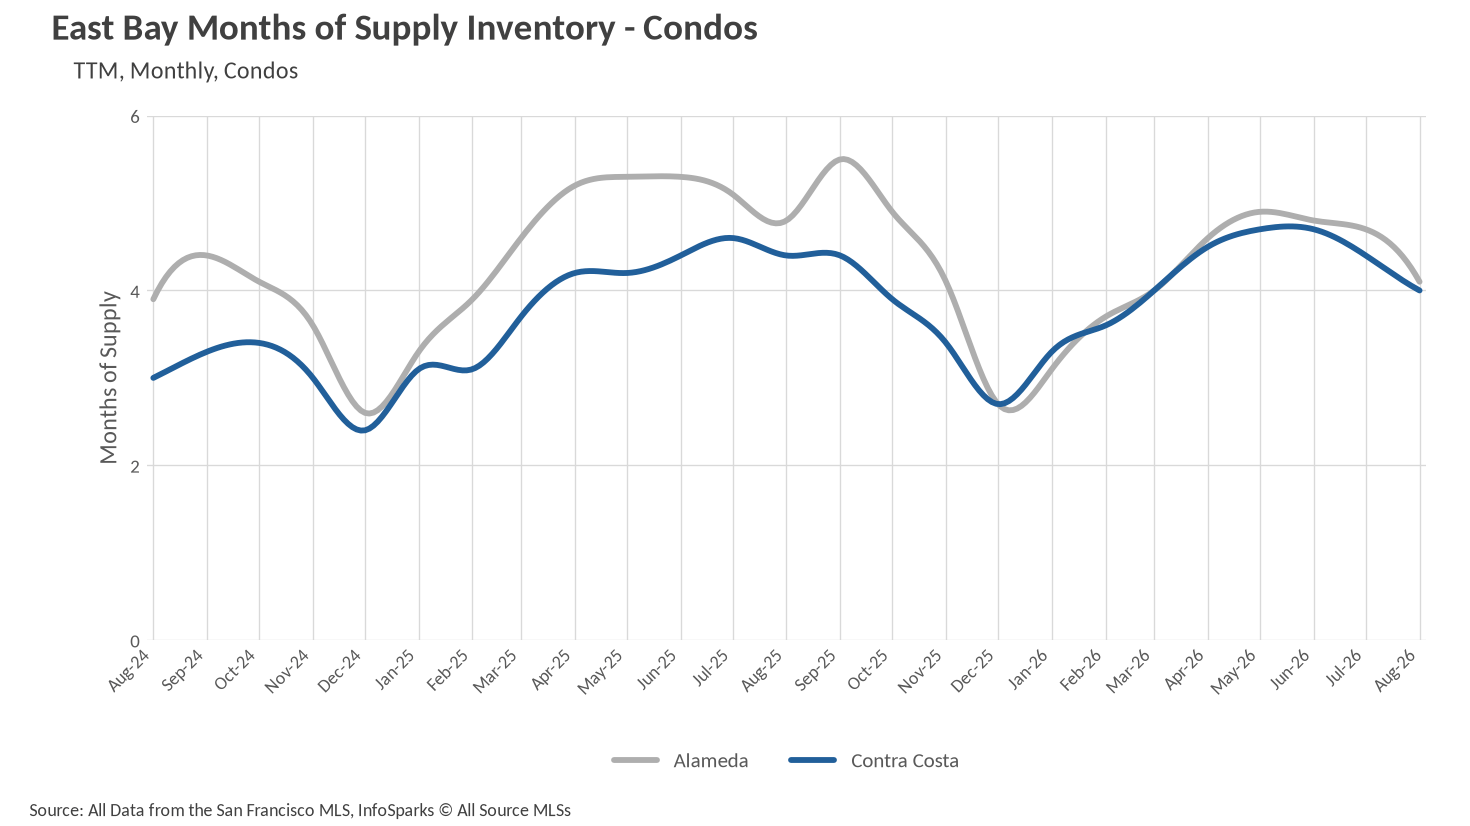
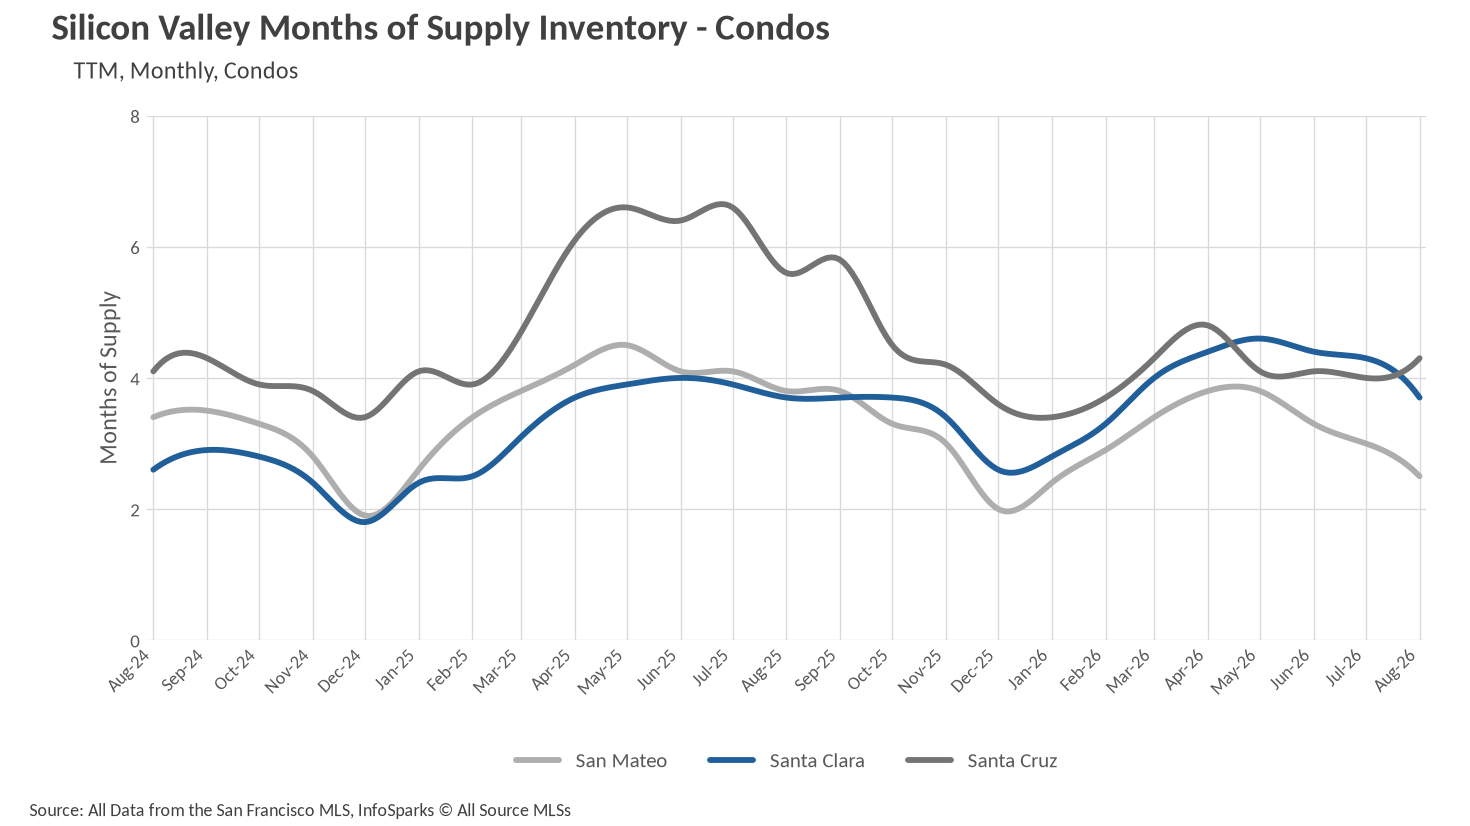
The condo picture is where buyers still have room to work, but that room is narrowing quickly. San Francisco condos have tightened to 1.6 months from 3.1 last August, a 48.39% decline that effectively ends the segment's run as the region's buyer-friendly alternative. San Mateo County condos crossed into seller's territory at 2.5 months, down 34.21%, and Marin condos landed essentially in balance at 3.1 months after a 41.51% improvement. Beyond those, buyers retain genuine negotiating leverage: Santa Clara County condos at 3.7 months, Sonoma at 3.7, Contra Costa at 4.0, Alameda at 4.1, Solano at 4.2, Santa Cruz at 4.3, and Napa at 6.6. Every one of those readings is an improvement for sellers compared with last August, which is the real theme of the month. Heading into fall, buyers of detached homes across the Bay Area should expect to compete and come prepared, while condo shoppers in the East Bay, the outer North Bay, and the southern reaches of Silicon Valley still have the strongest hand at the table.
Local Lowdown Data