Bay Area Real Estate - March 2026 Market Report

Bay Area Real Estate - March 2026 Market Report

The Local Lowdown

Quick Take:

  • San Francisco continues to dominate, with single-family home prices up more than 21% year-over-year, while much of the North Bay saw notable price declines in February.
  • Inventory levels remain severely depressed across the entire Bay Area, with year-over-year declines ranging from 12% in Silicon Valley to nearly 48% in the North Bay.
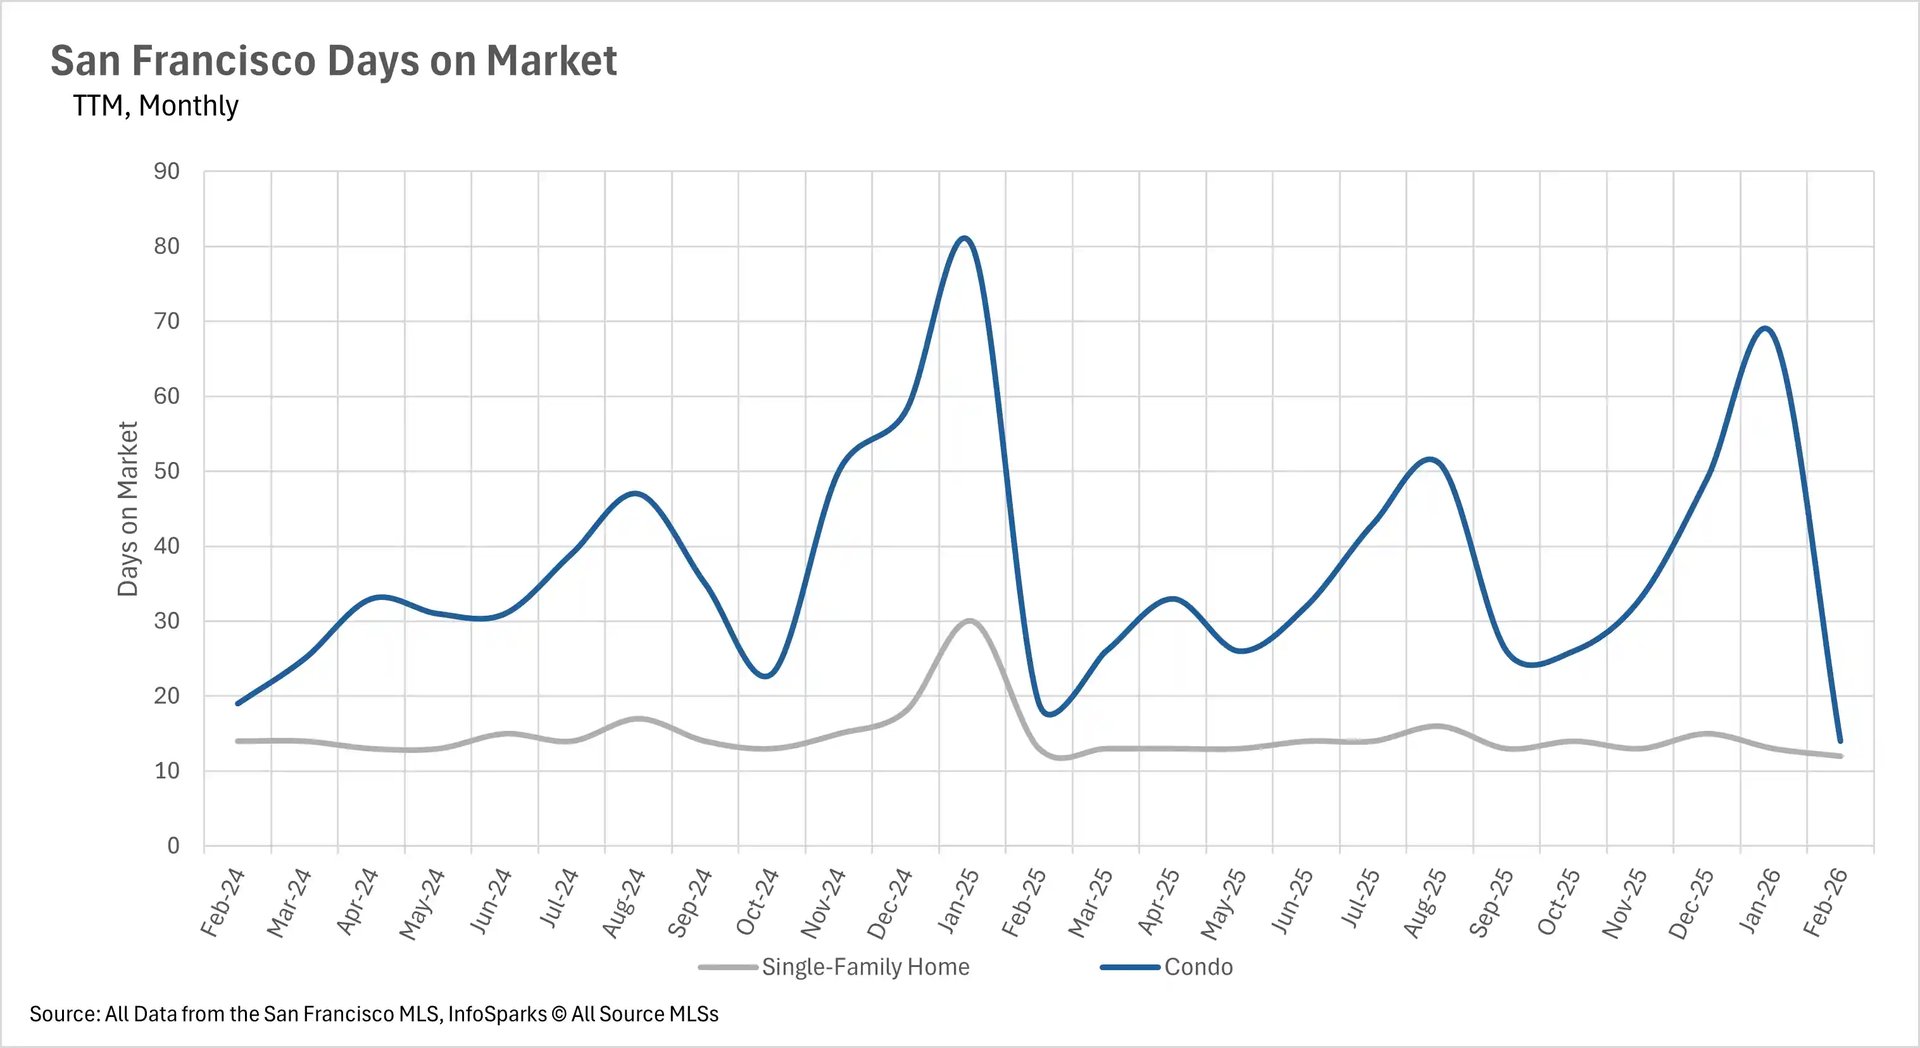
  • Single-family homes are selling at an incredibly fast pace, with listings in Santa Clara County moving in just 8 days and San Francisco listings selling in just 12 days.
  • The Bay Area is overwhelmingly a seller's market heading into the spring selling season, though the condo market is offering buyers a bit more breathing room in certain counties.

Note: You can find the charts/graphs for the Local Lowdown at the end of this section.

San Francisco is surging while prices pull back in the North Bay

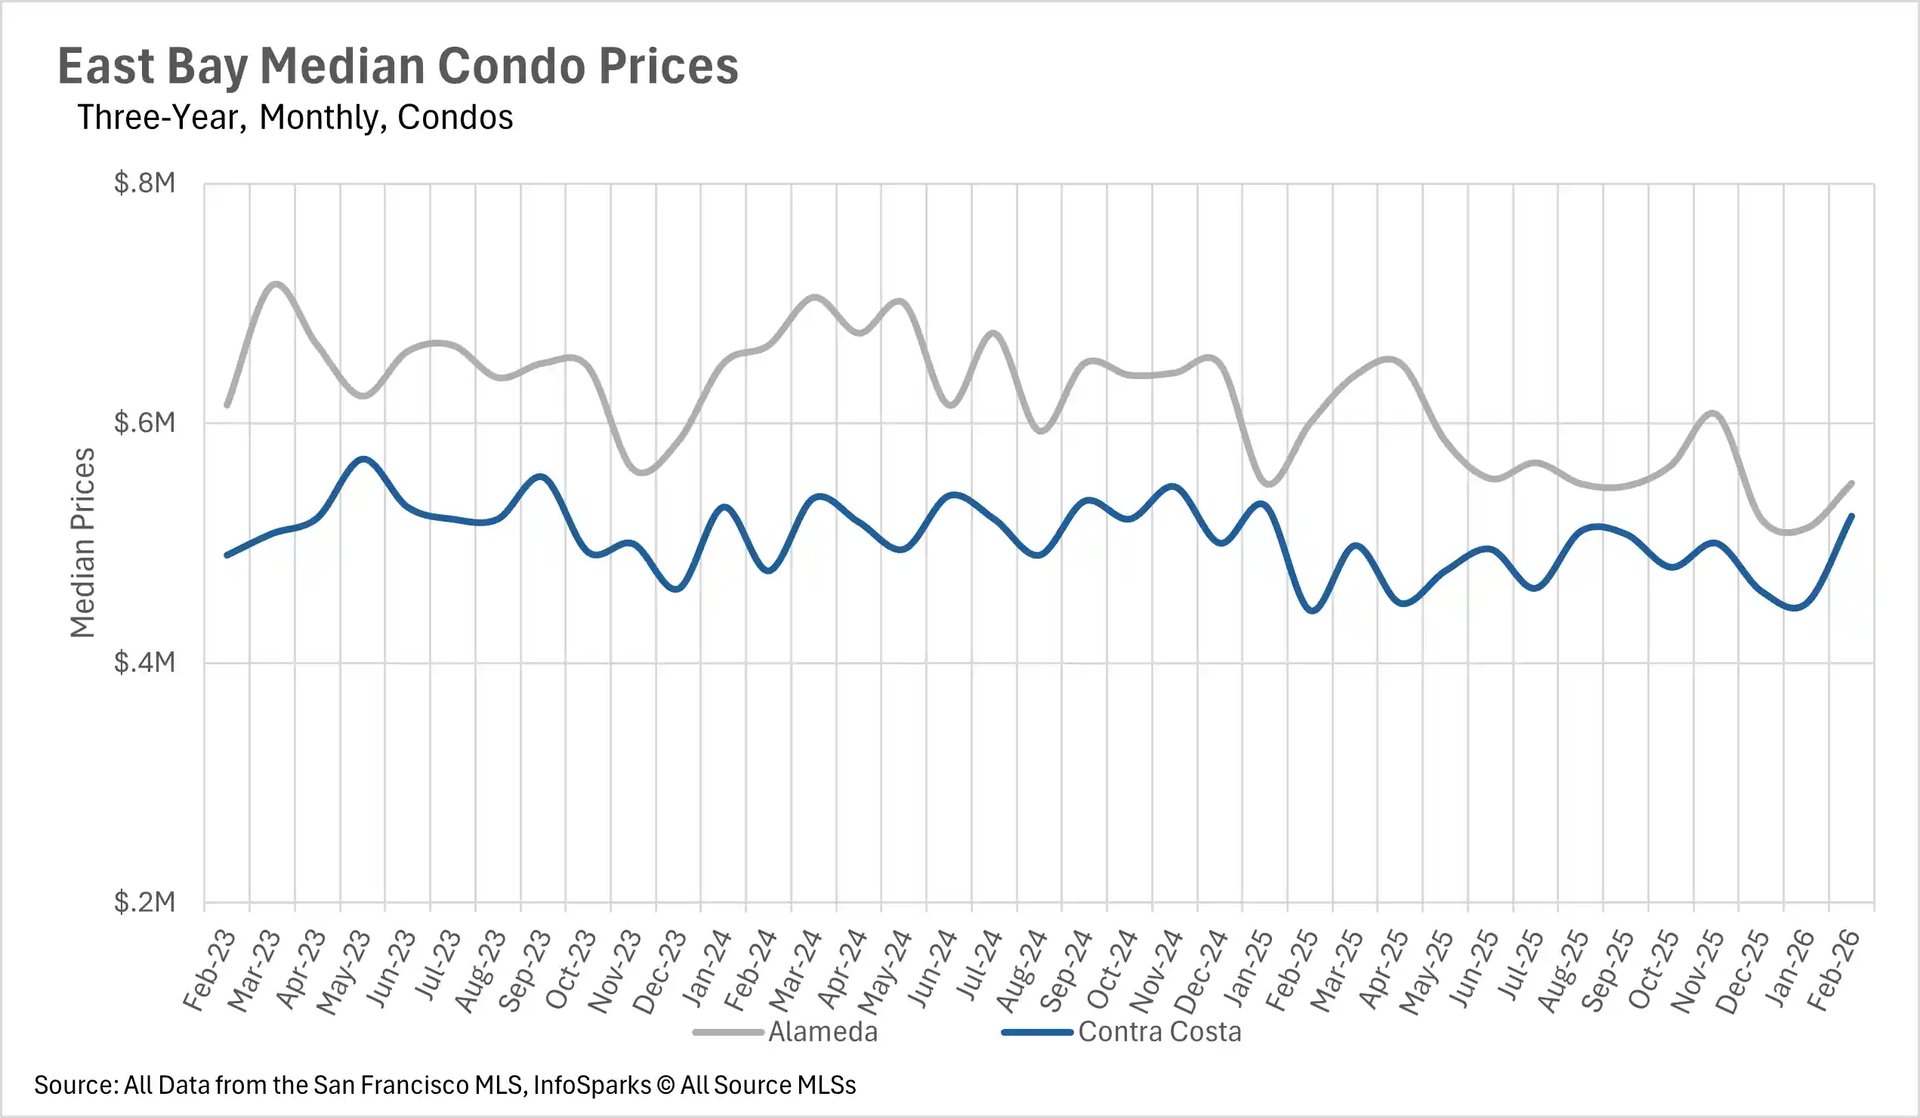
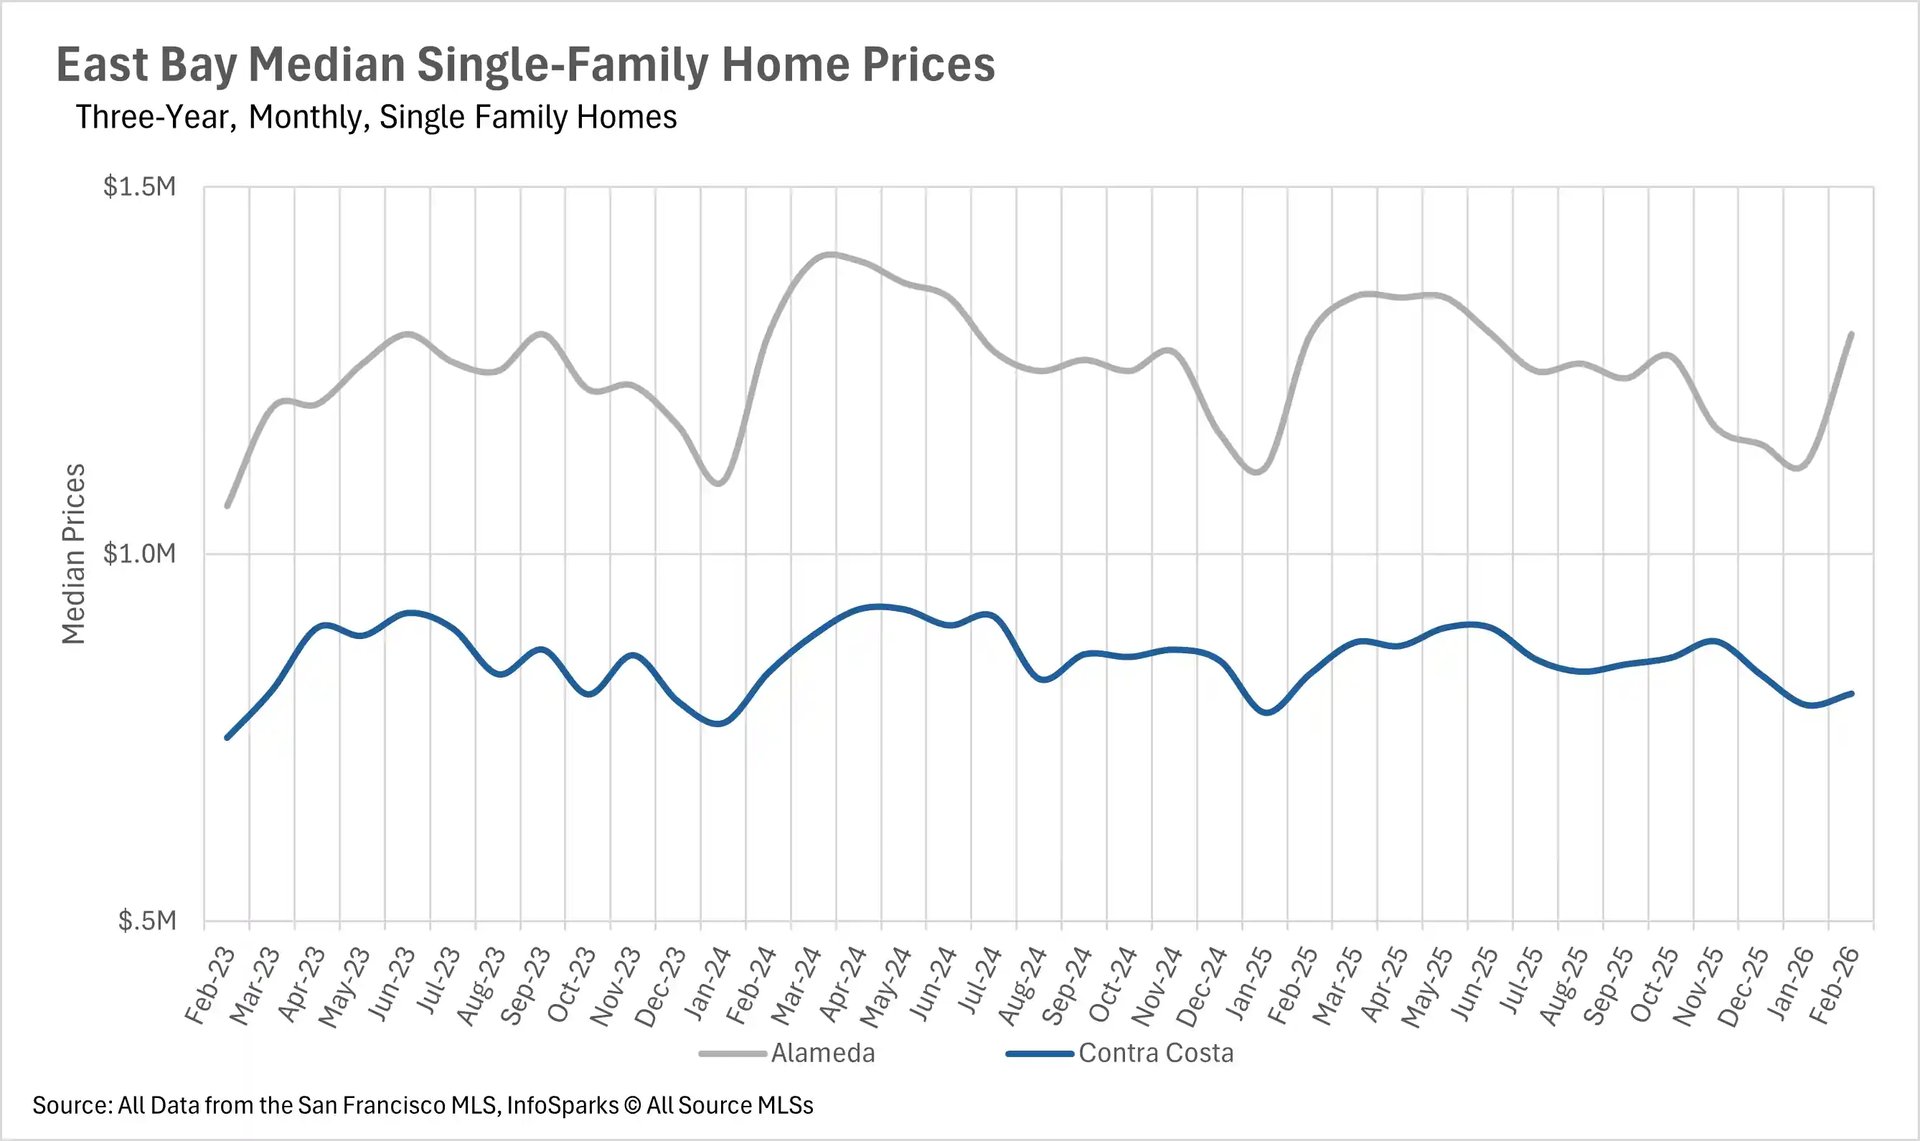
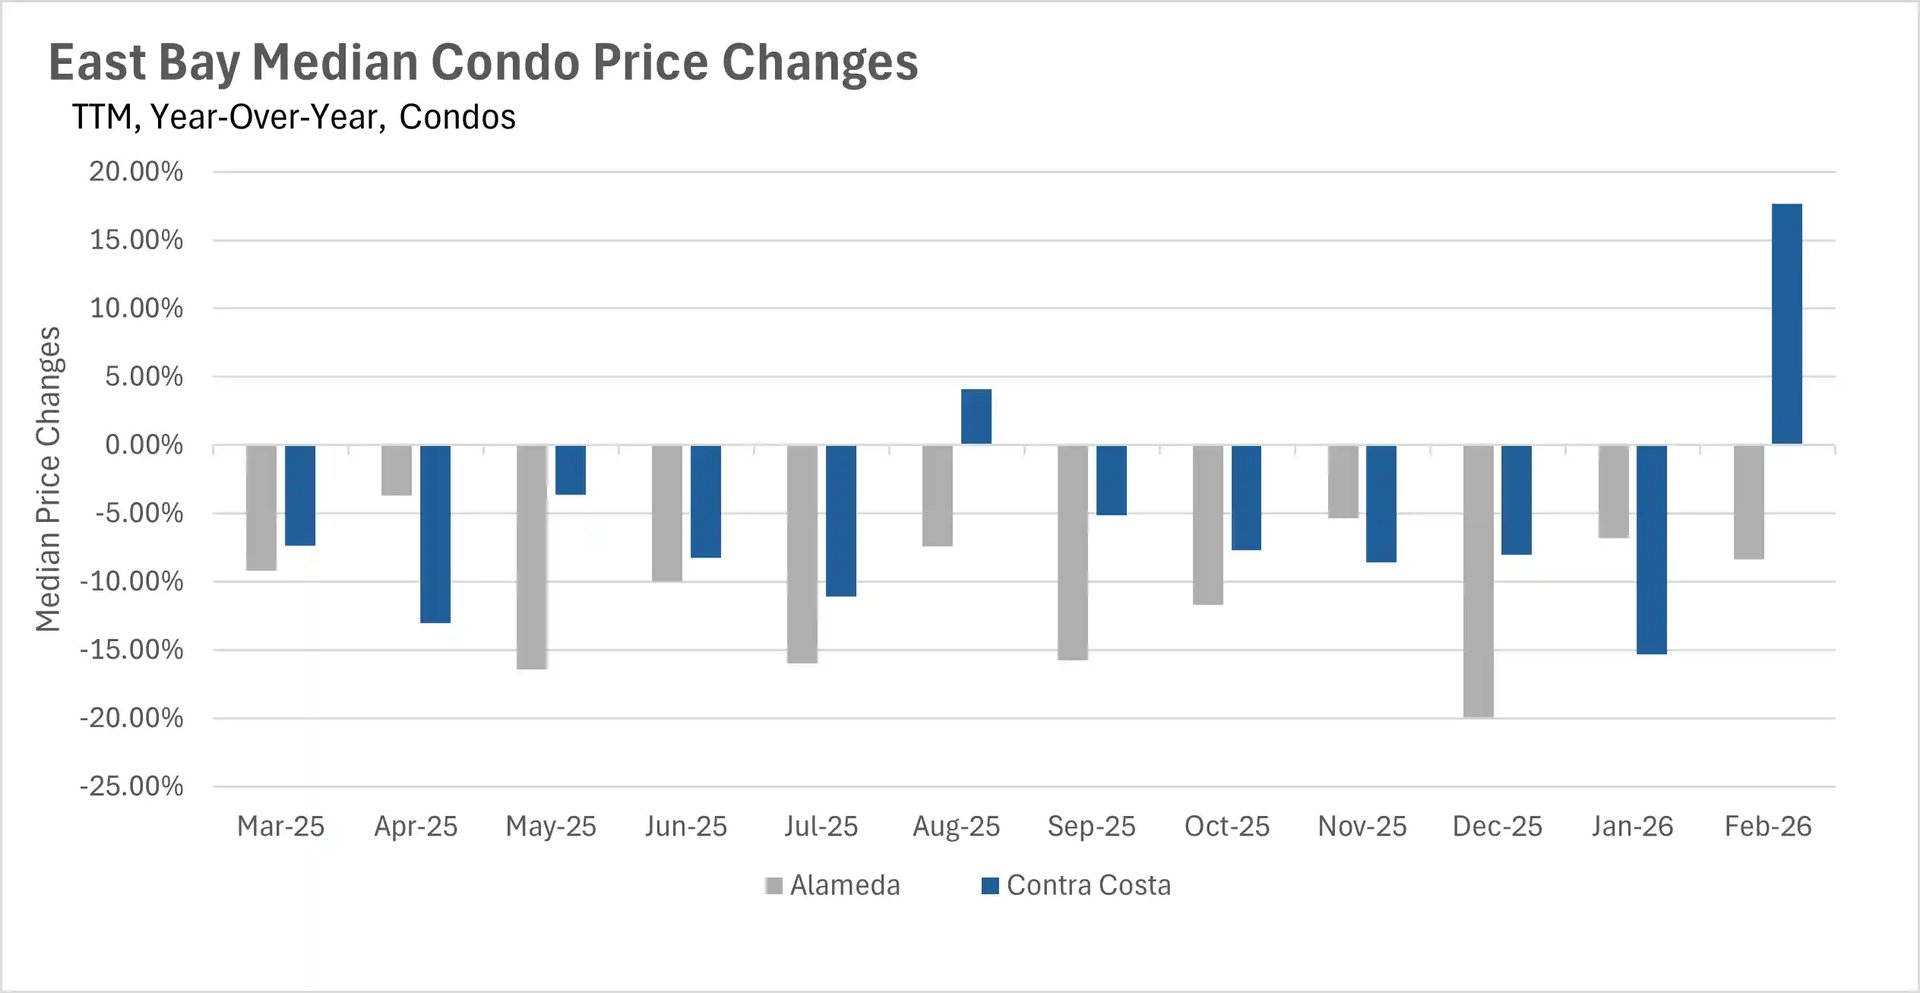
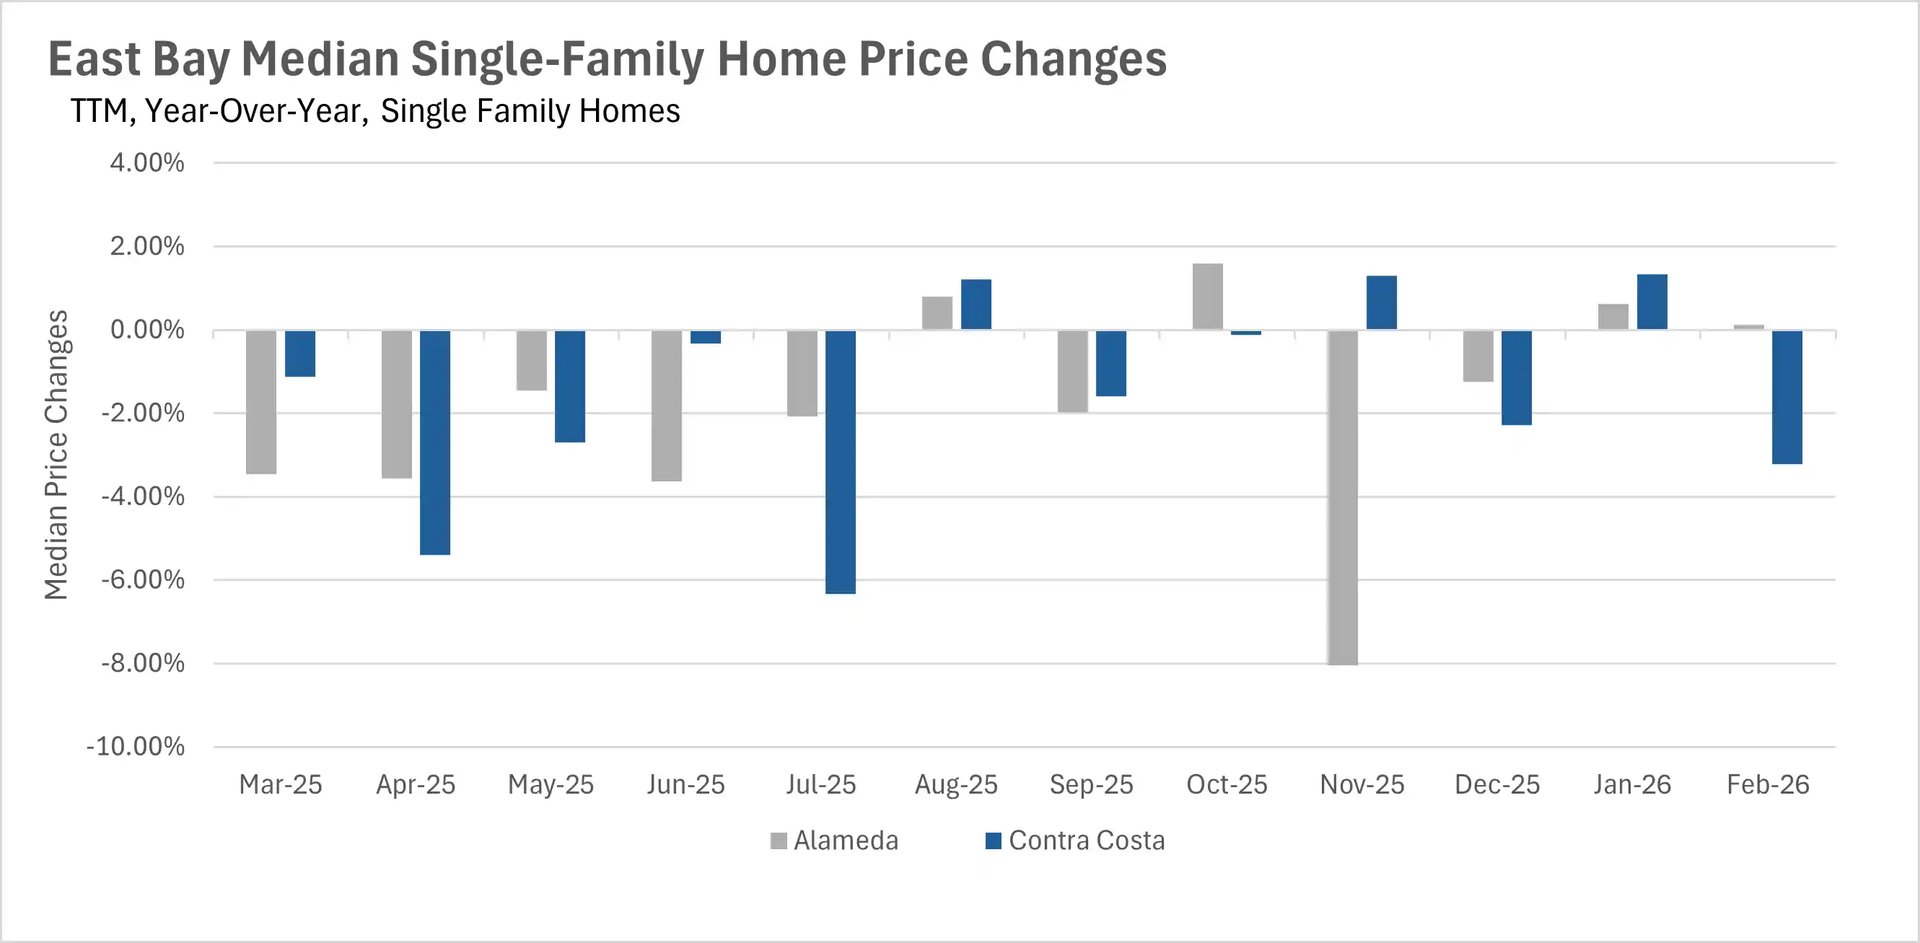
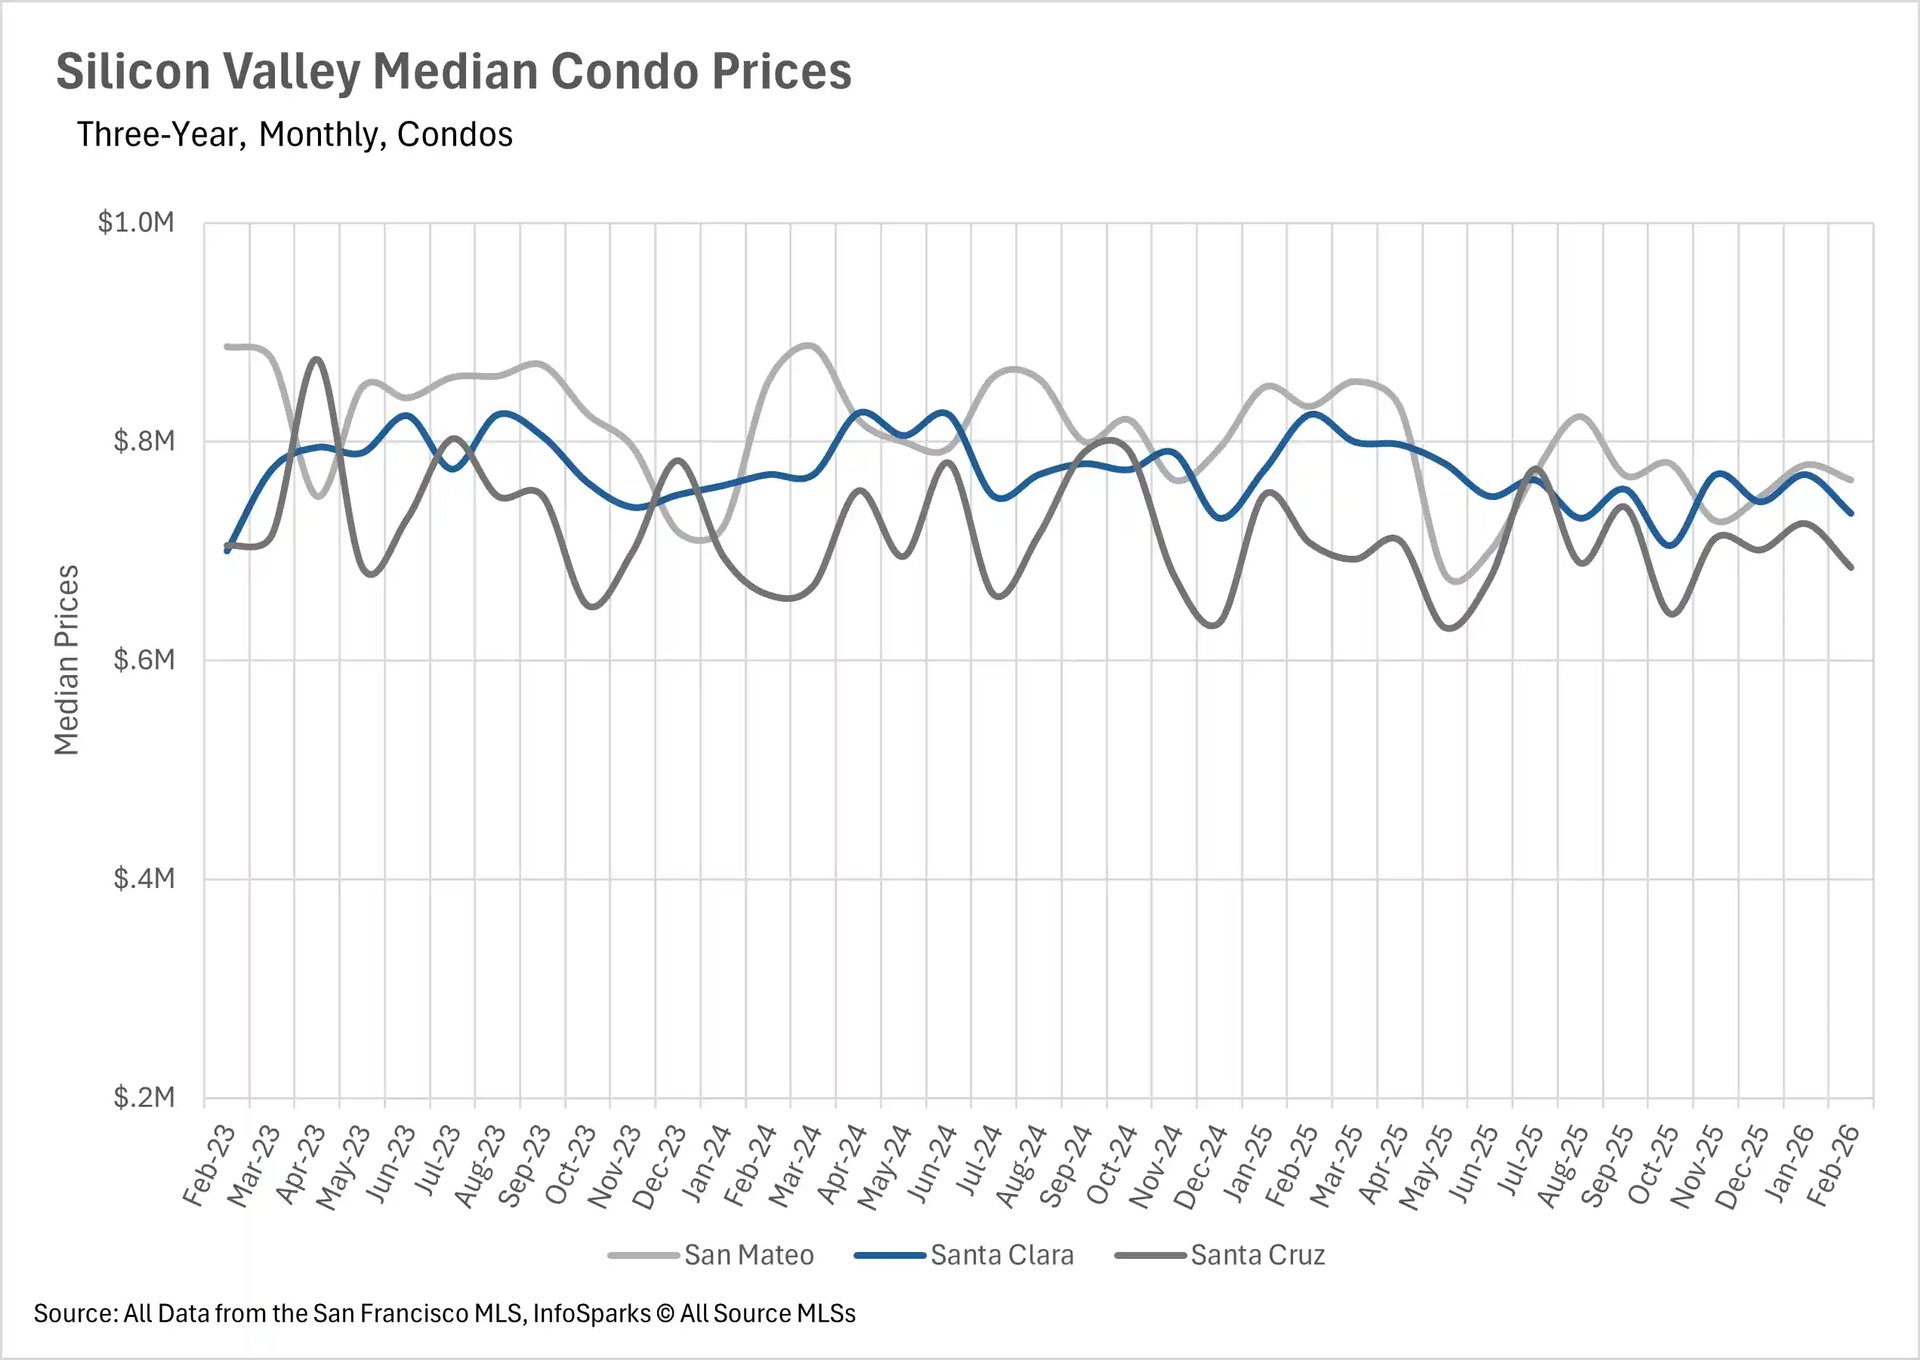
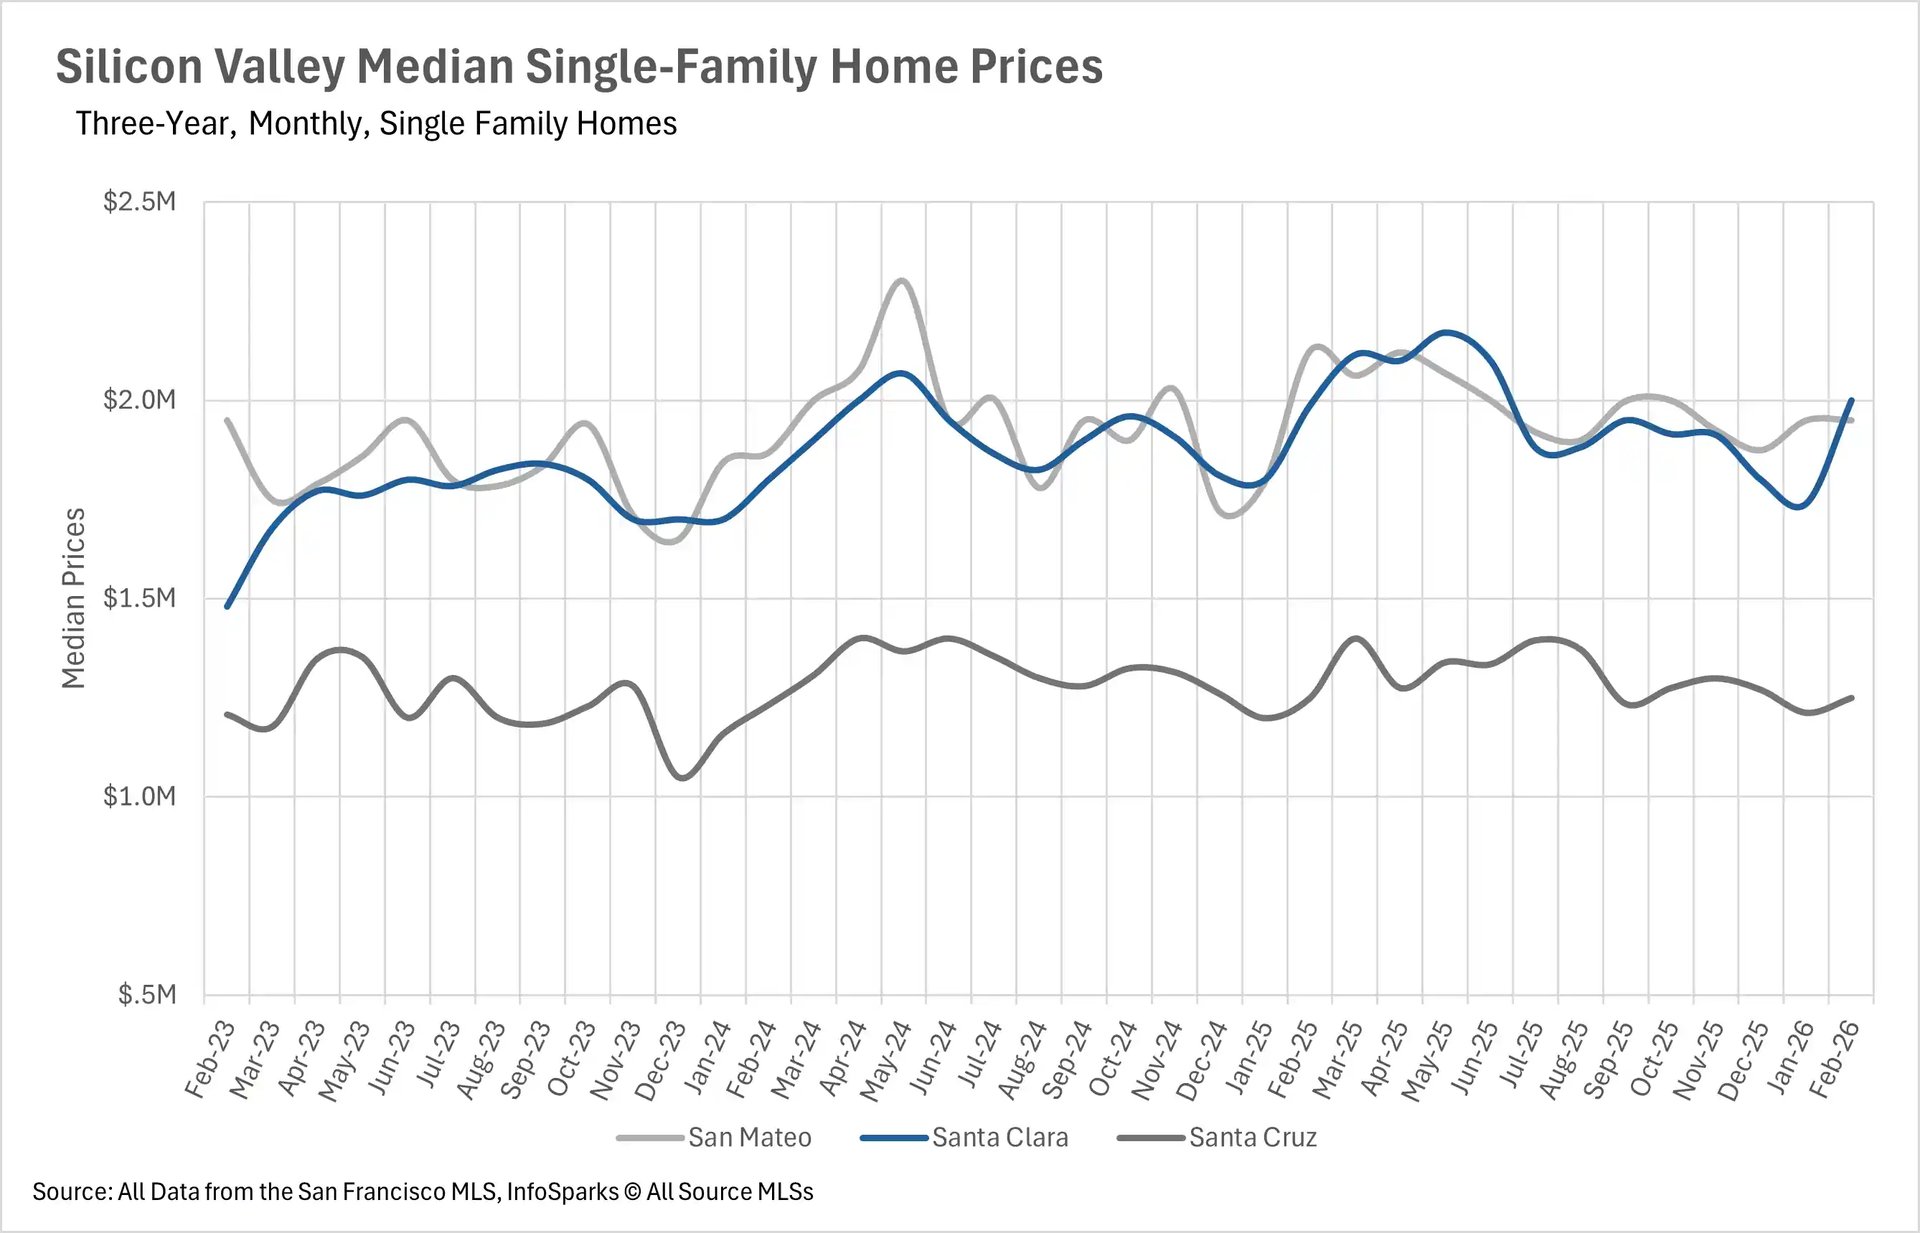
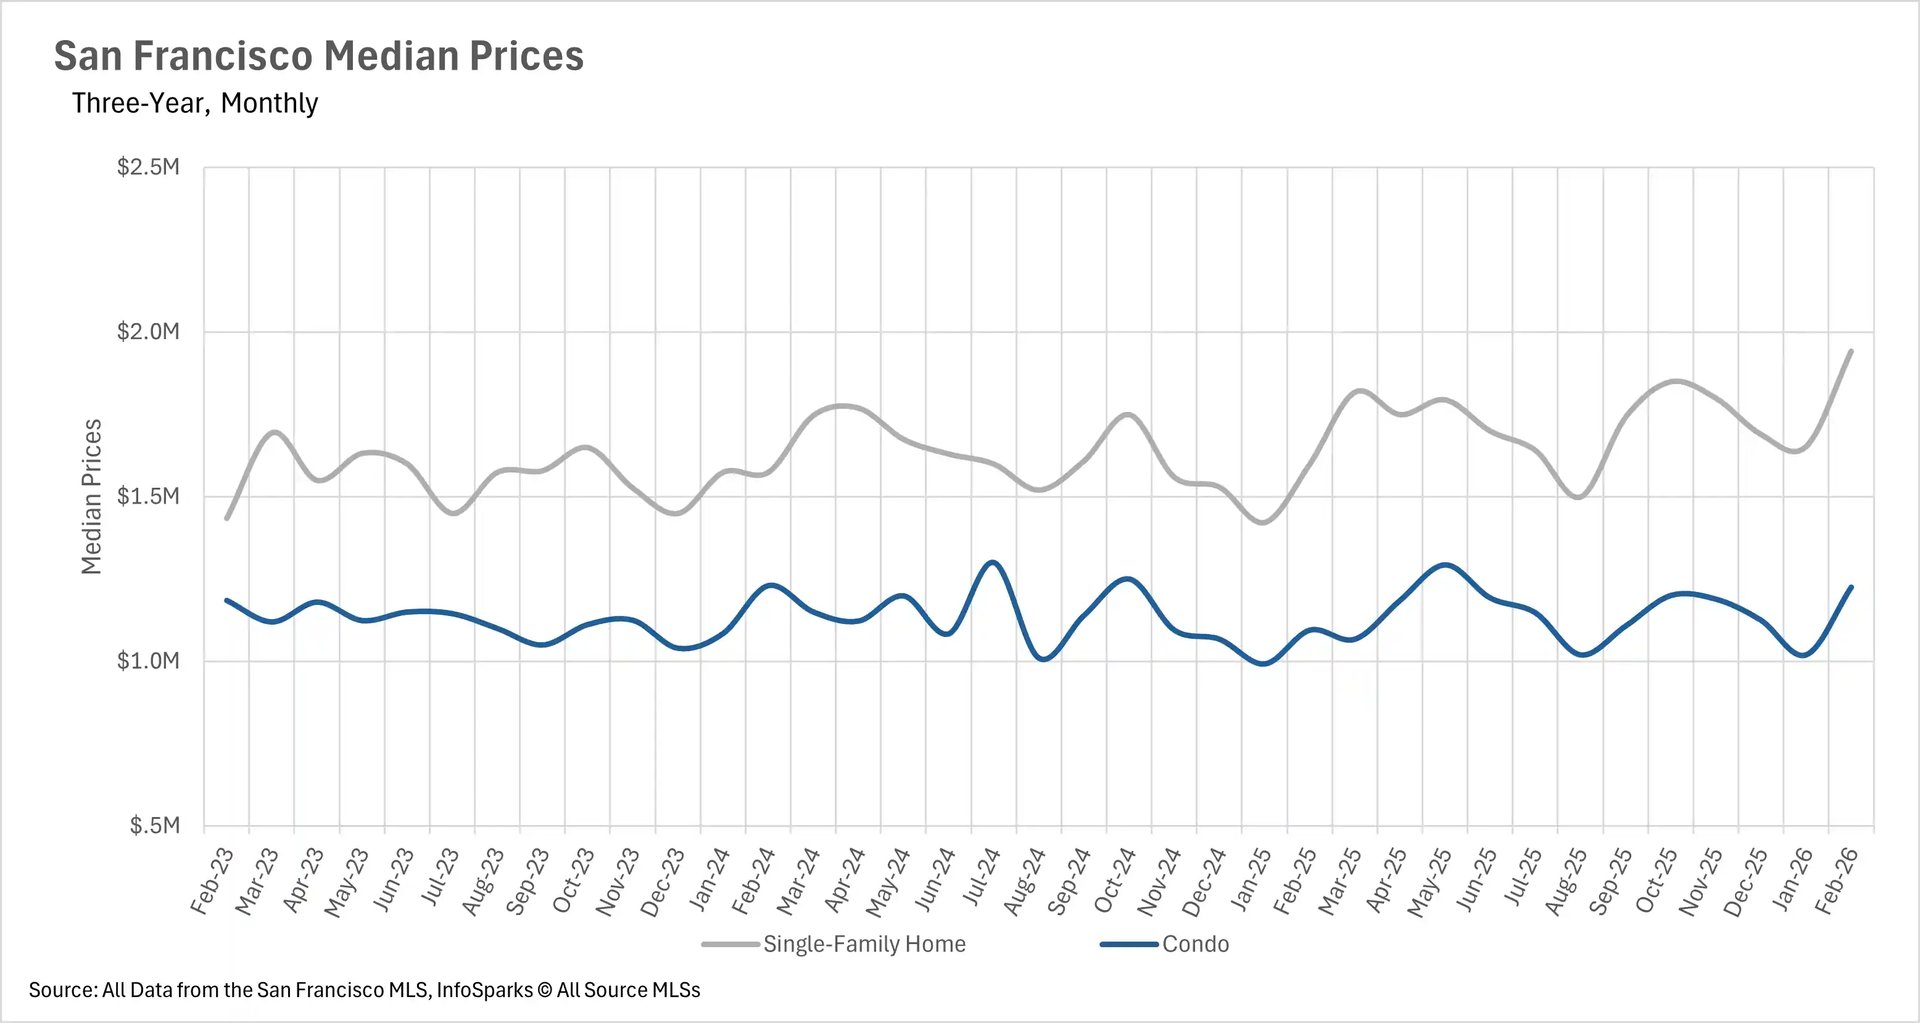
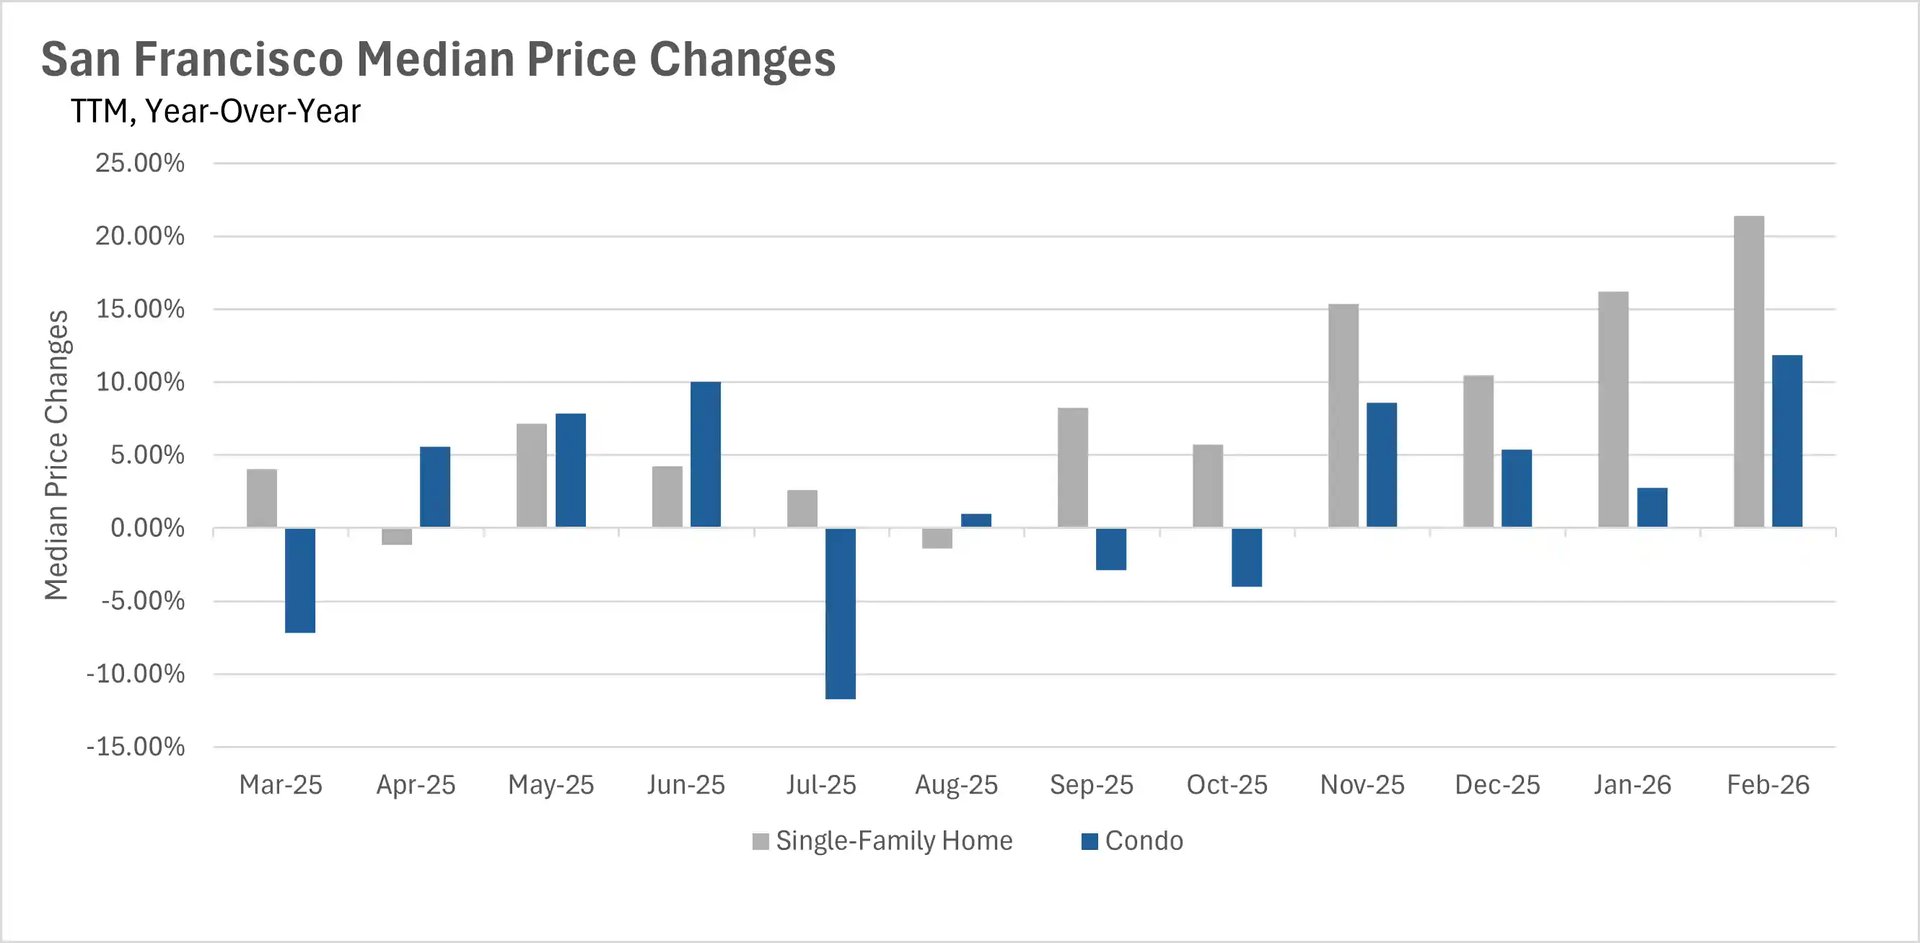
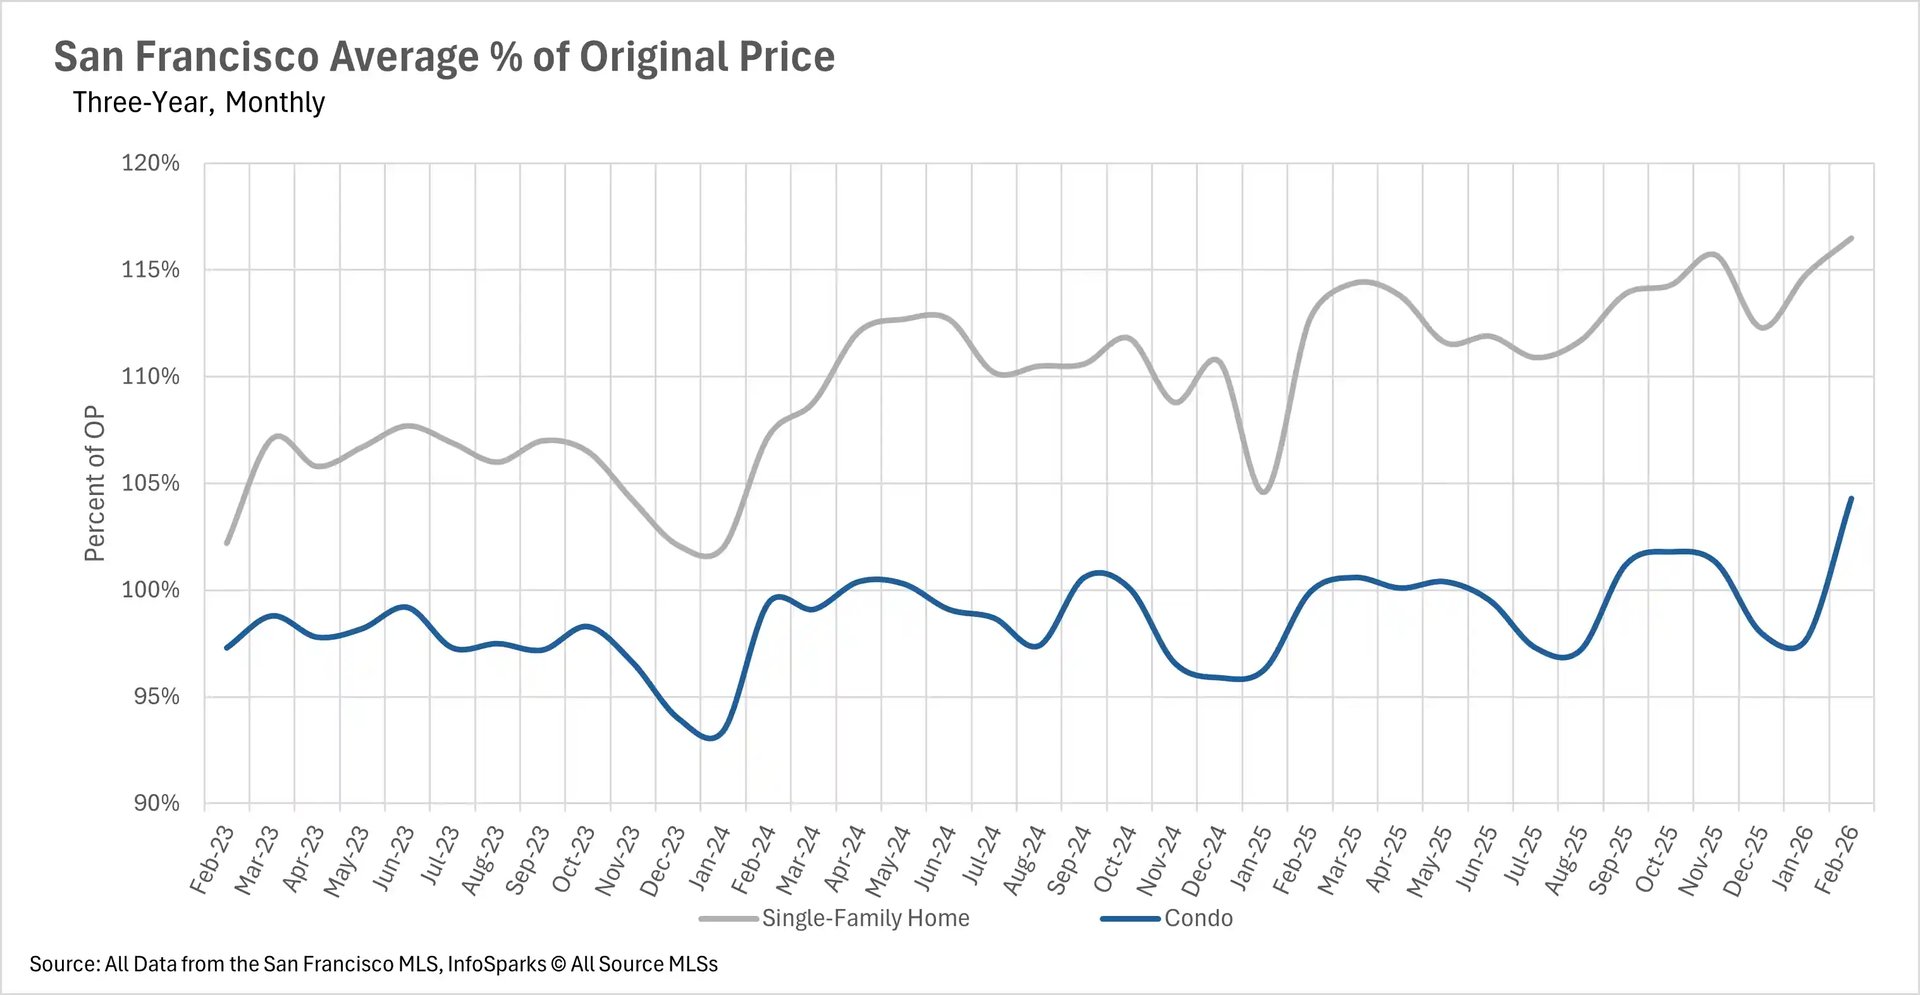
February brought a wide range of price action across the Bay Area, highlighting just how localized real estate trends can be.  San Francisco led the way with a remarkable 21.41% year-over-year increase in single-family home median sale price, with the median home selling for $1,942,500.  Condos in San Francisco also had an exceptional month, climbing 11.87% to $1,225,000.  In the East Bay, Alameda County's median single-family home price returned to the $1,300,000 mark, essentially flat year-over-year, while Contra Costa County saw a modest 3.23% decline to $810,000.  

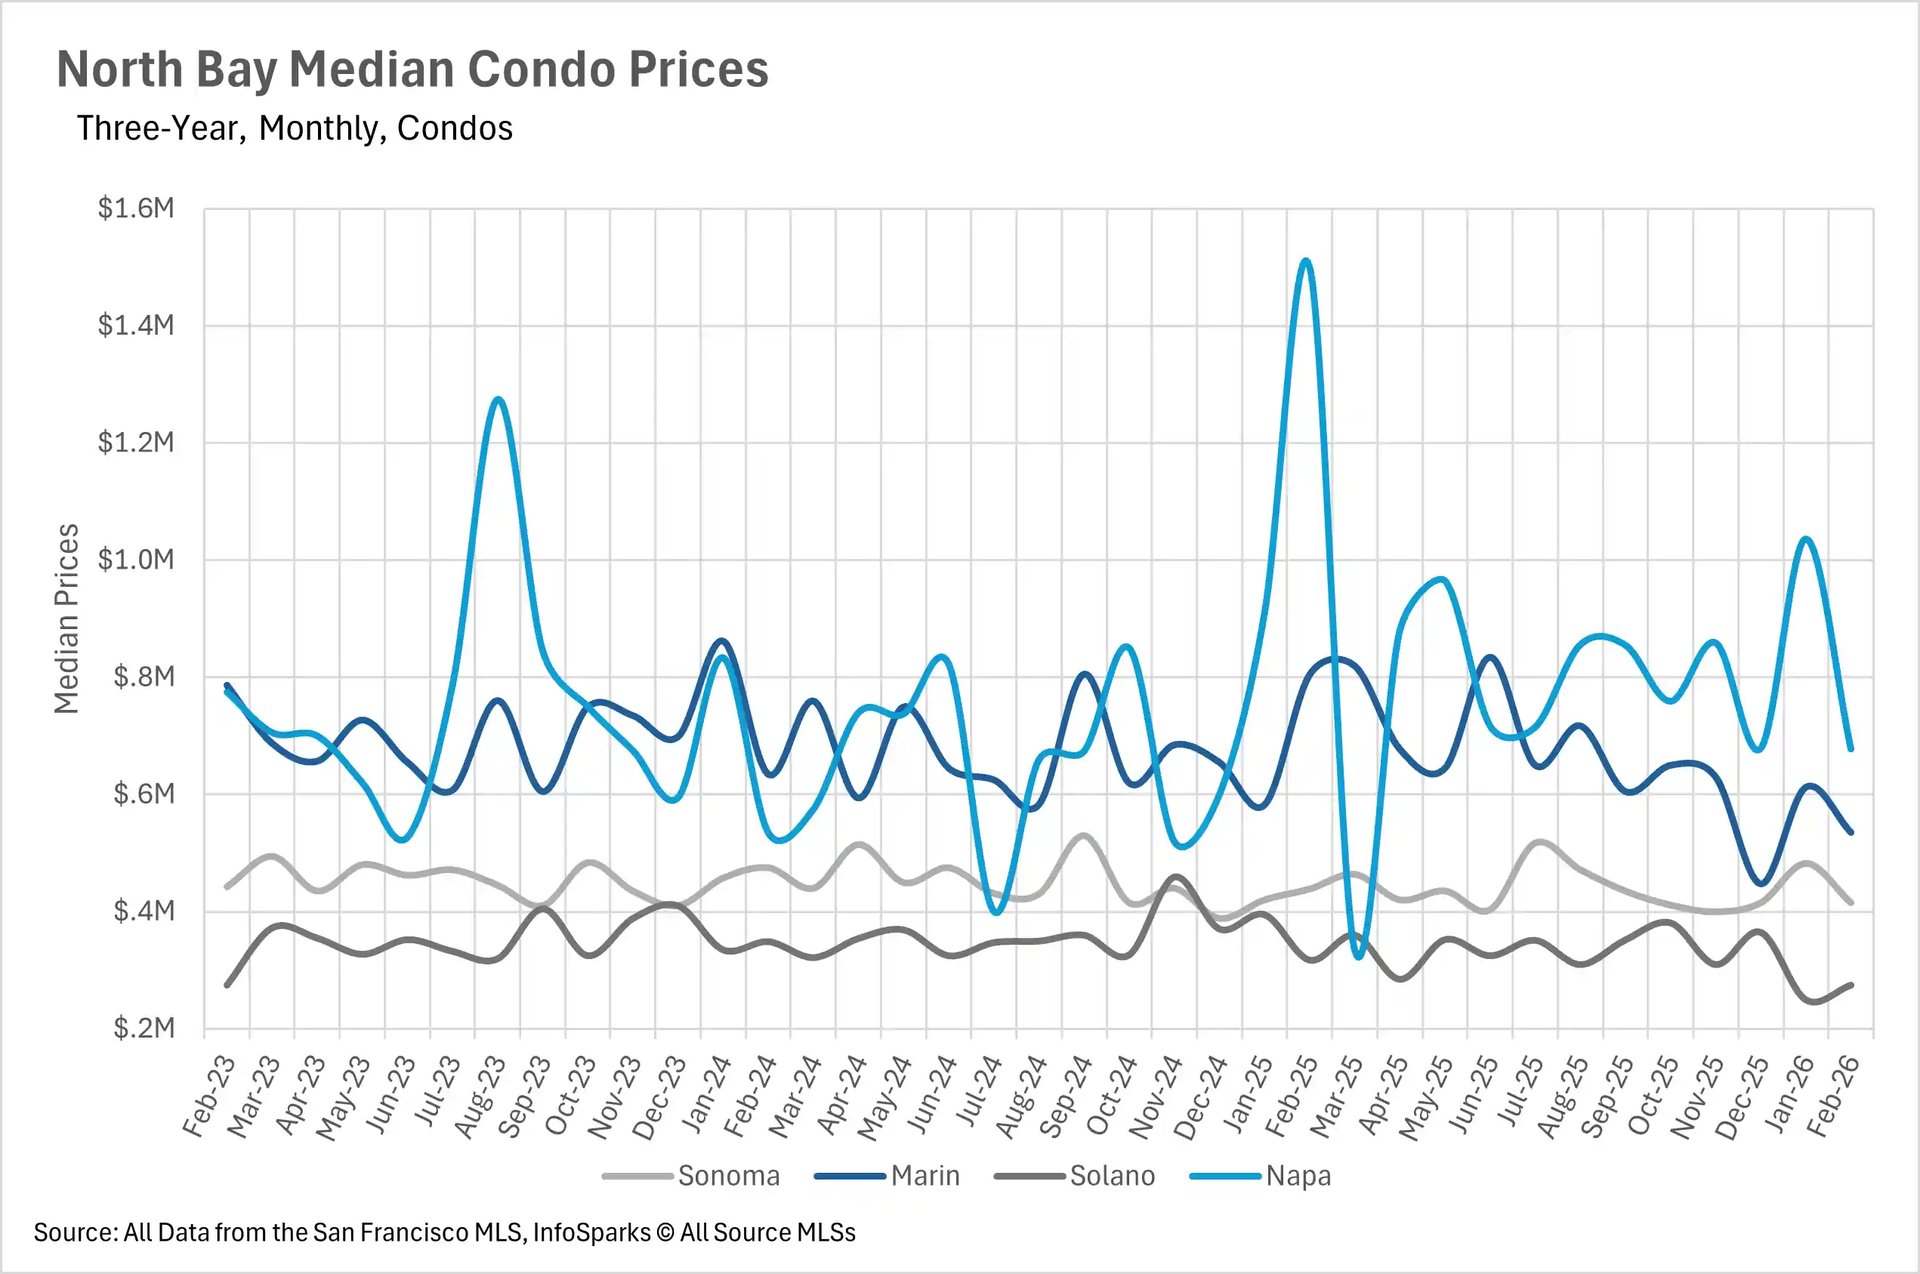
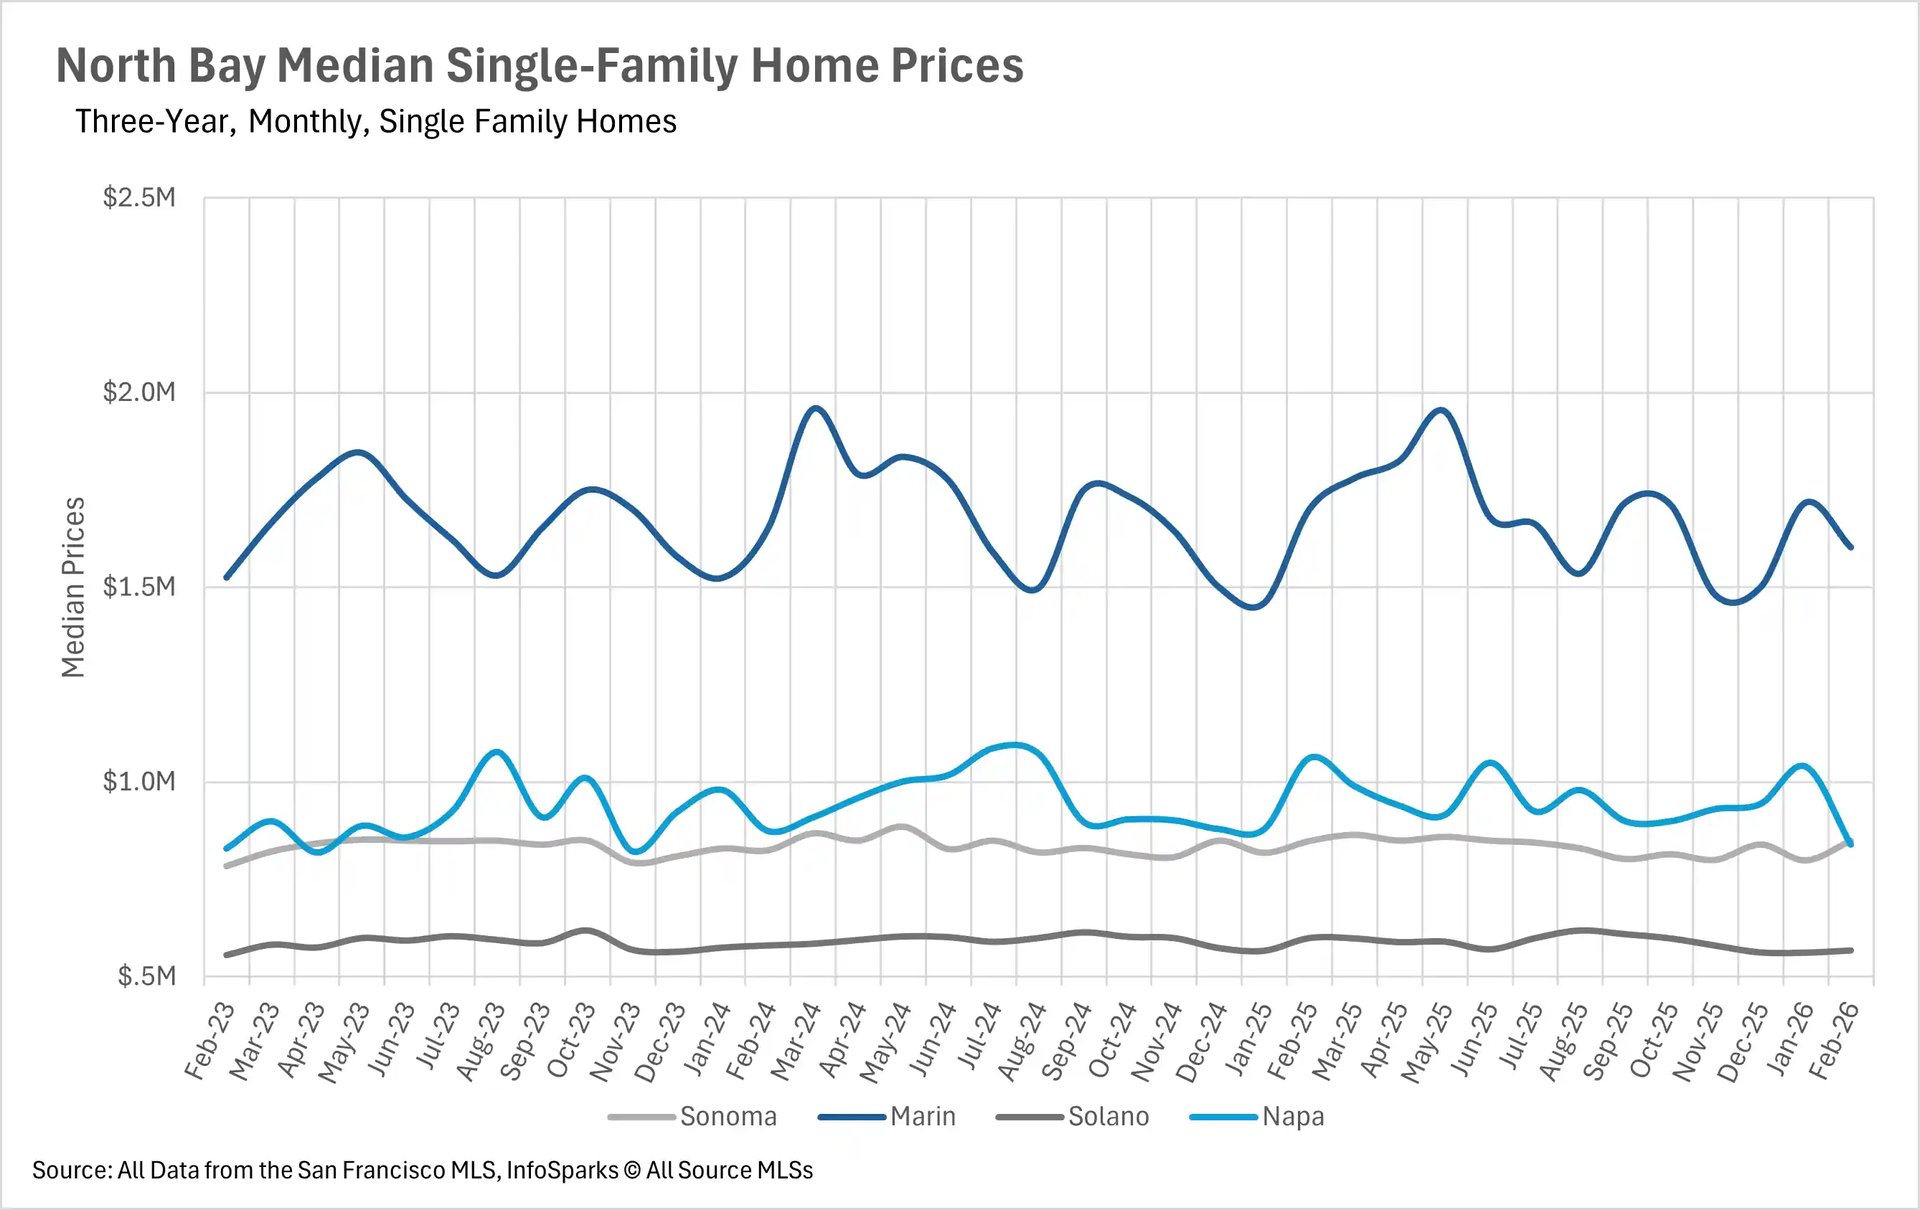
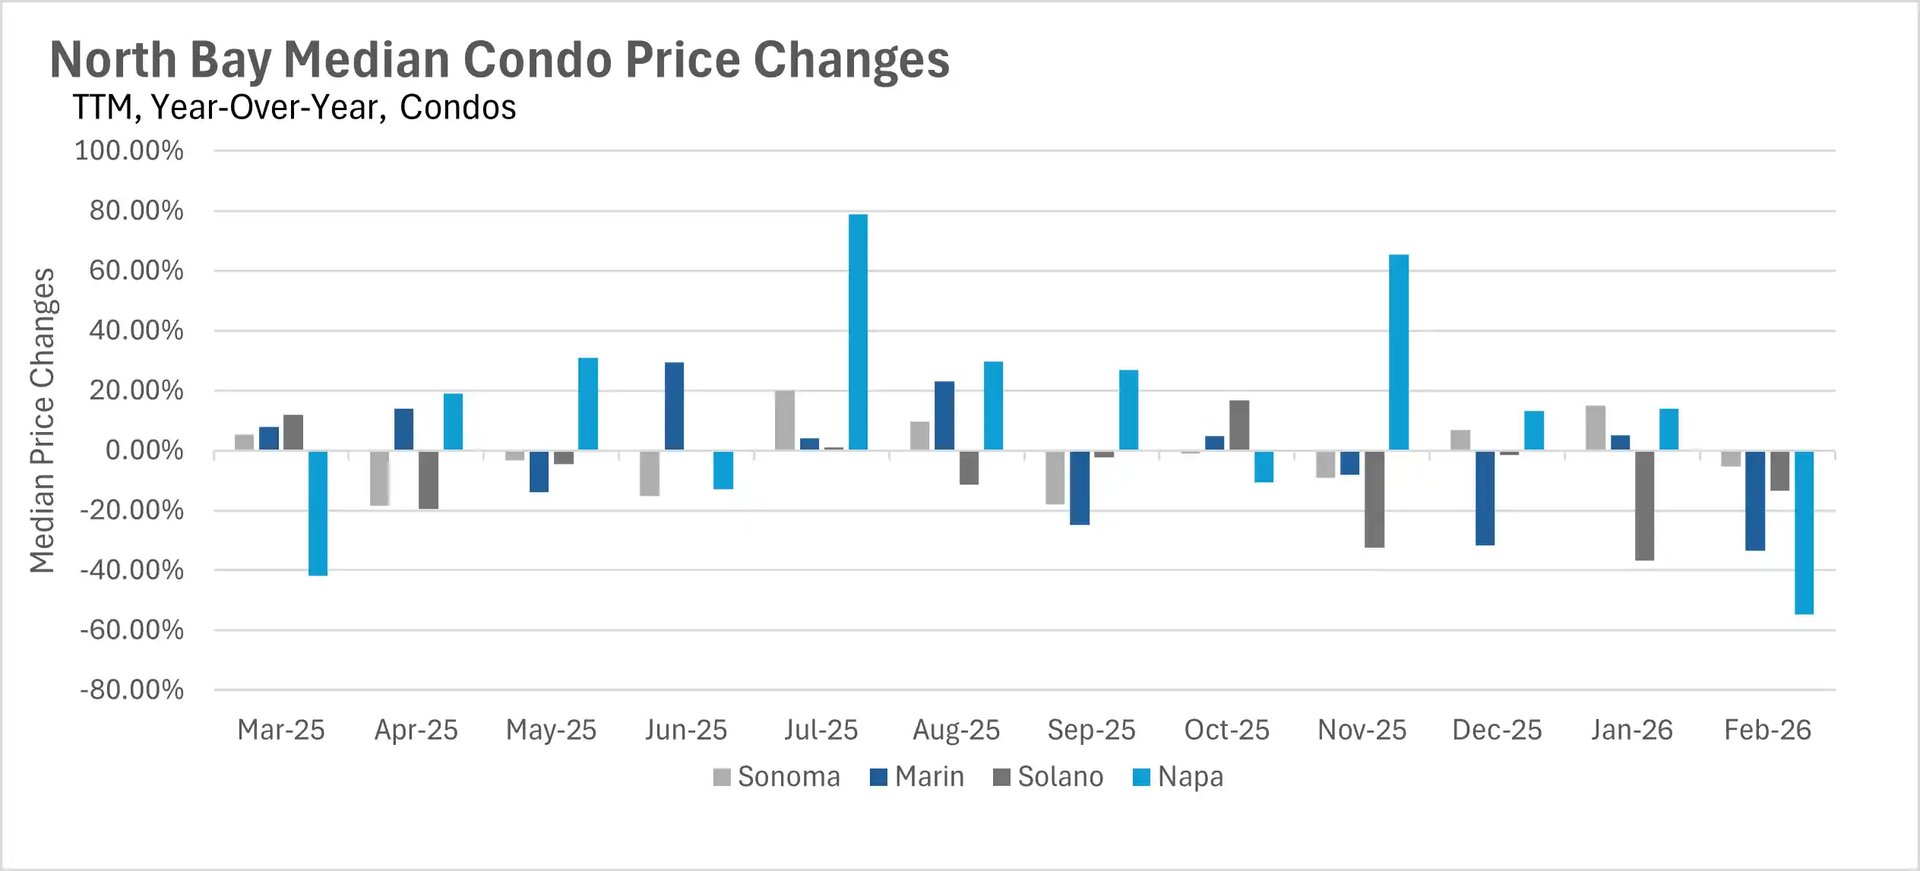
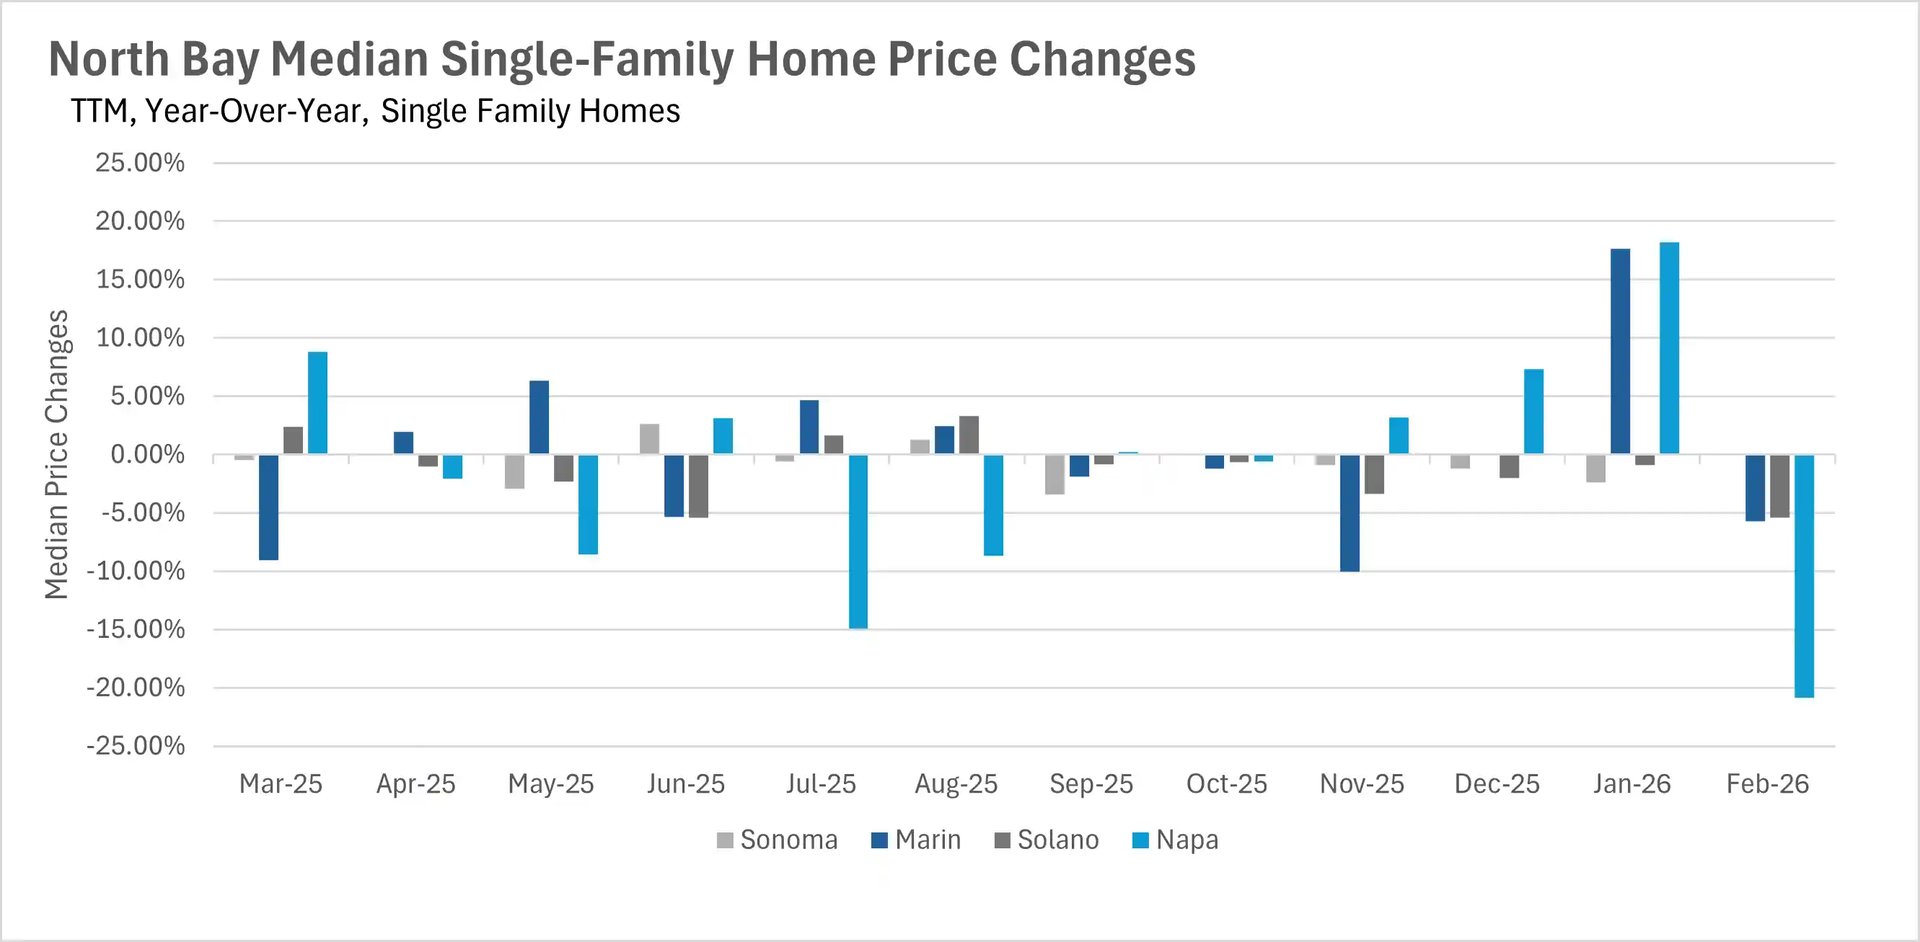
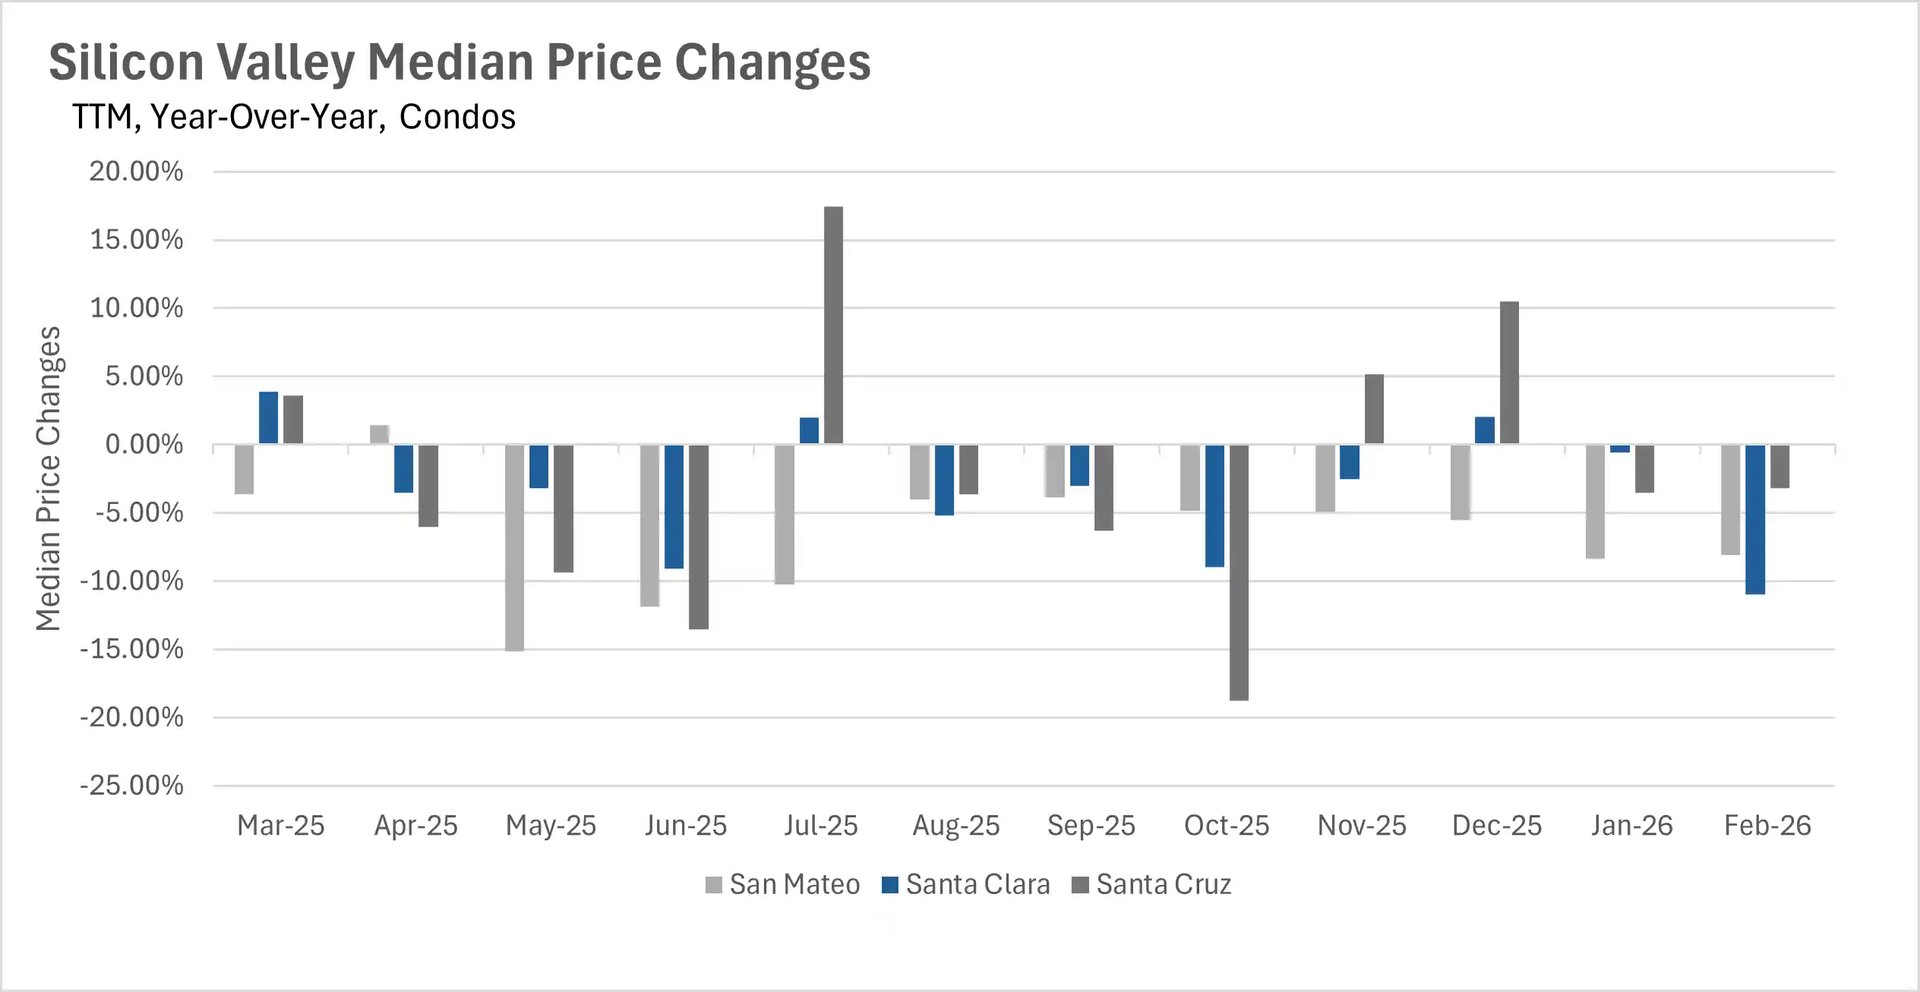
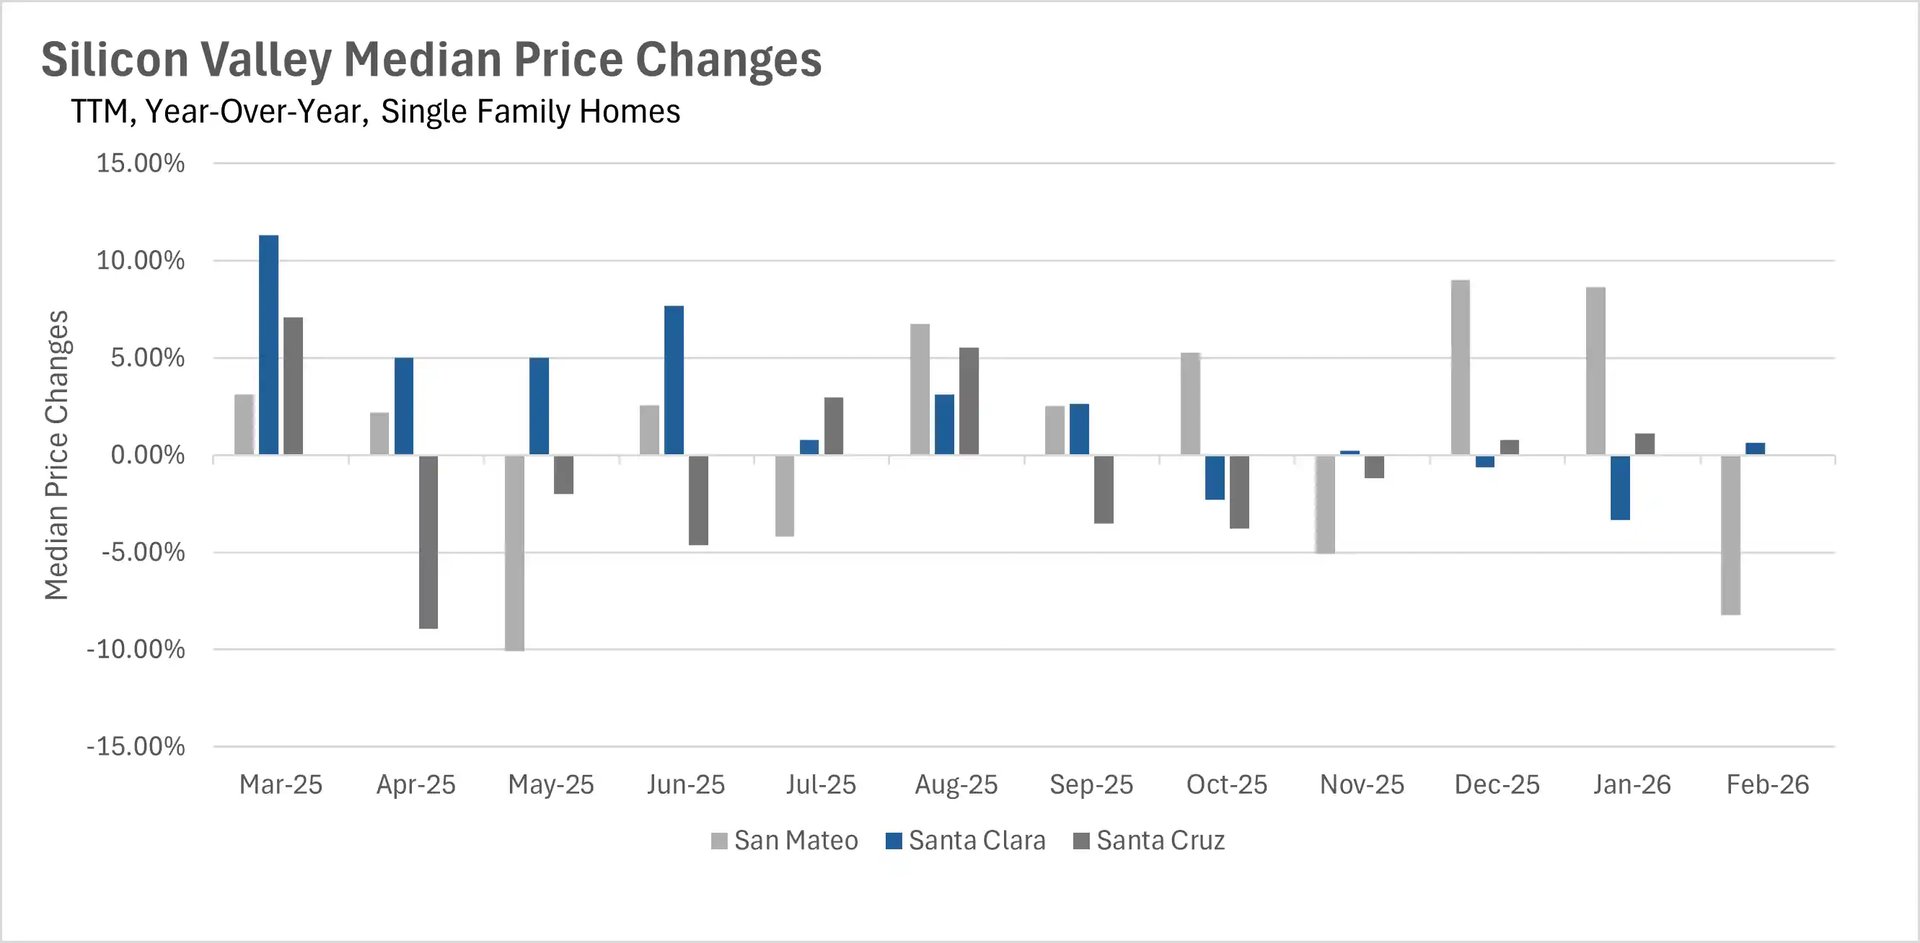
Silicon Valley was a mixed bag, with Santa Clara County posting a slight 0.63% gain to $2,000,000, while San Mateo County dropped 8.24% to $1,950,000.  The North Bay experienced the most widespread weakness, as Napa County single-family homes fell 20.86% to $840,500 and Marin County declined 5.74% to $1,602,500.  Across the region, the condo market continued to struggle, with declines in most counties, though Contra Costa County was a notable exception, posting a 17.68% year-over-year increase.

The Bay Area's inventory crisis shows no signs of easing

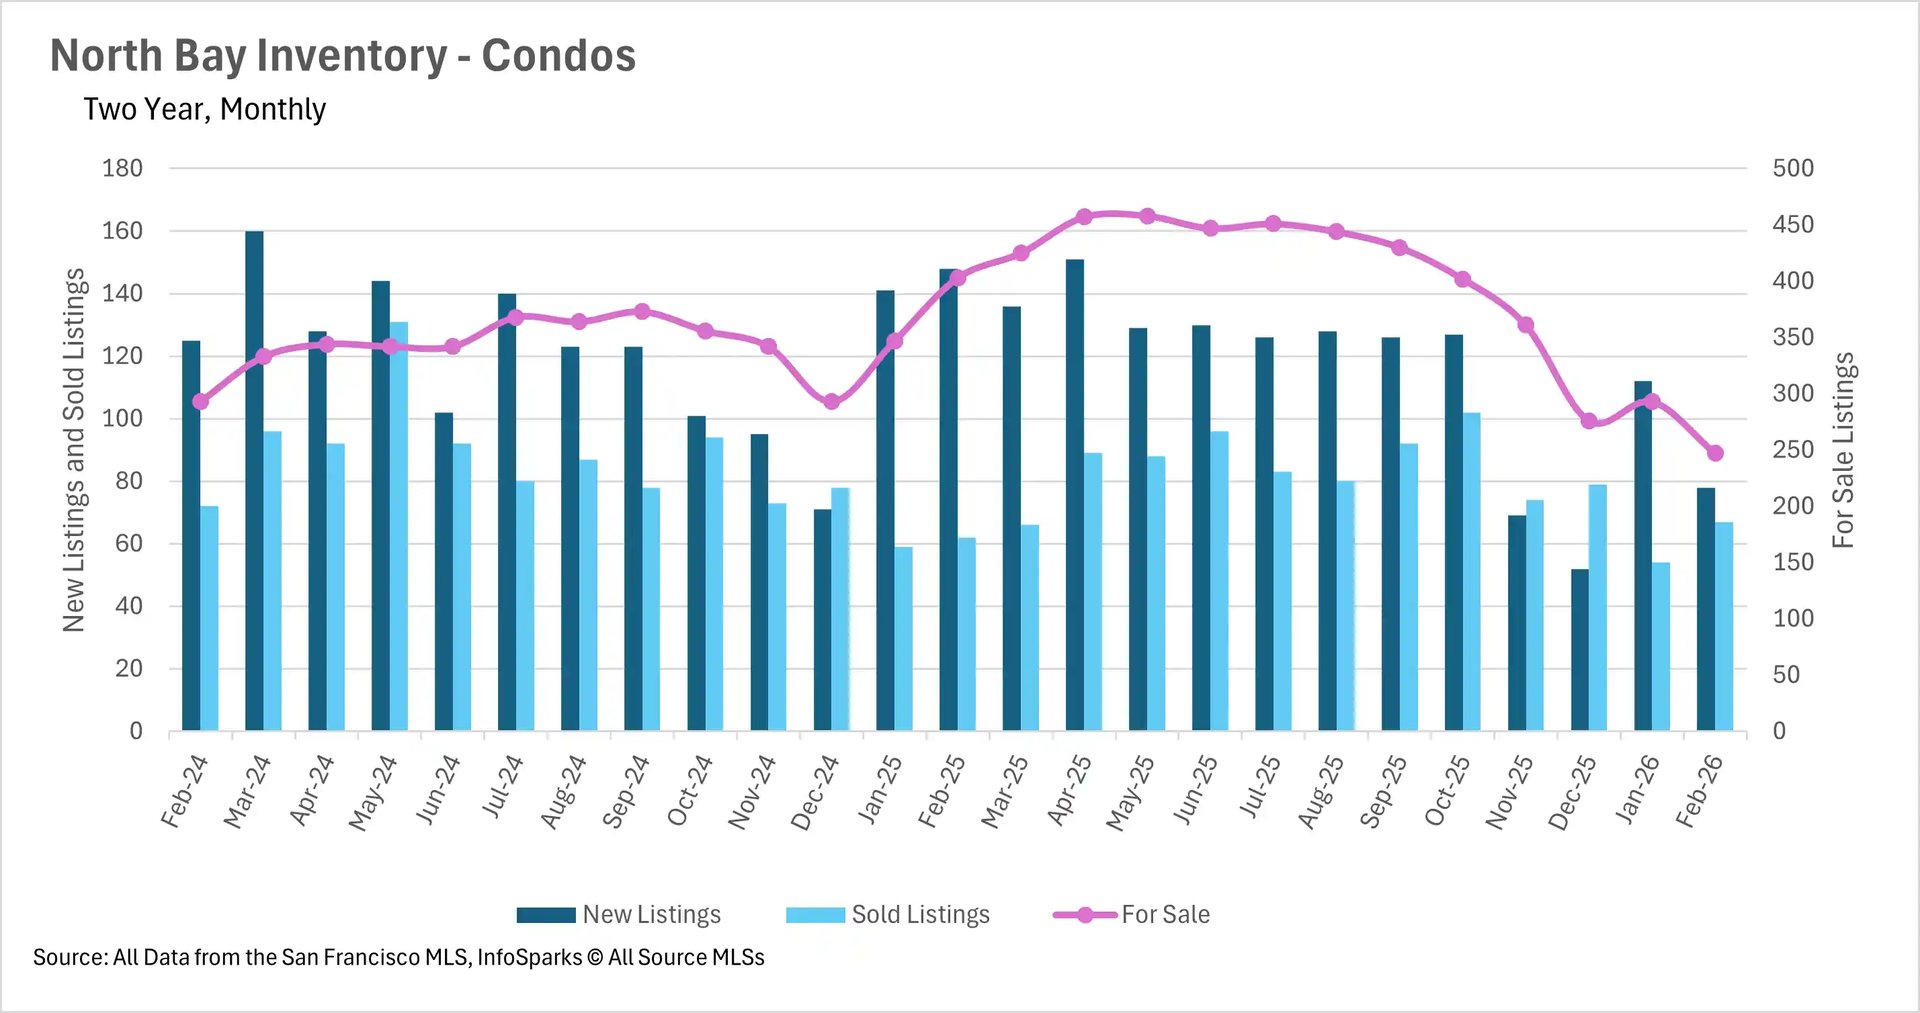
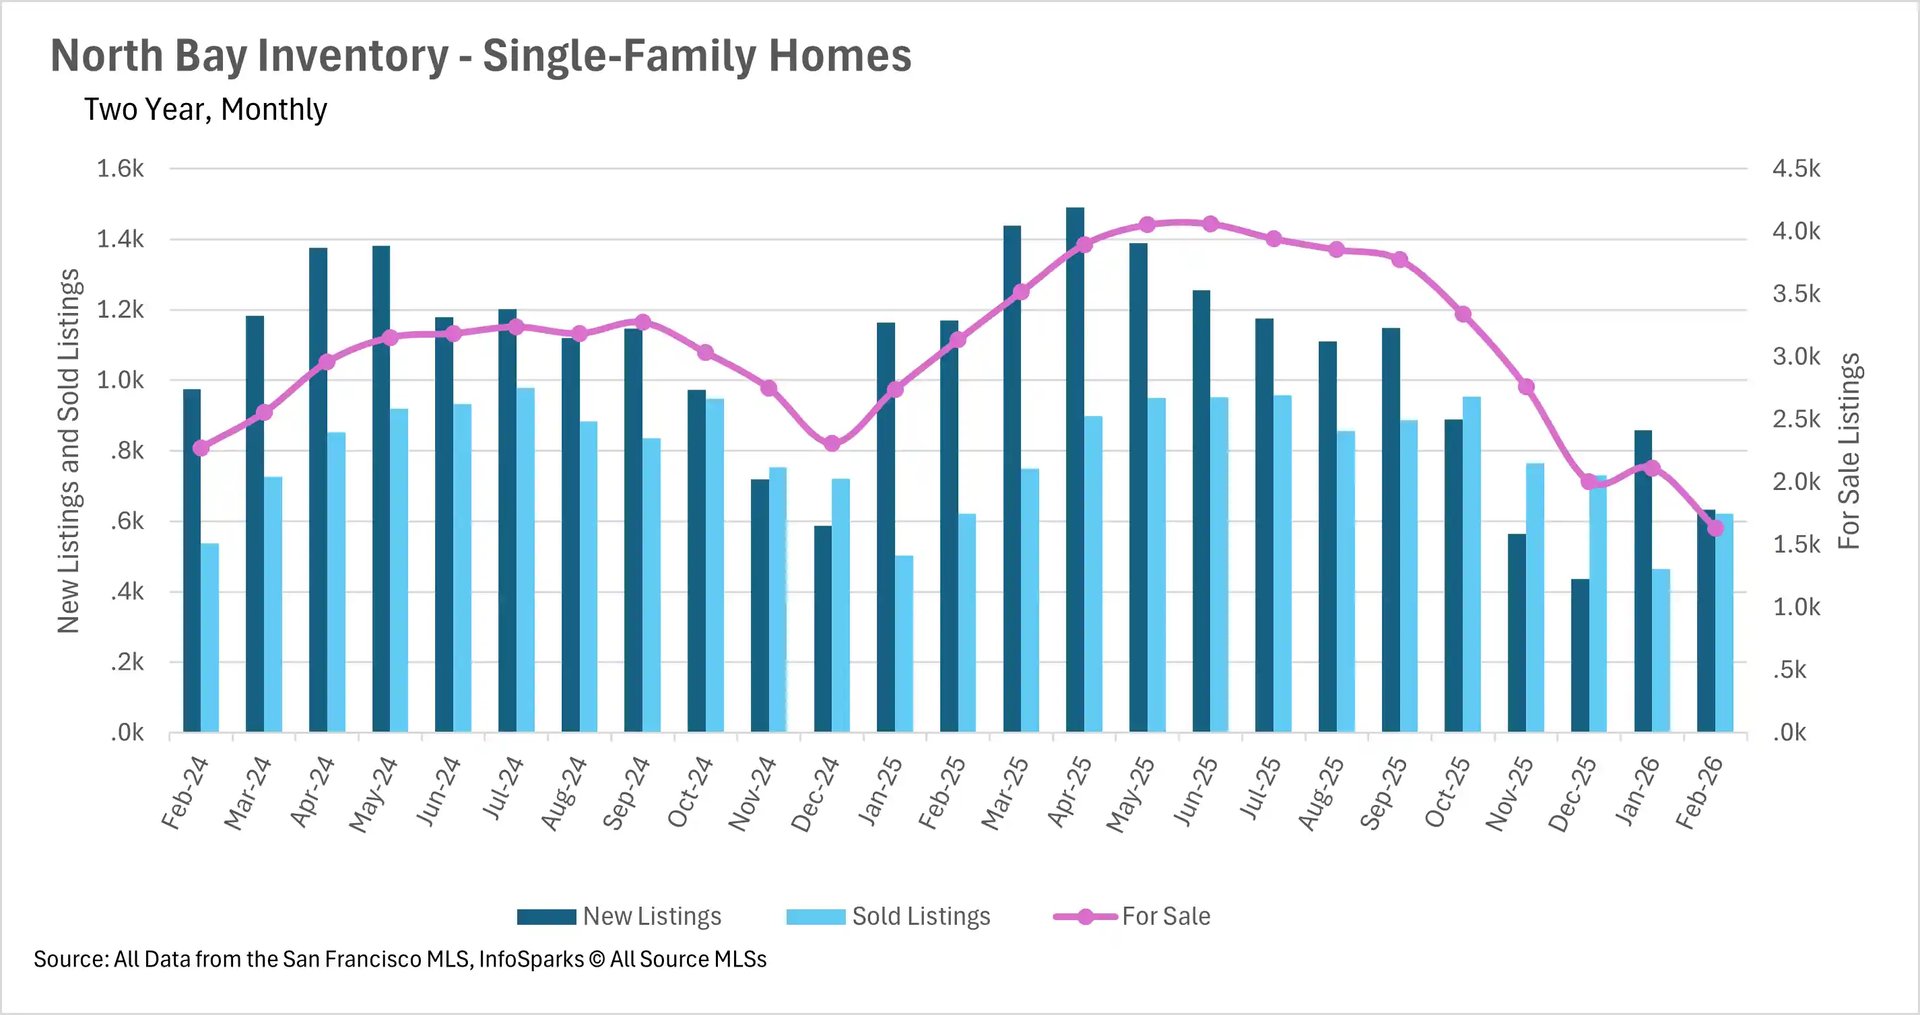
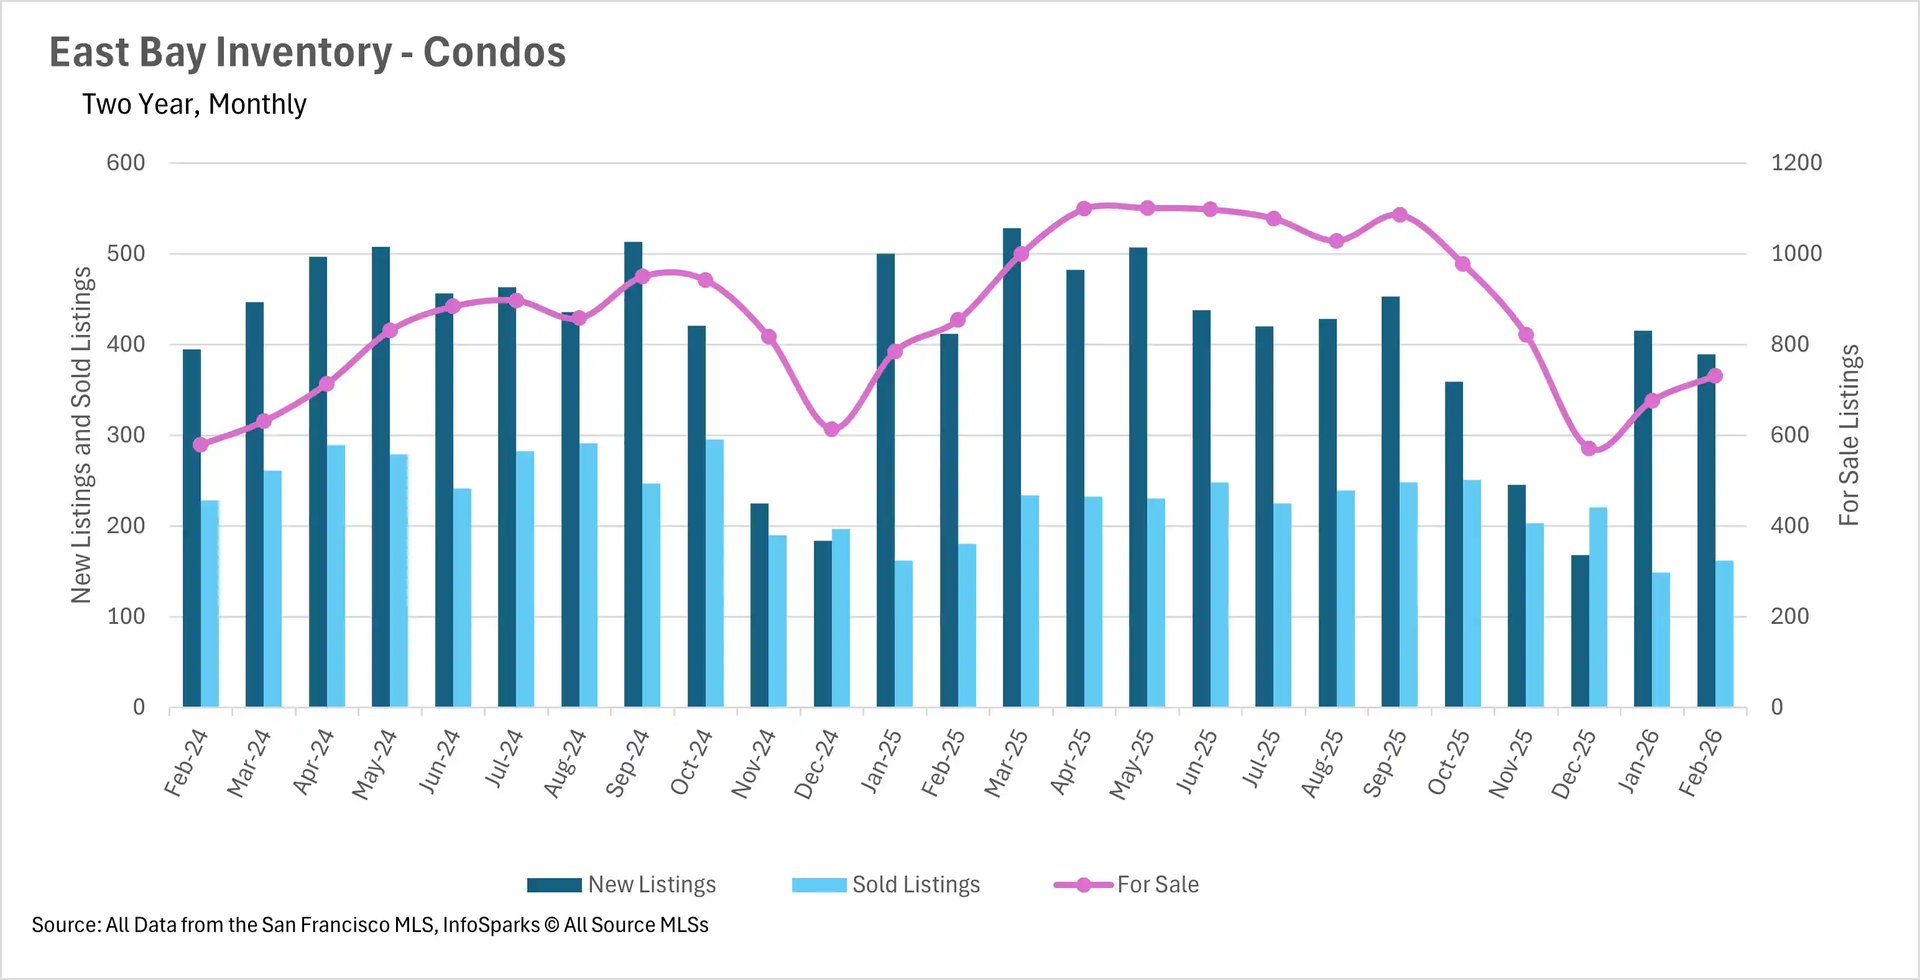
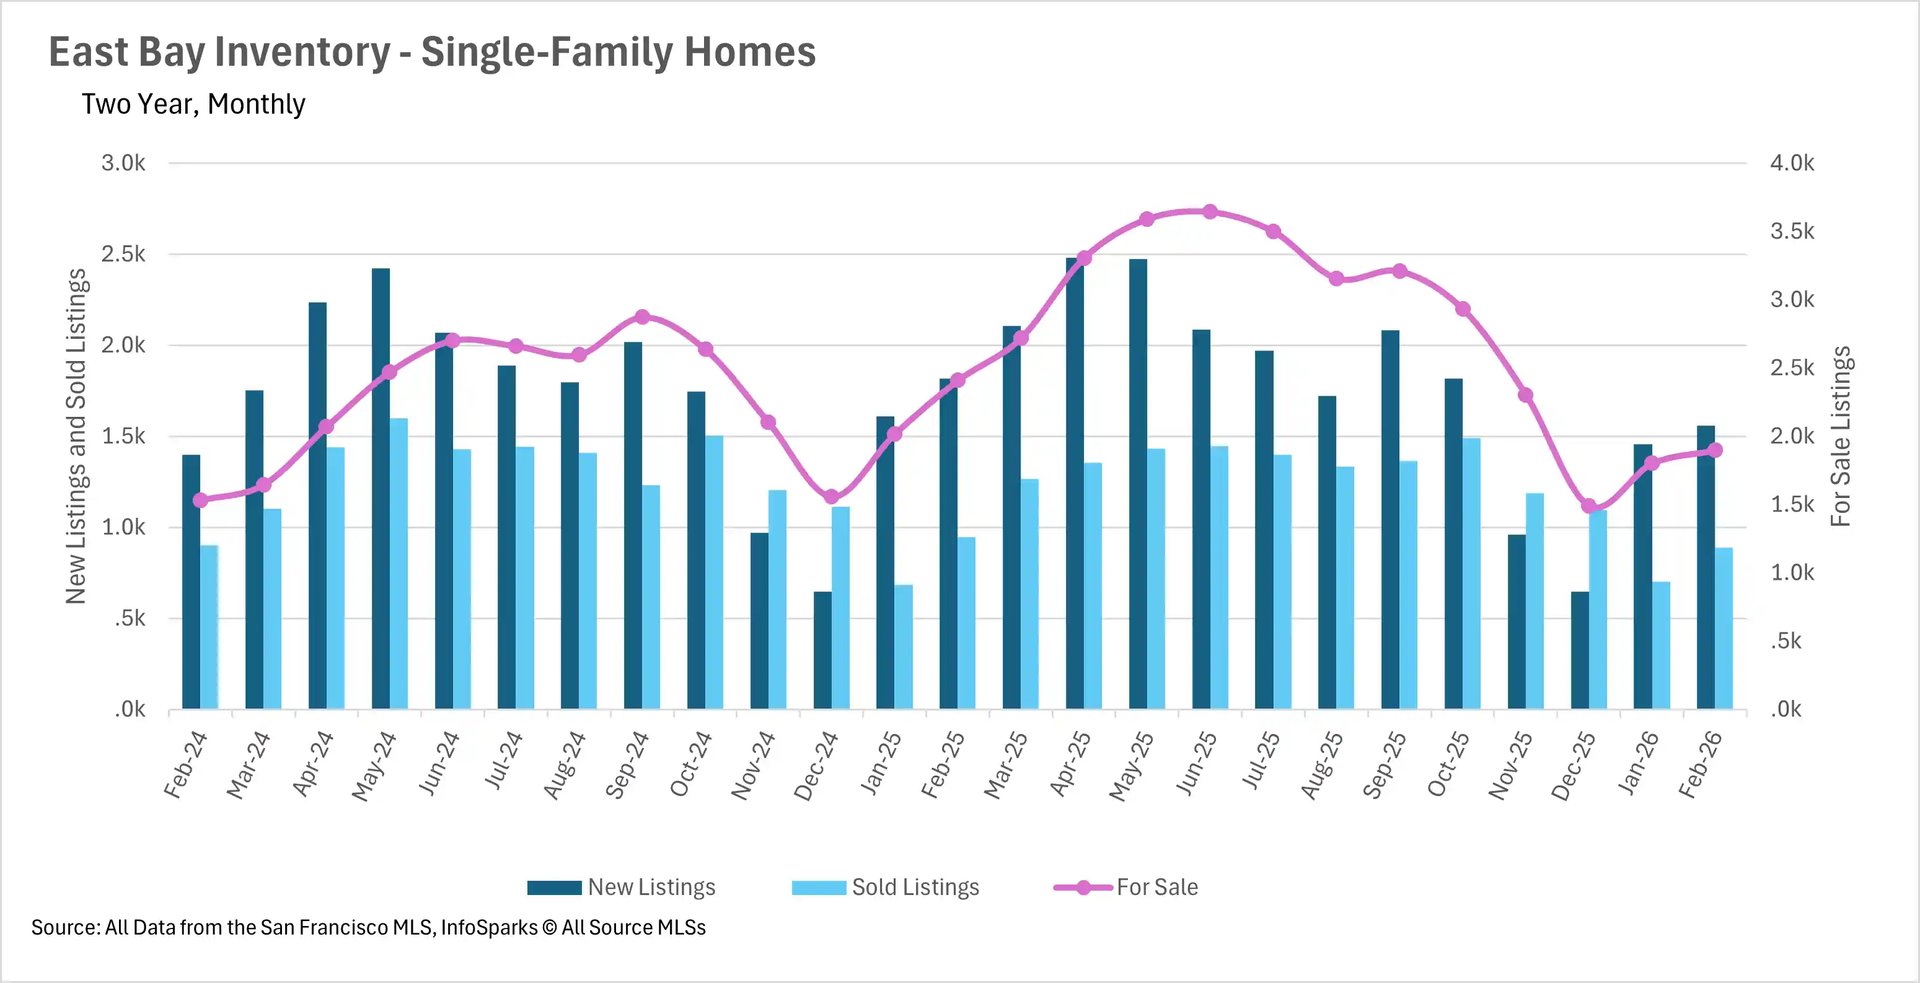
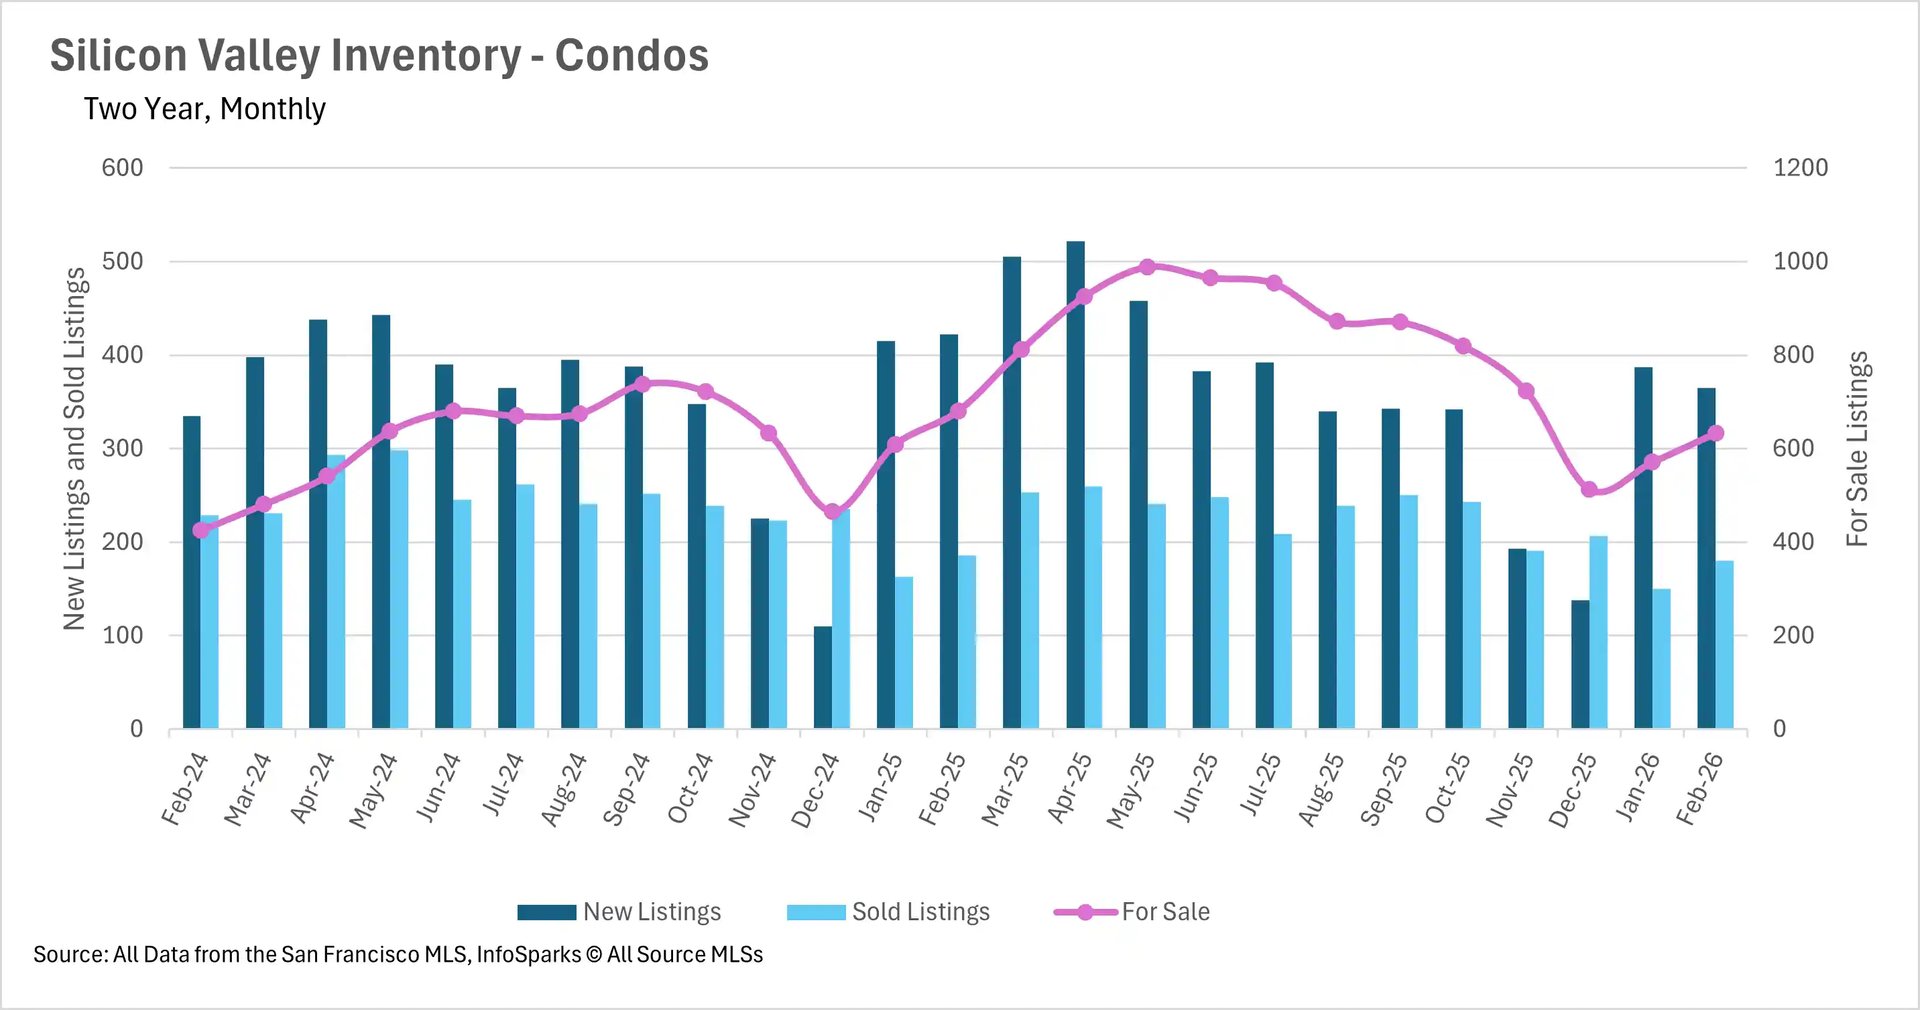
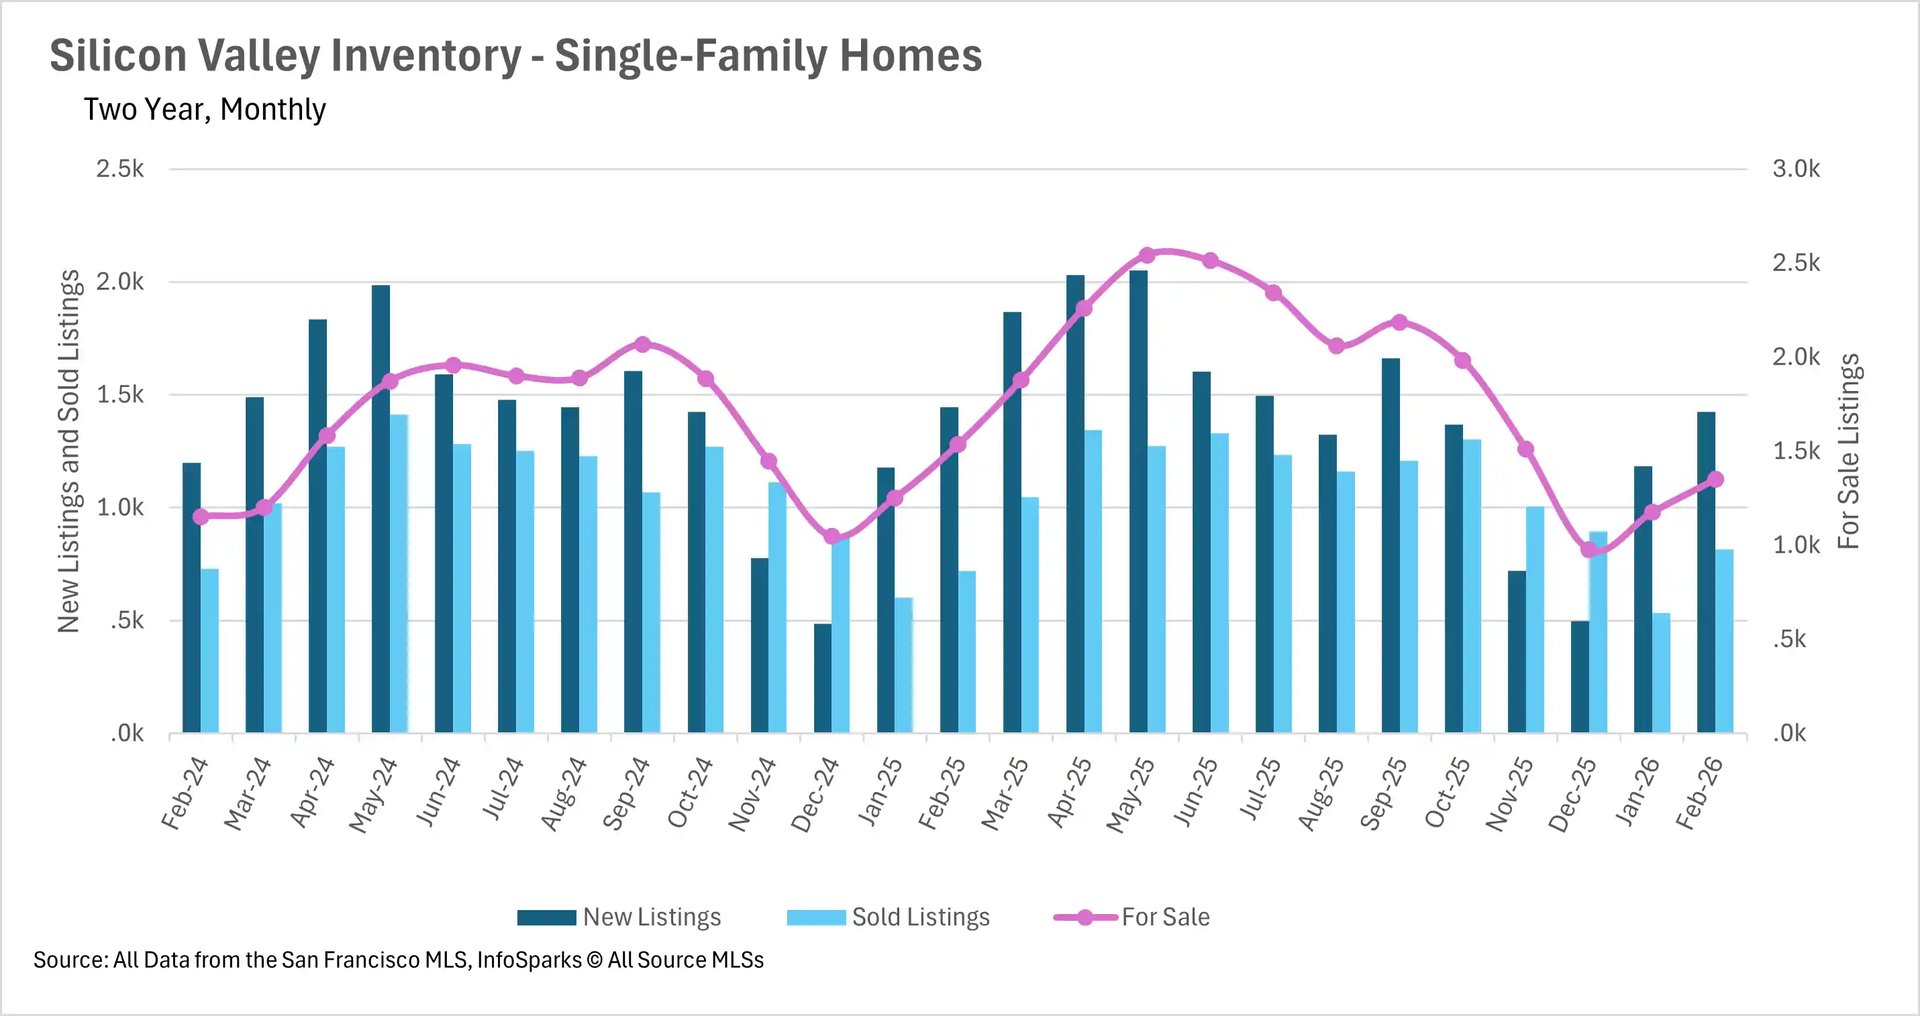
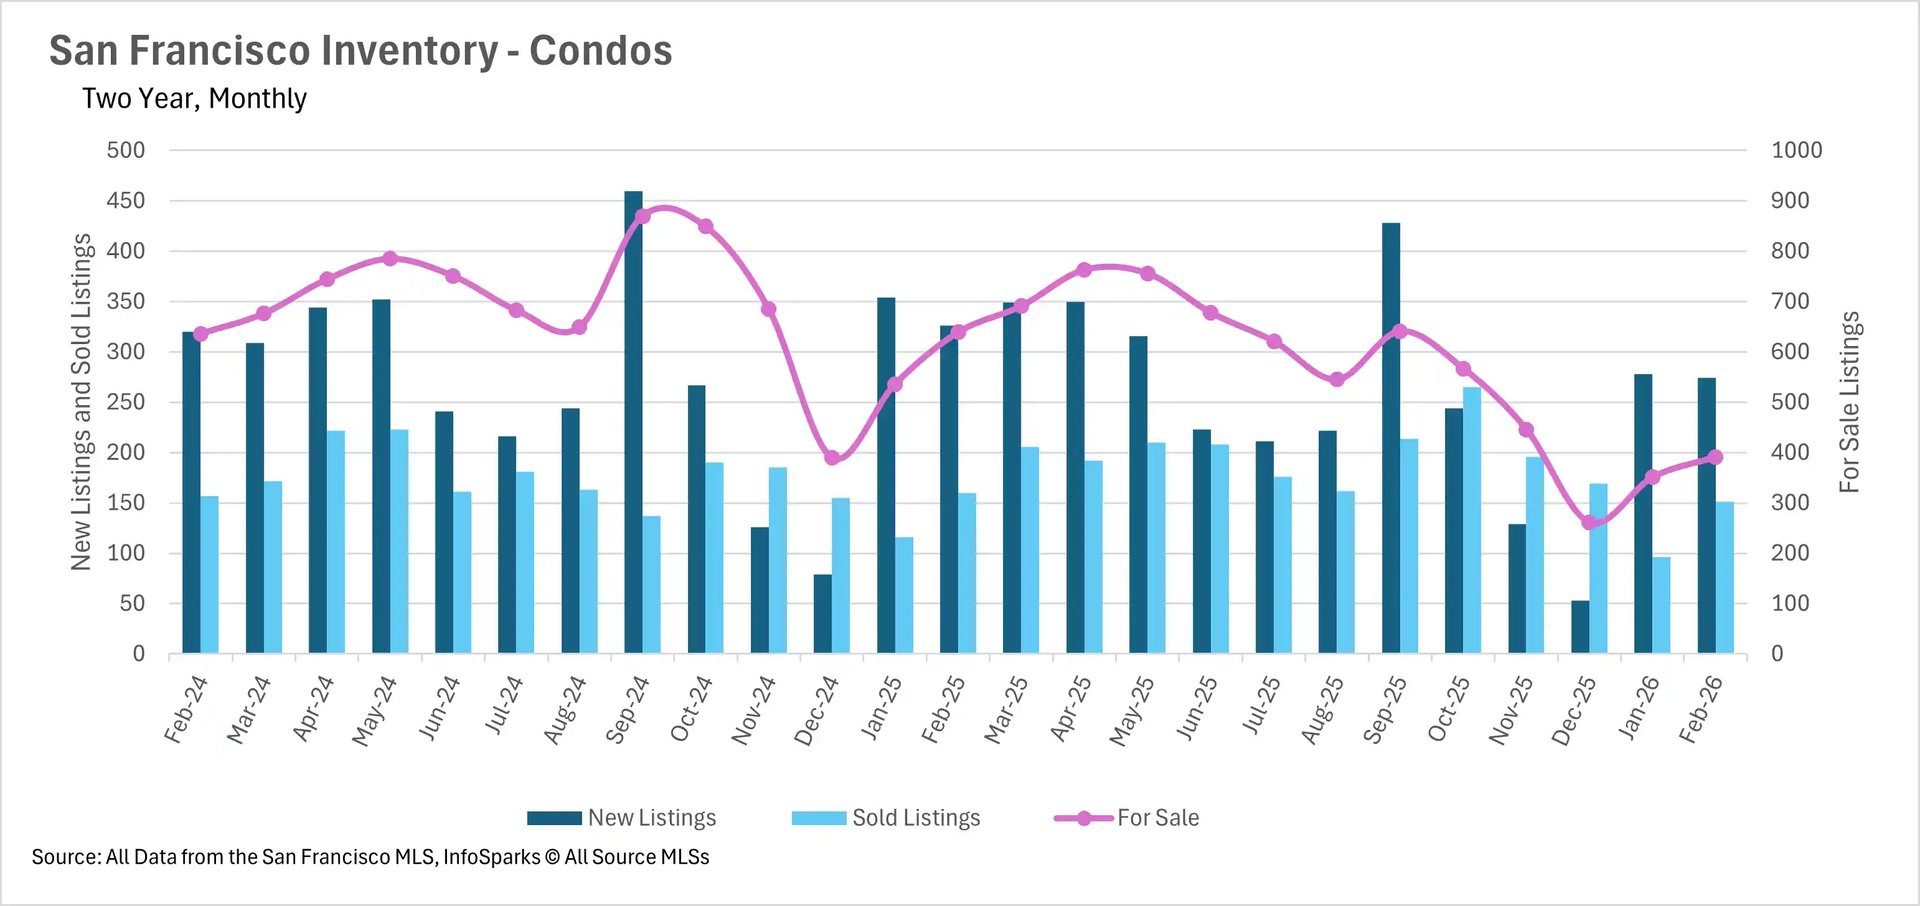
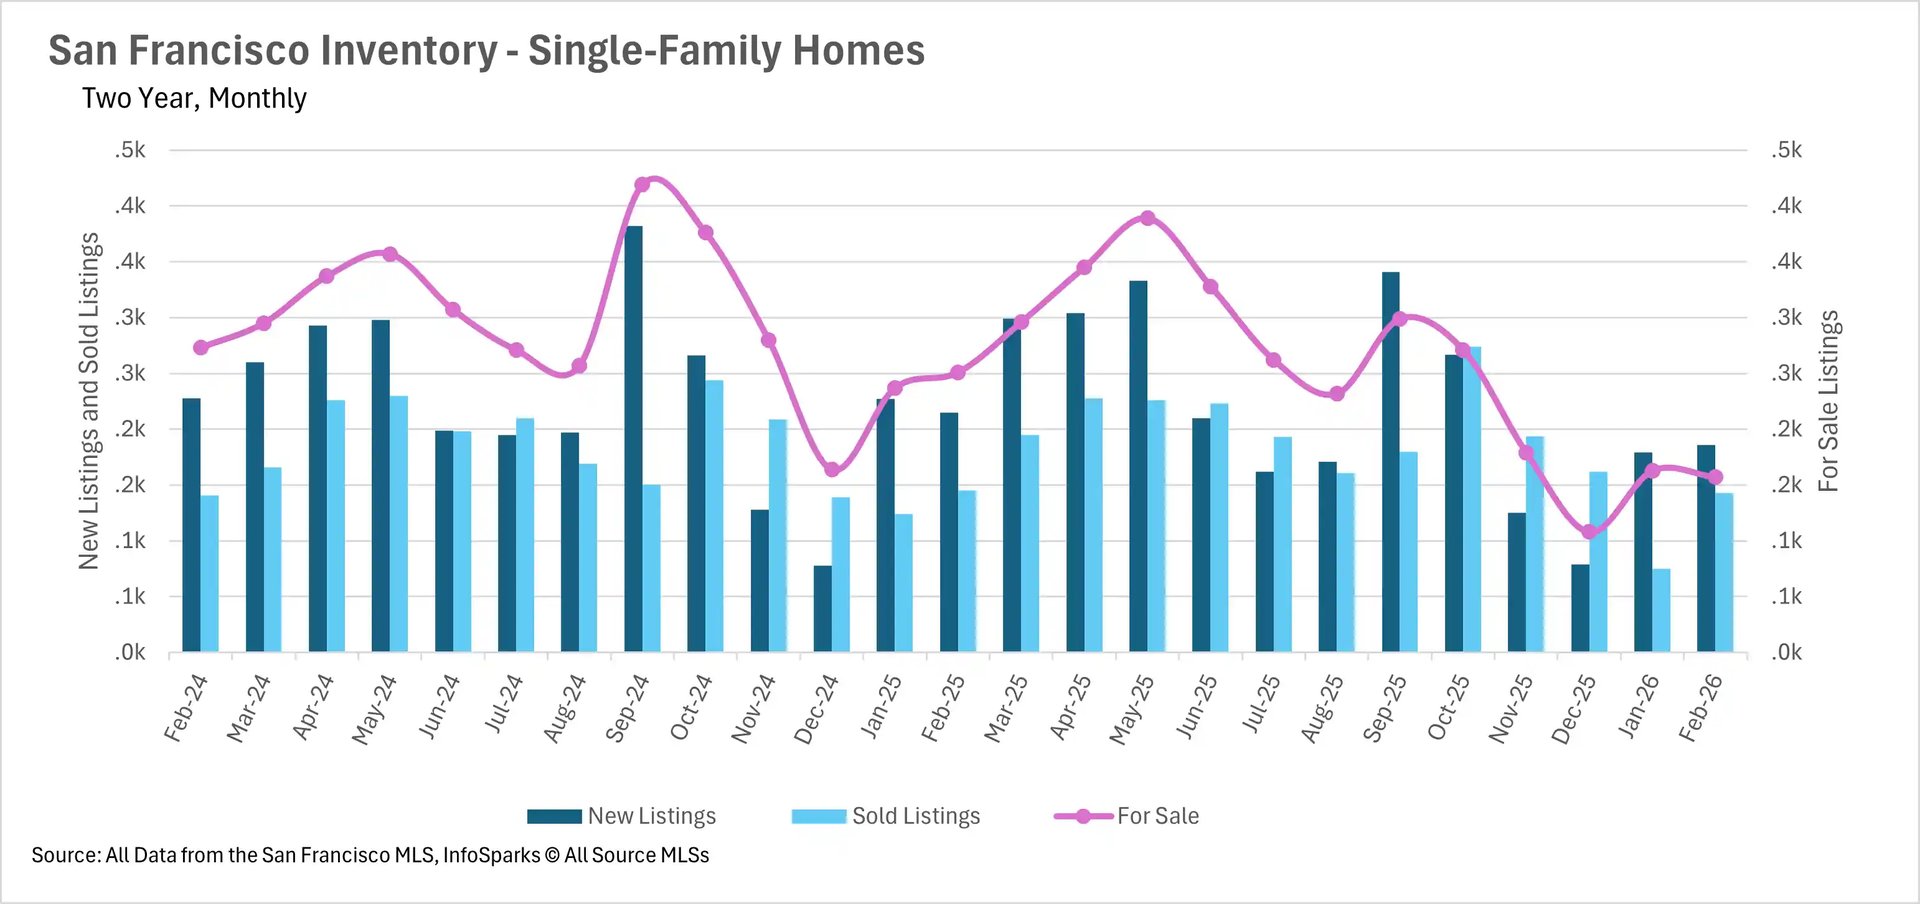
Inventory levels across the Bay Area remain far below where they were a year ago, and the situation has only intensified as we head into the spring selling season.  The North Bay is experiencing the most dramatic squeeze, with single-family home inventory down a staggering 47.88% year-over-year and condo inventory down 38.71%.  San Francisco is not far behind, with single-family inventory down 37.45% and condo inventory down 38.81%, leaving fewer than 550 homes available for sale in the entire city.  

The East Bay has seen single-family inventory decline by 21.24% and condo inventory drop by 14.40%.  Silicon Valley rounds out the picture with single-family inventory down 12.11% and condo inventory down 7.05%.  New listings are beginning to pick up in some areas as the spring market gets underway, but they remain well below last year's pace in most markets.  This persistent shortage of available homes is keeping upward pressure on prices in many areas and creating a challenging environment for buyers who are ready to make a move.

Single-family homes are flying off the shelves, but the condo market is a different story

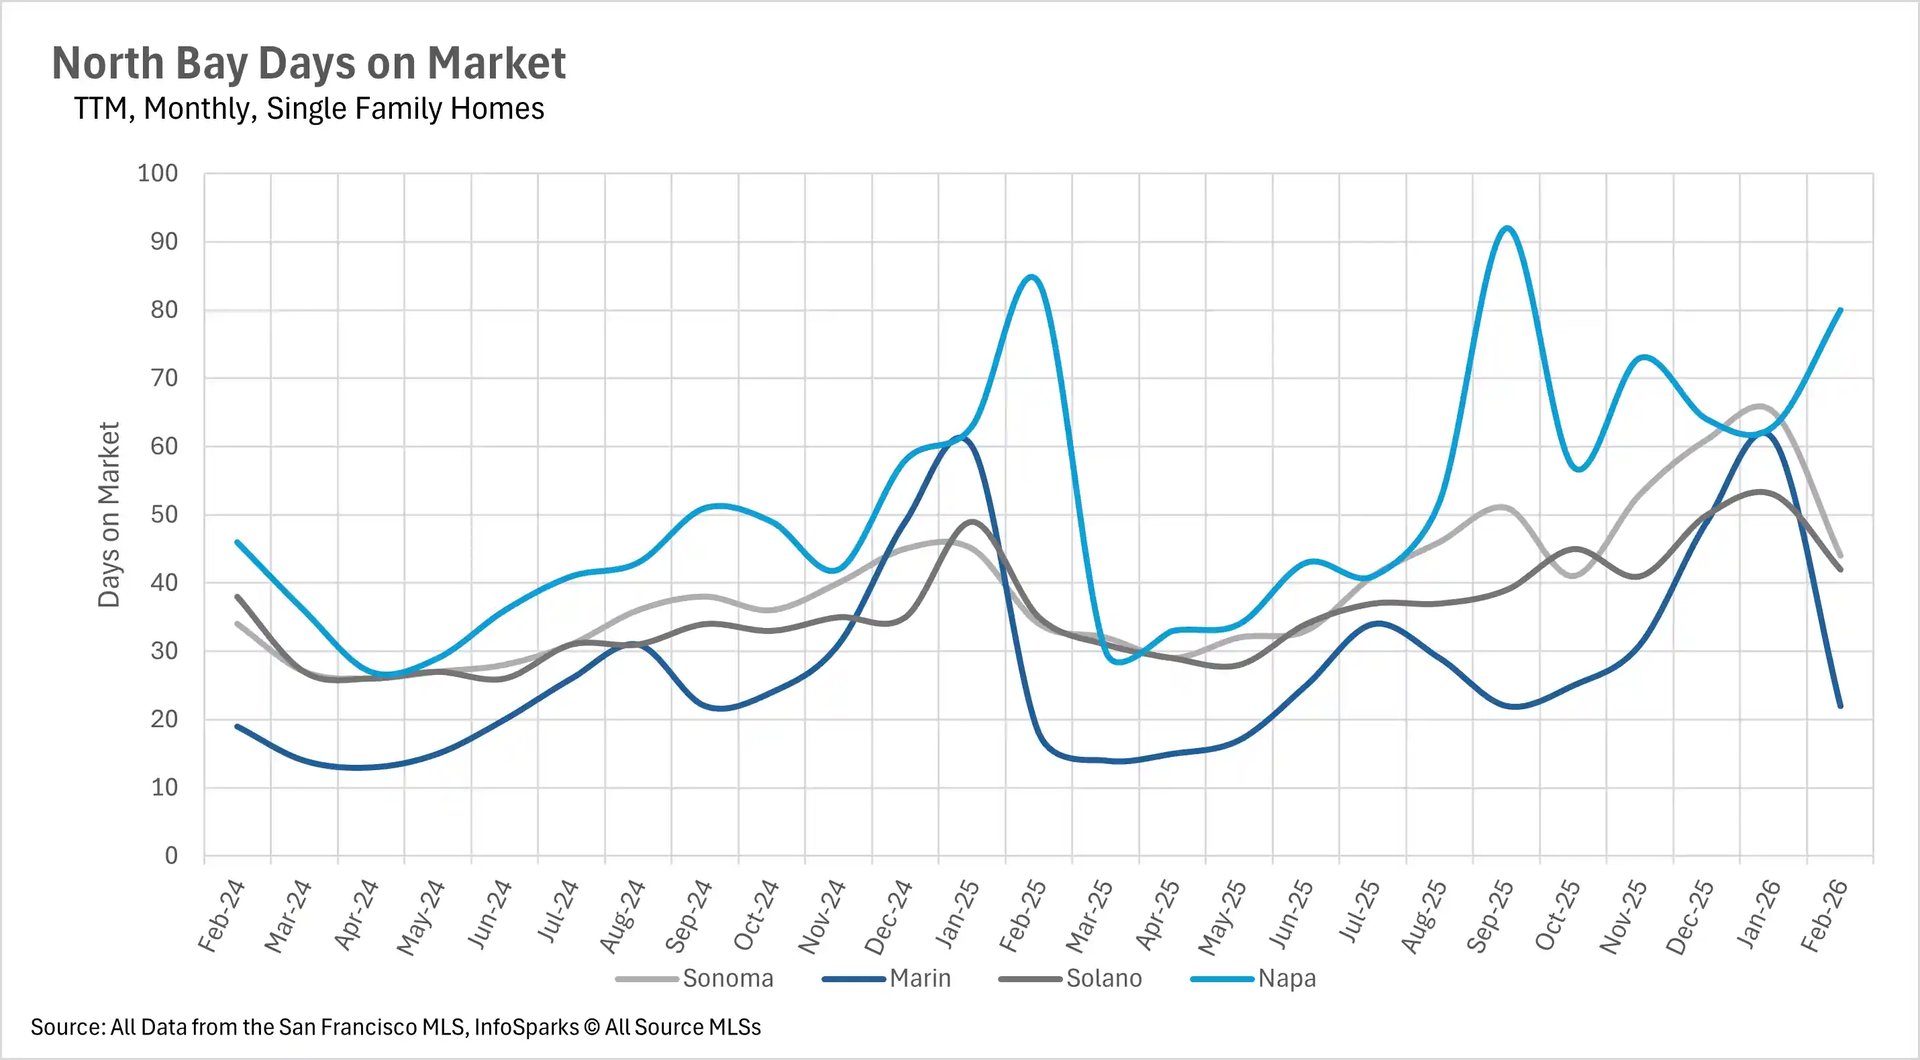
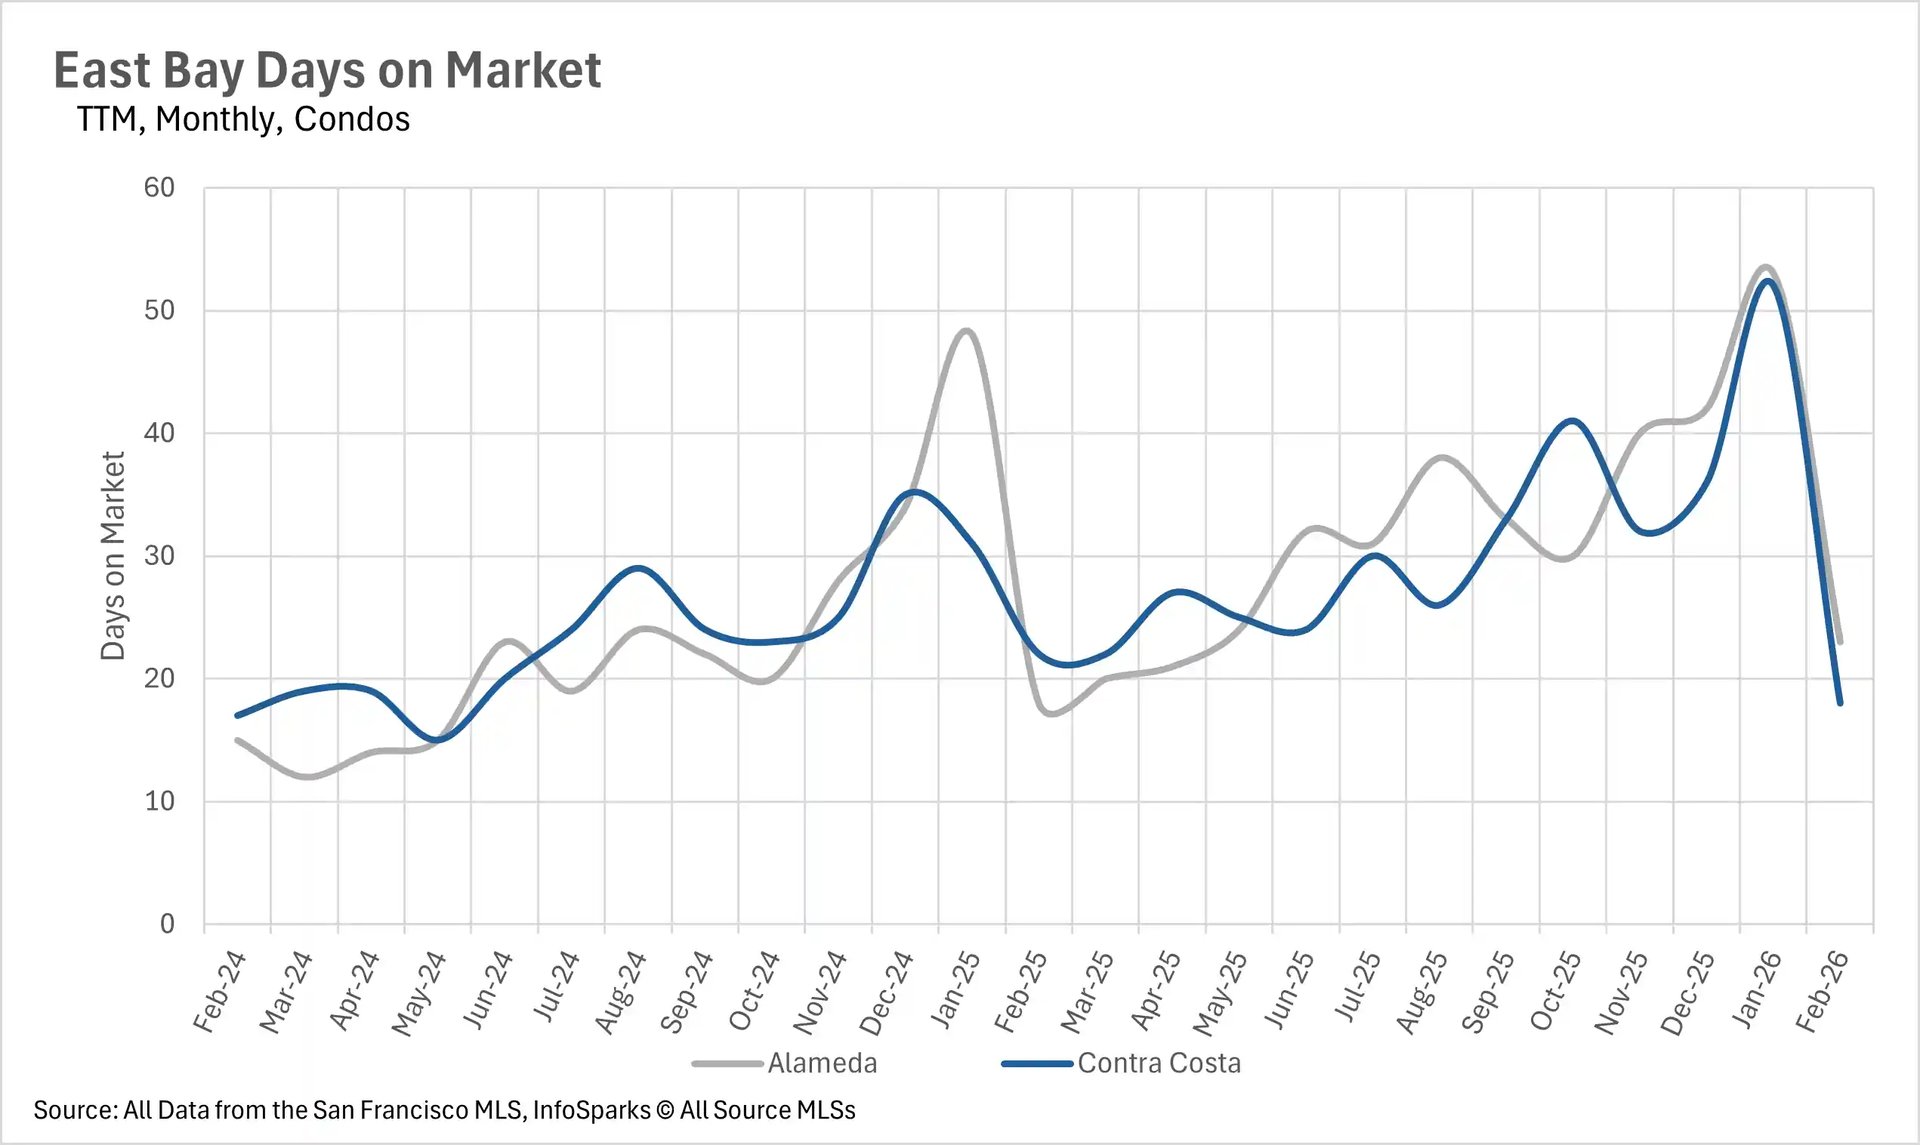
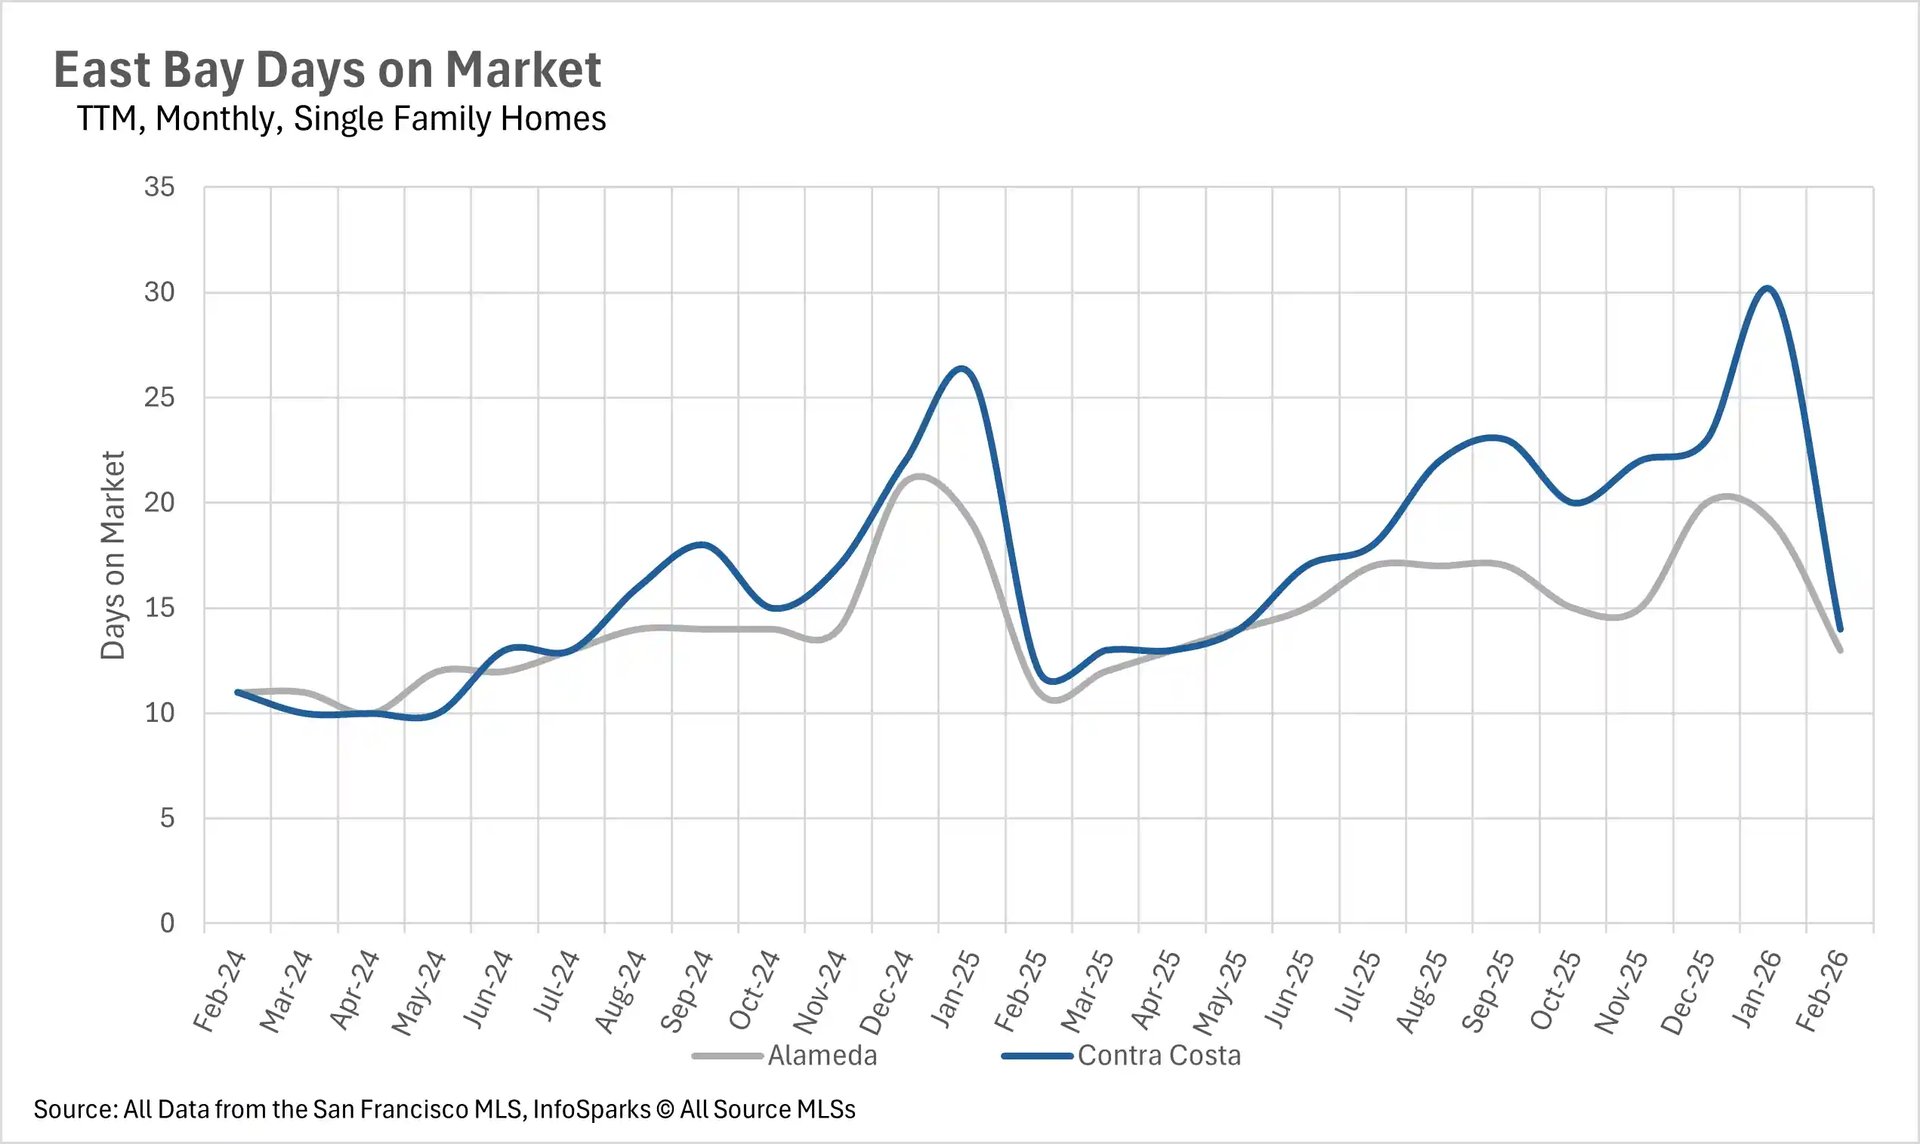
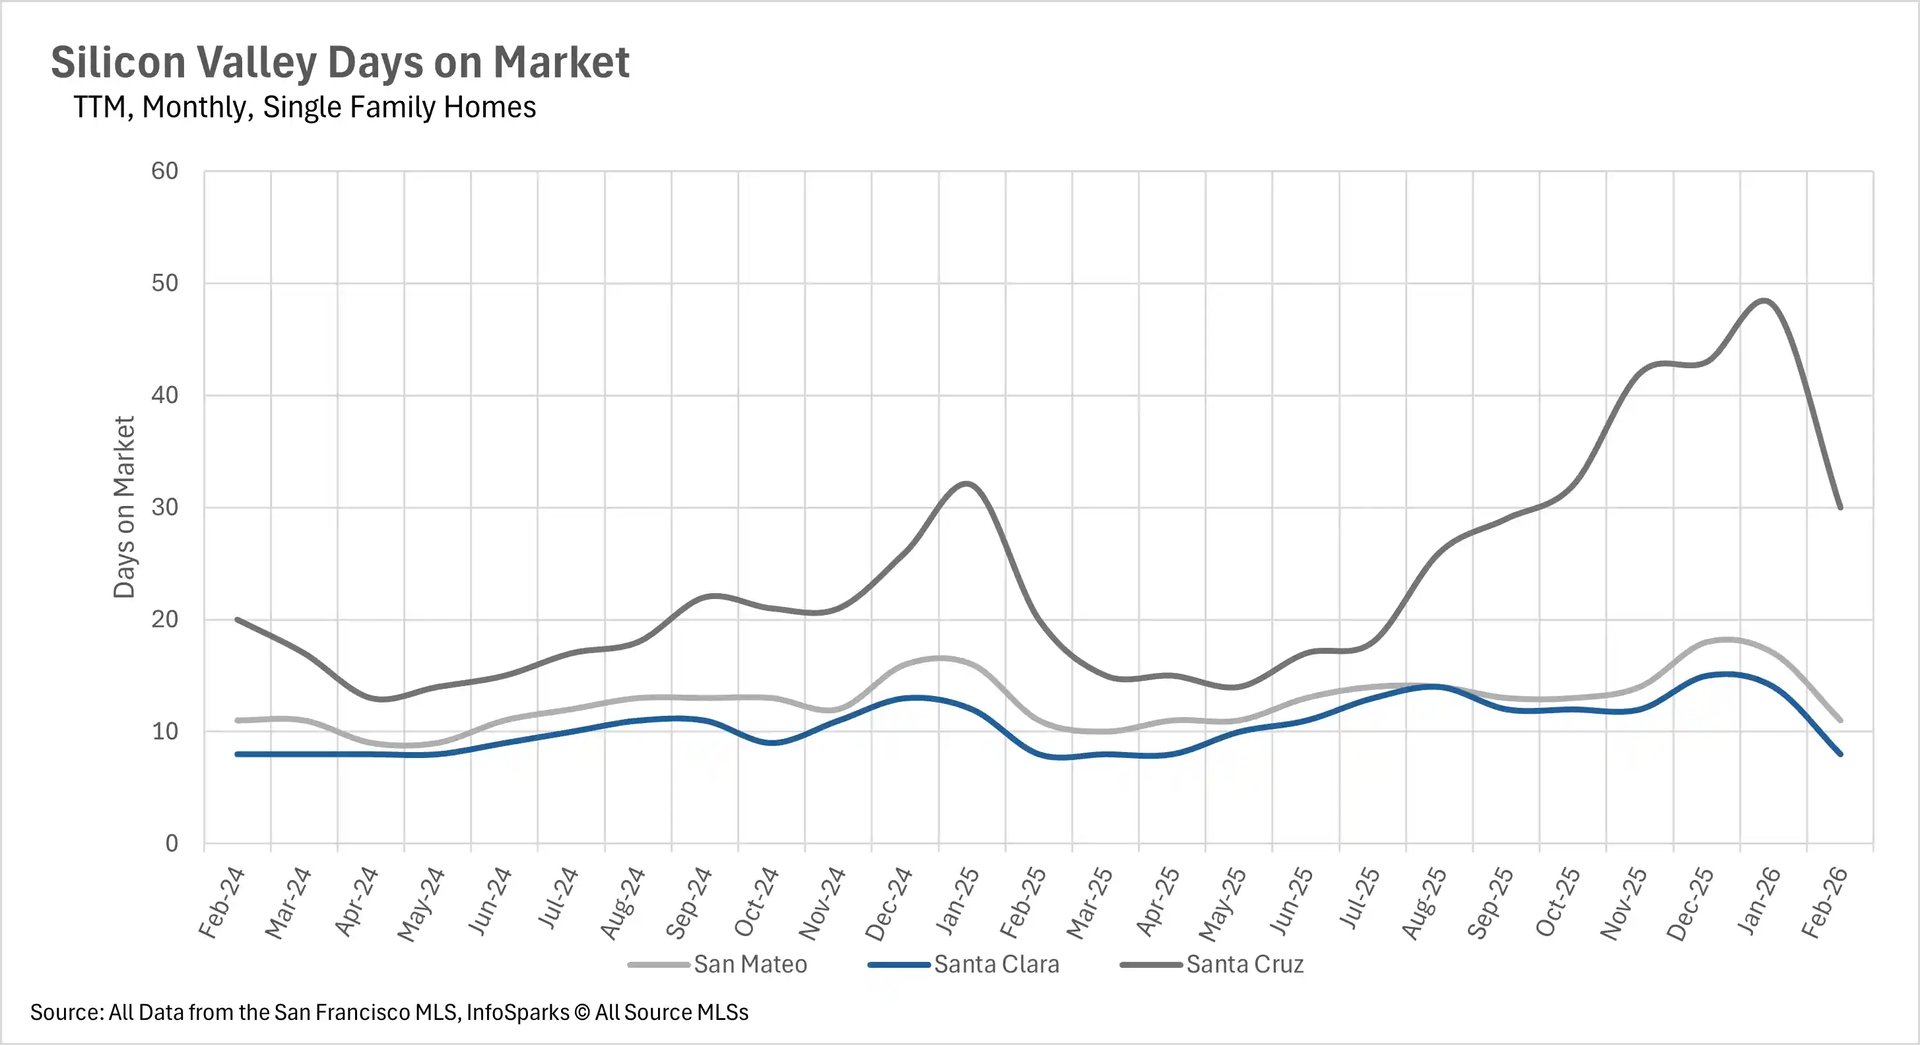
The pace of sales for single-family homes across the Bay Area is nothing short of remarkable.  In Santa Clara County, the average home is selling in just 8 days, while San Mateo County homes are moving in 11 days.  San Francisco single-family homes are selling in just 12 days, and East Bay listings are closing in under two weeks in both Alameda and Contra Costa Counties.  These figures underscore just how competitive the single-family market remains.  The condo market, however, continues to show signs of a much slower pace.  

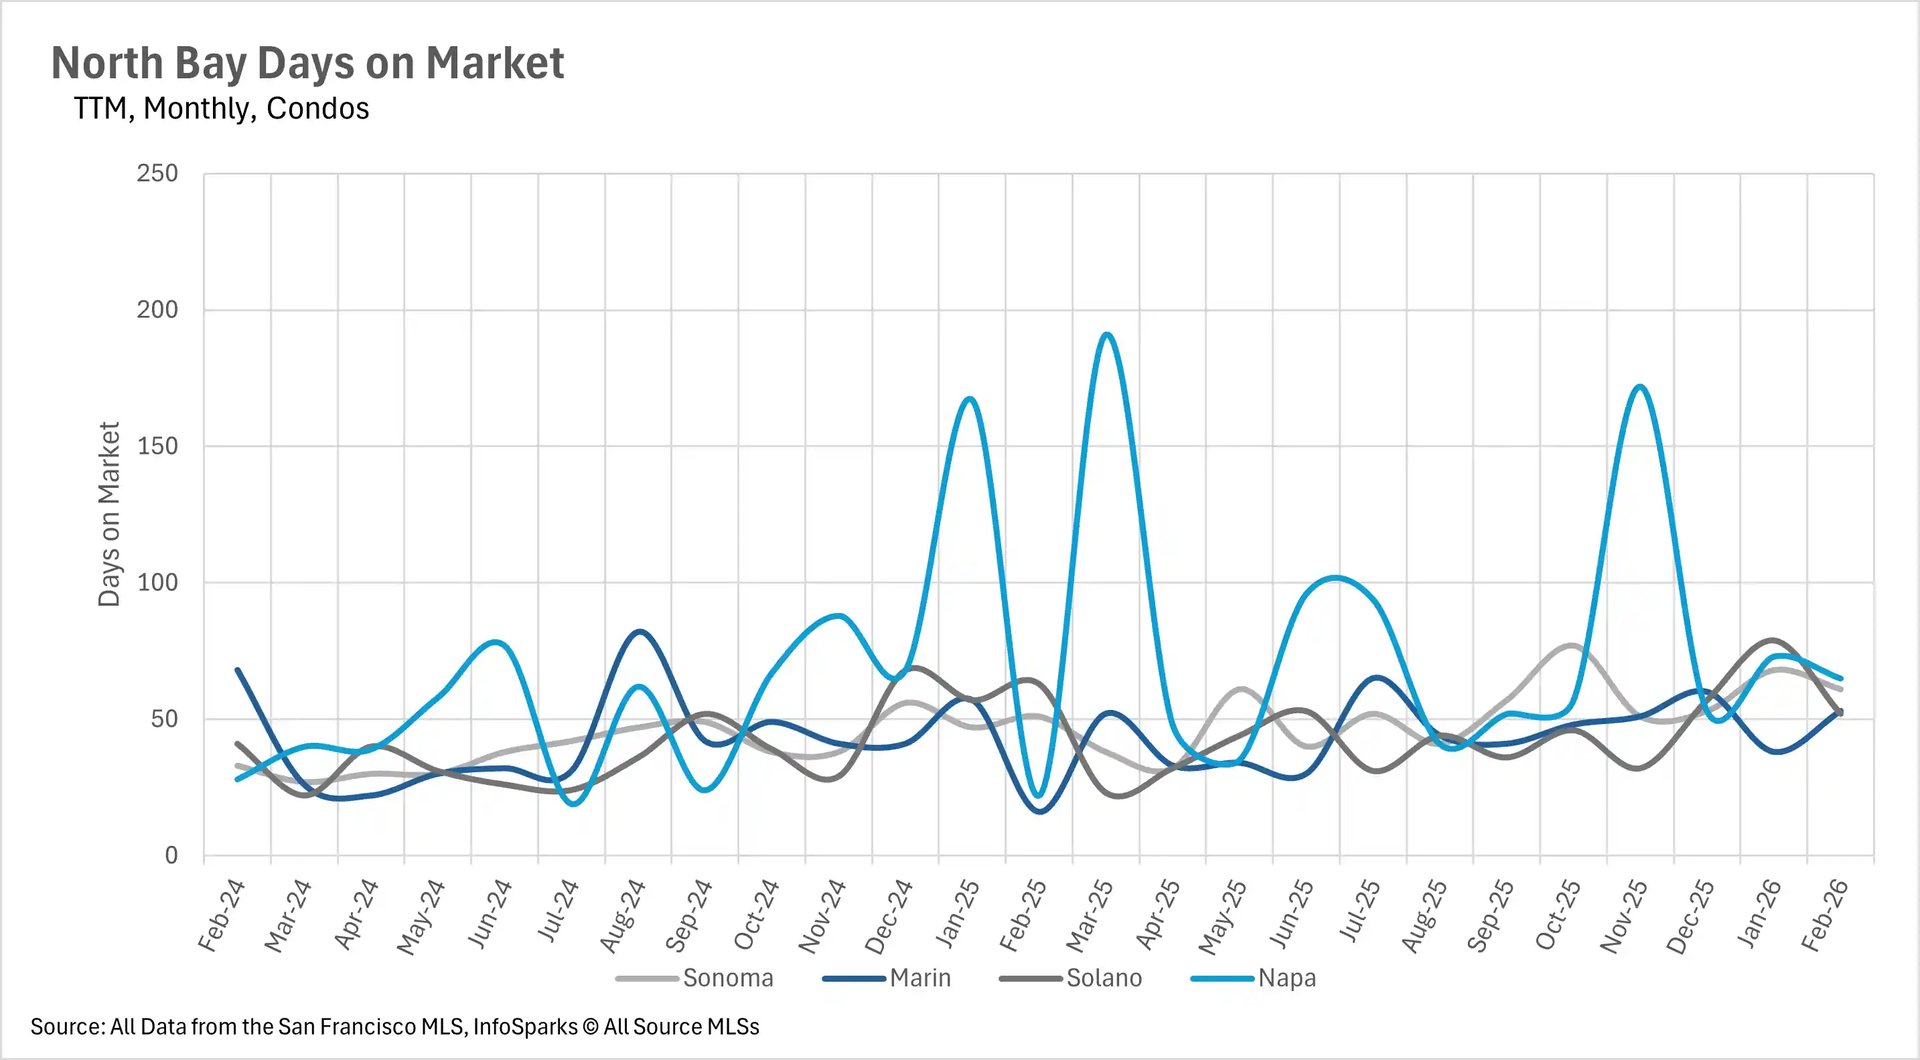
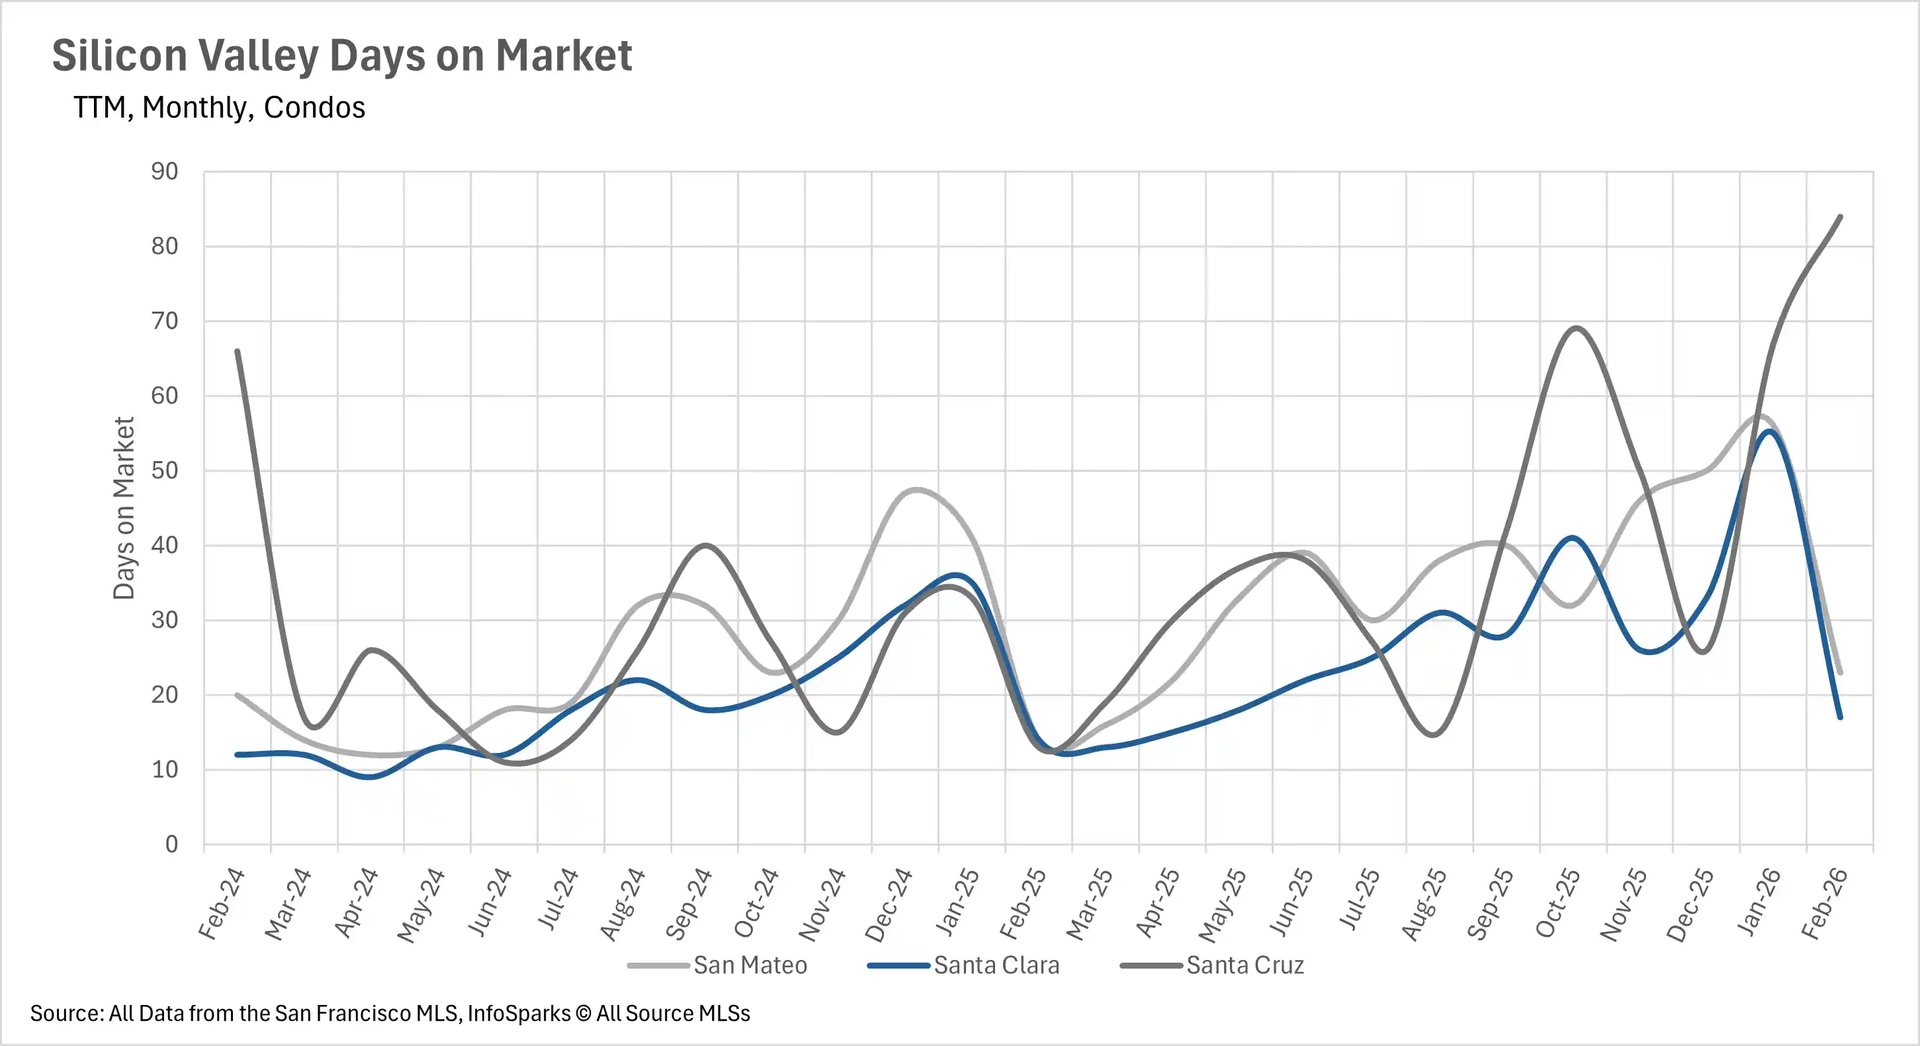
Santa Cruz County condos are taking an average of 84 days to sell, a staggering 546.15% increase compared to February 2025.  San Mateo County condos are spending 64.29% more time on the market year-over-year, and Santa Clara County condos are up 21.43%.  In the North Bay, Marin County condos saw days on market spike by 231.25% on a year-over-year basis.  The divergence between single-family homes and condos remains one of the most defining characteristics of the current Bay Area market.

Sellers hold the cards as the spring market heats up

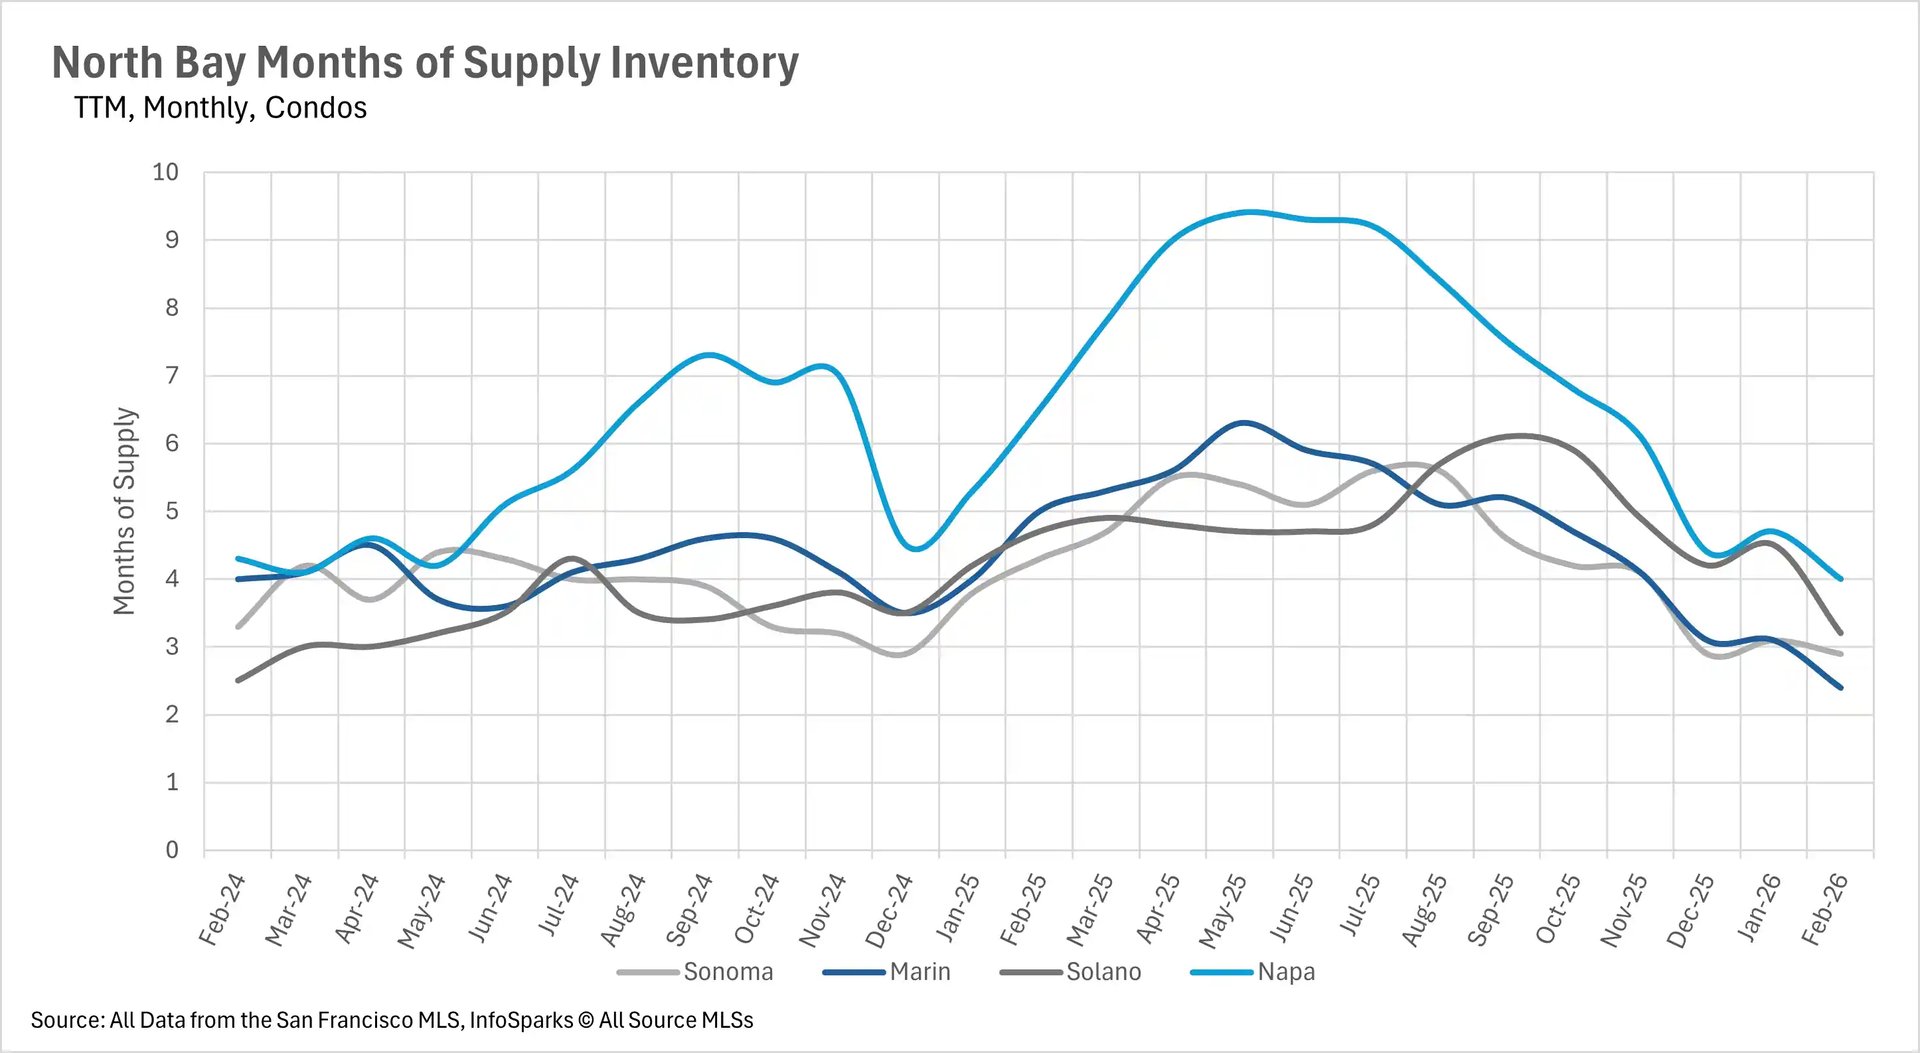
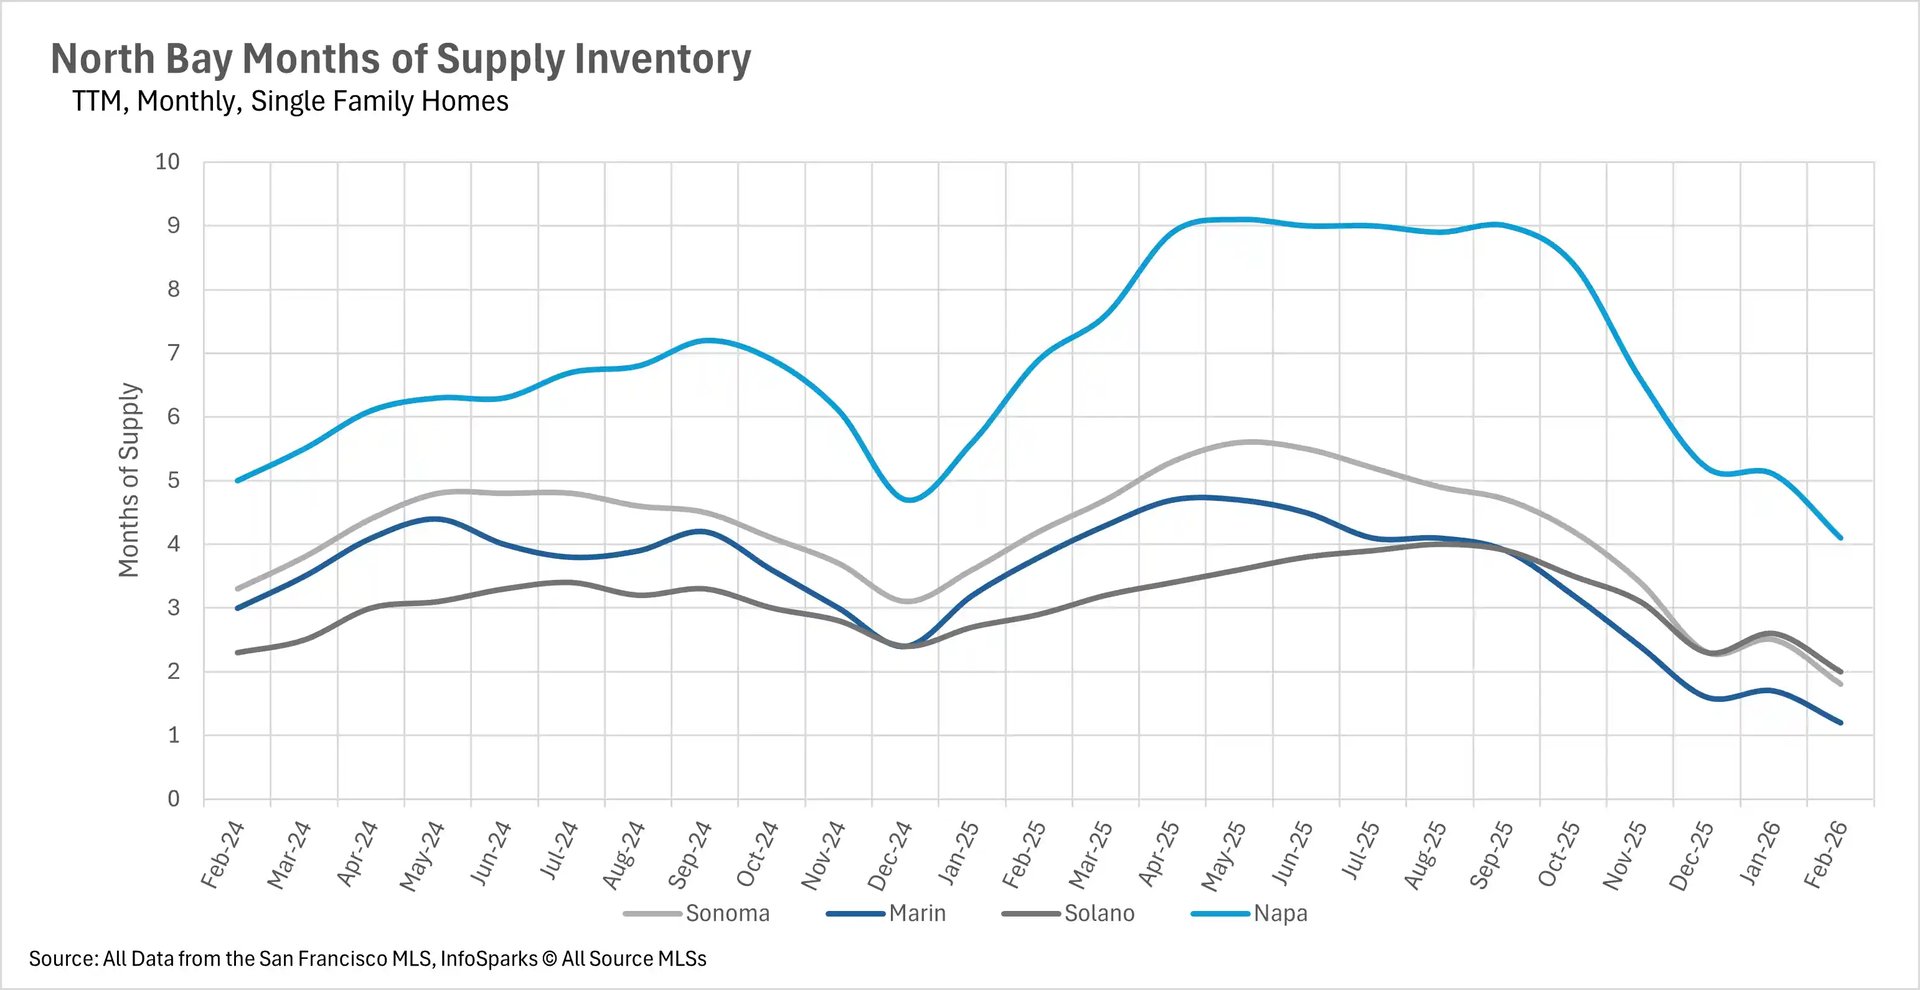
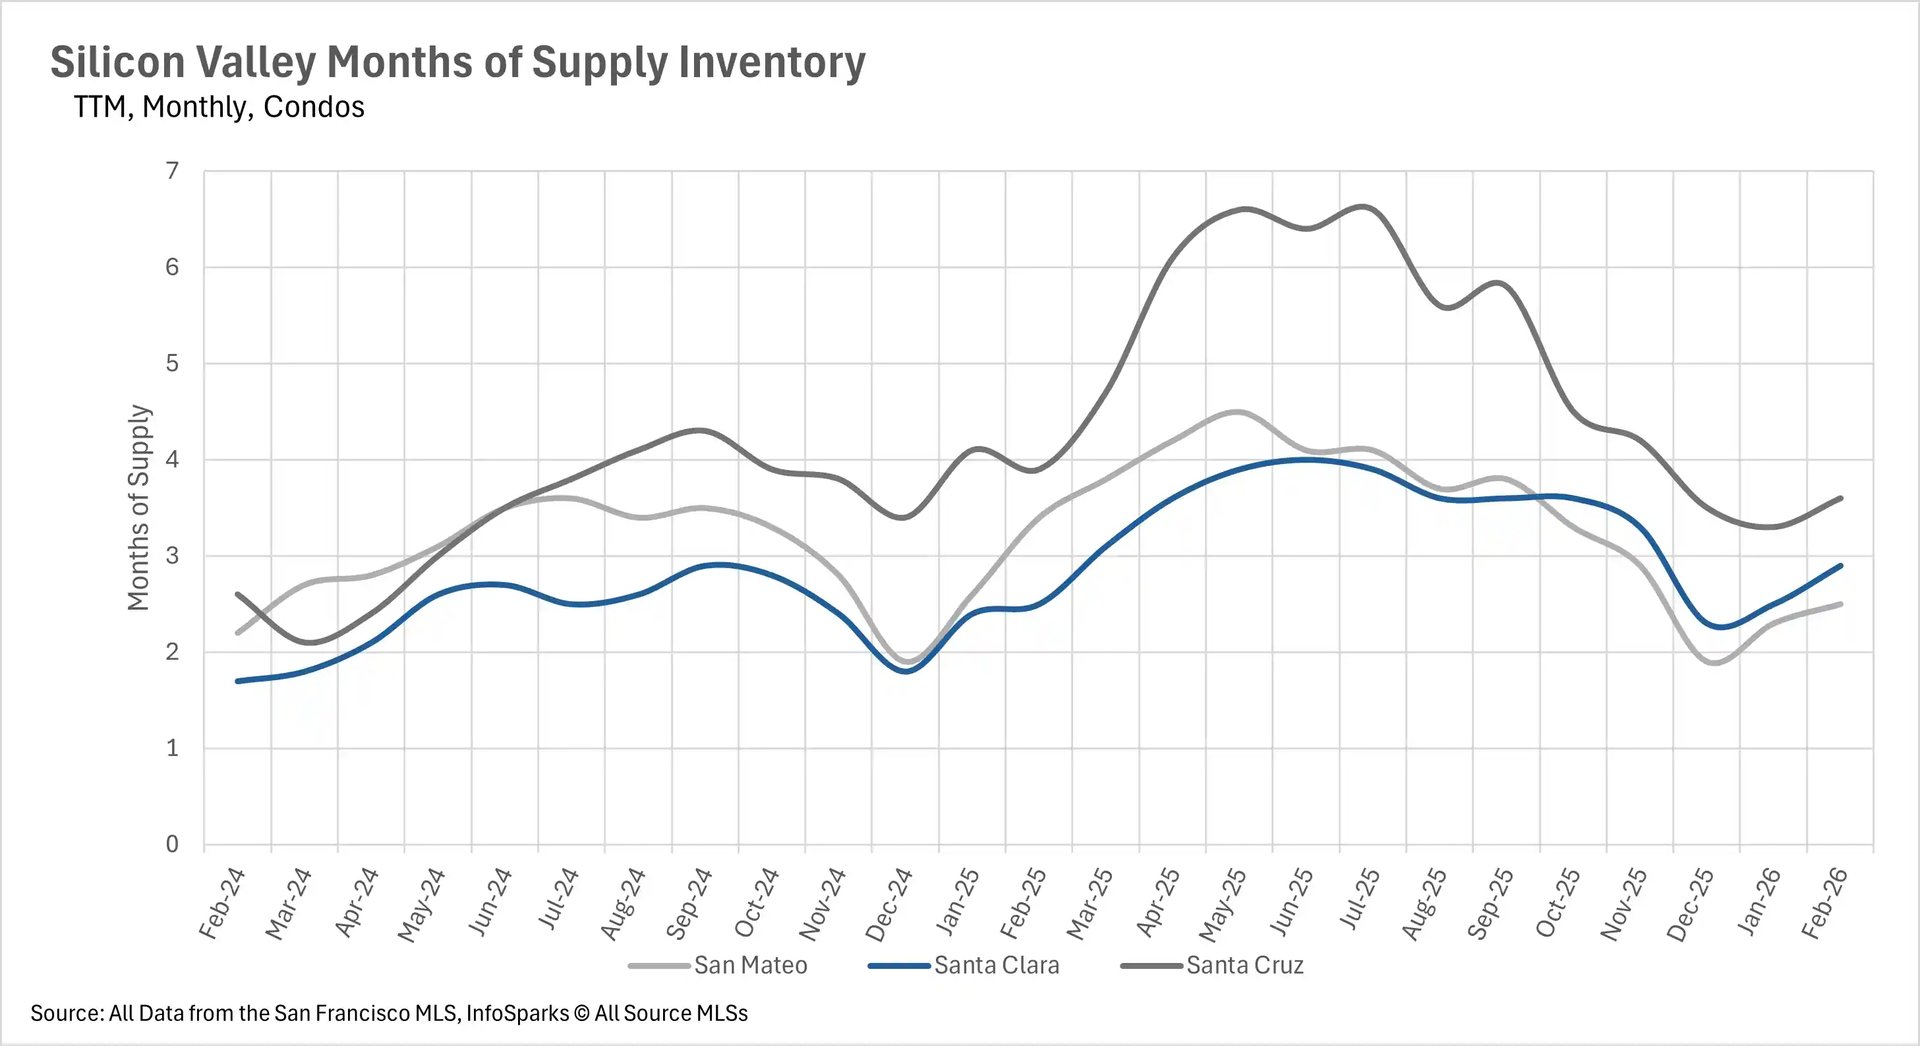
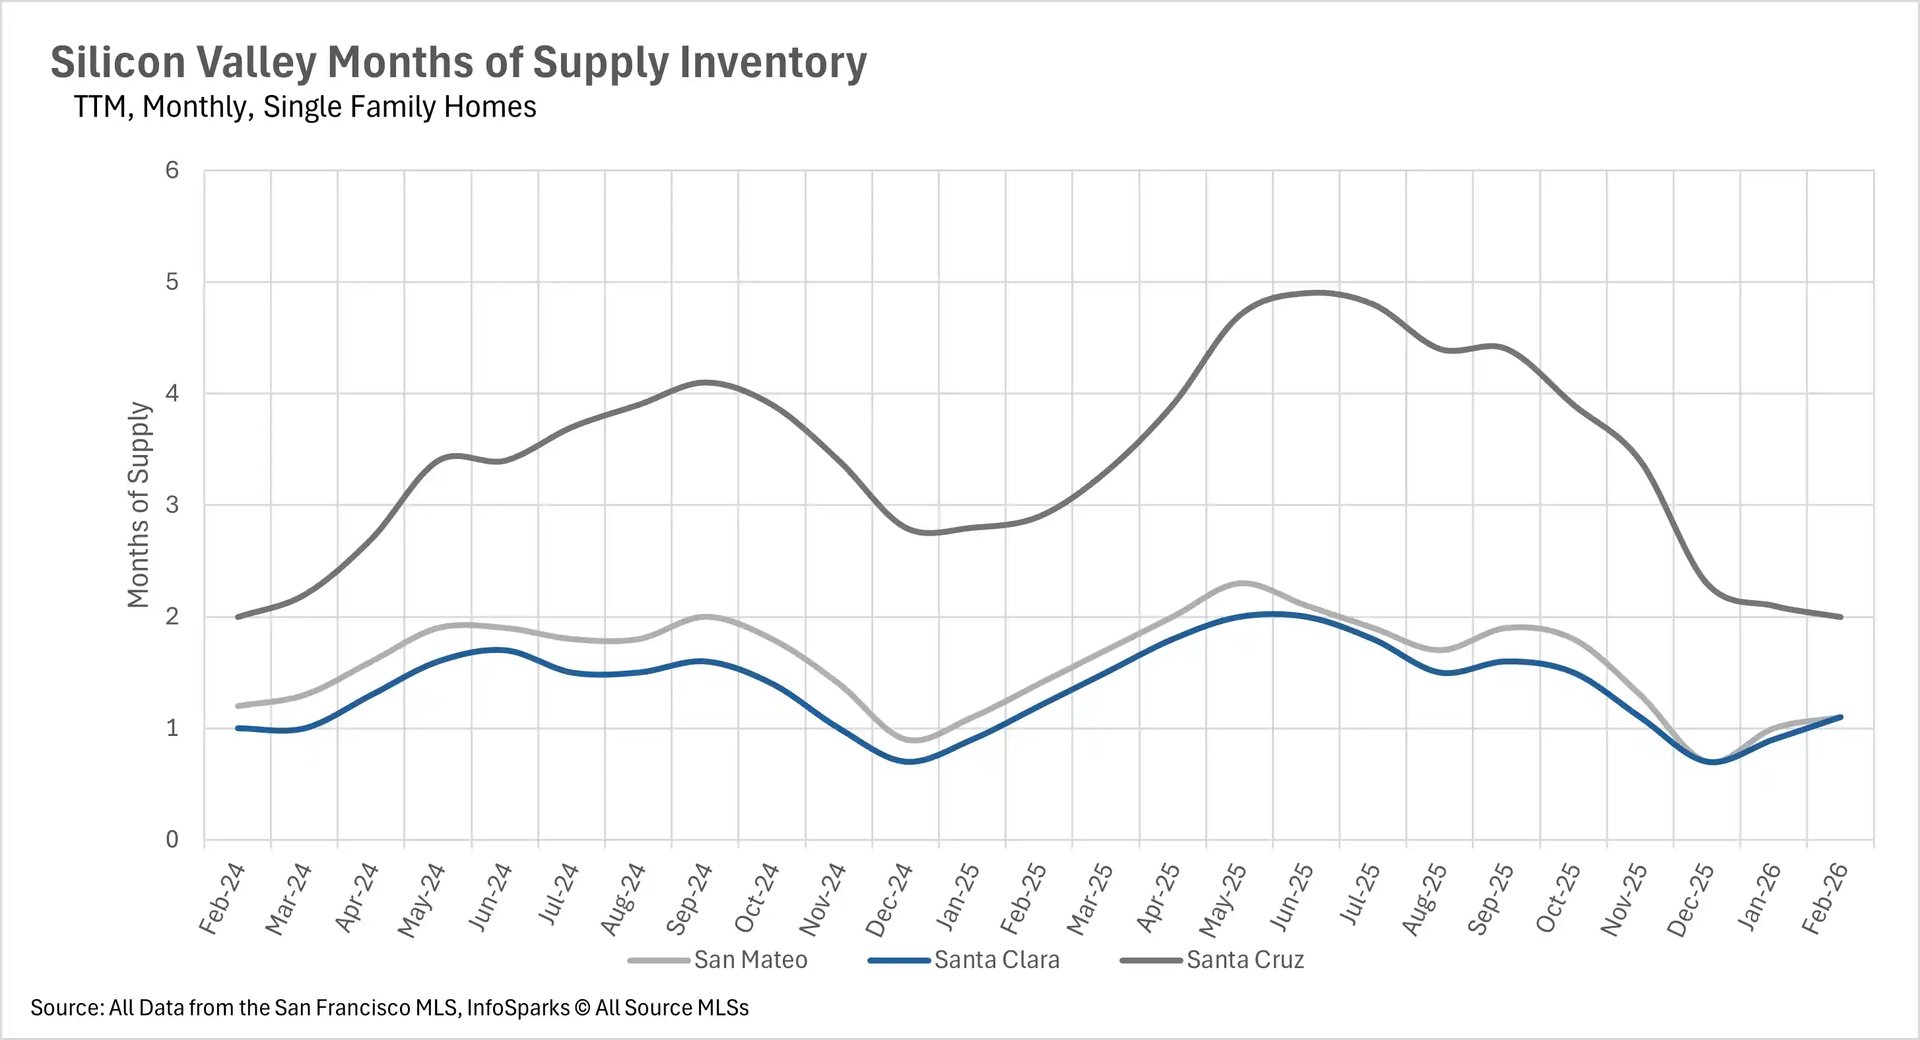
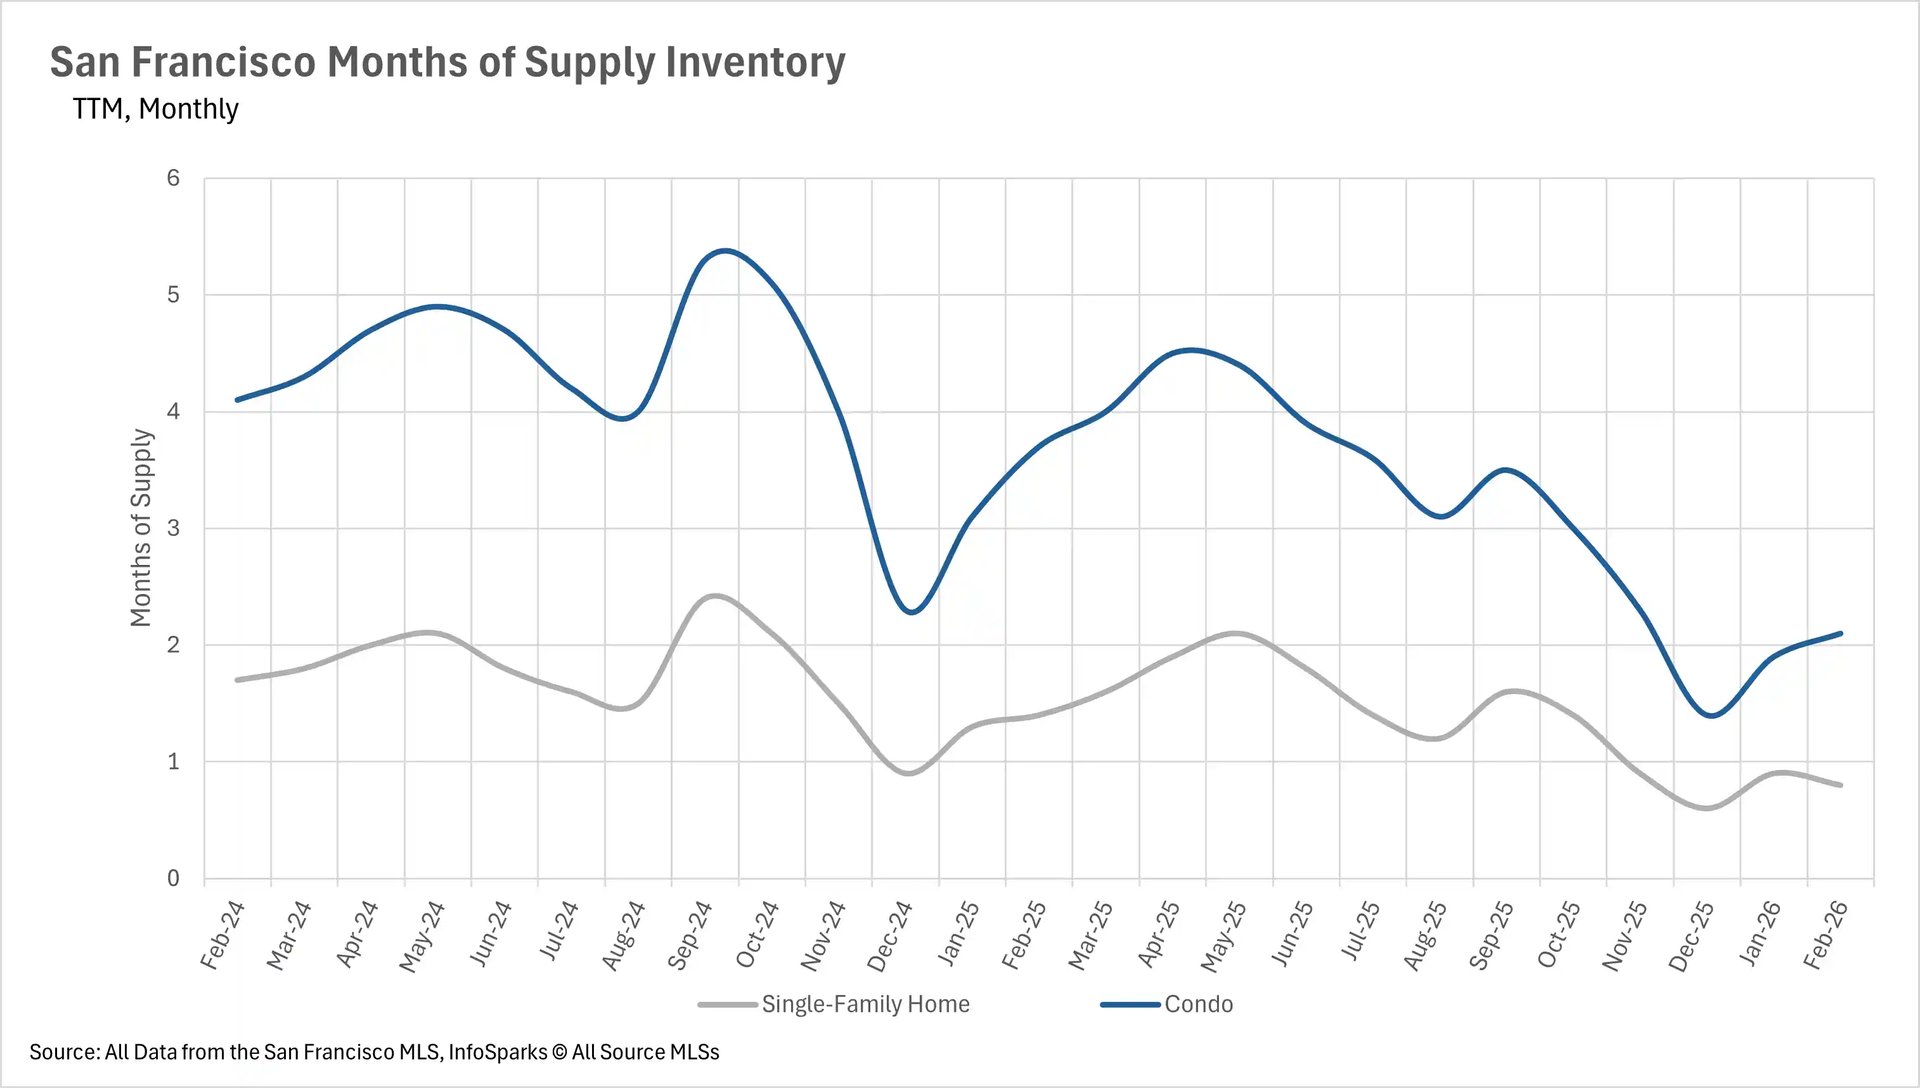
When determining whether a market is a buyers' market or a sellers' market, we look to the Months of Supply Inventory (MSI) metric.  The state of California has historically averaged around three months of MSI, so any area with at or around three months of MSI is considered a balanced market. Any market that has lower than three months of MSI is considered a seller's market, whereas markets with more than three months of MSI are considered a buyers' market.

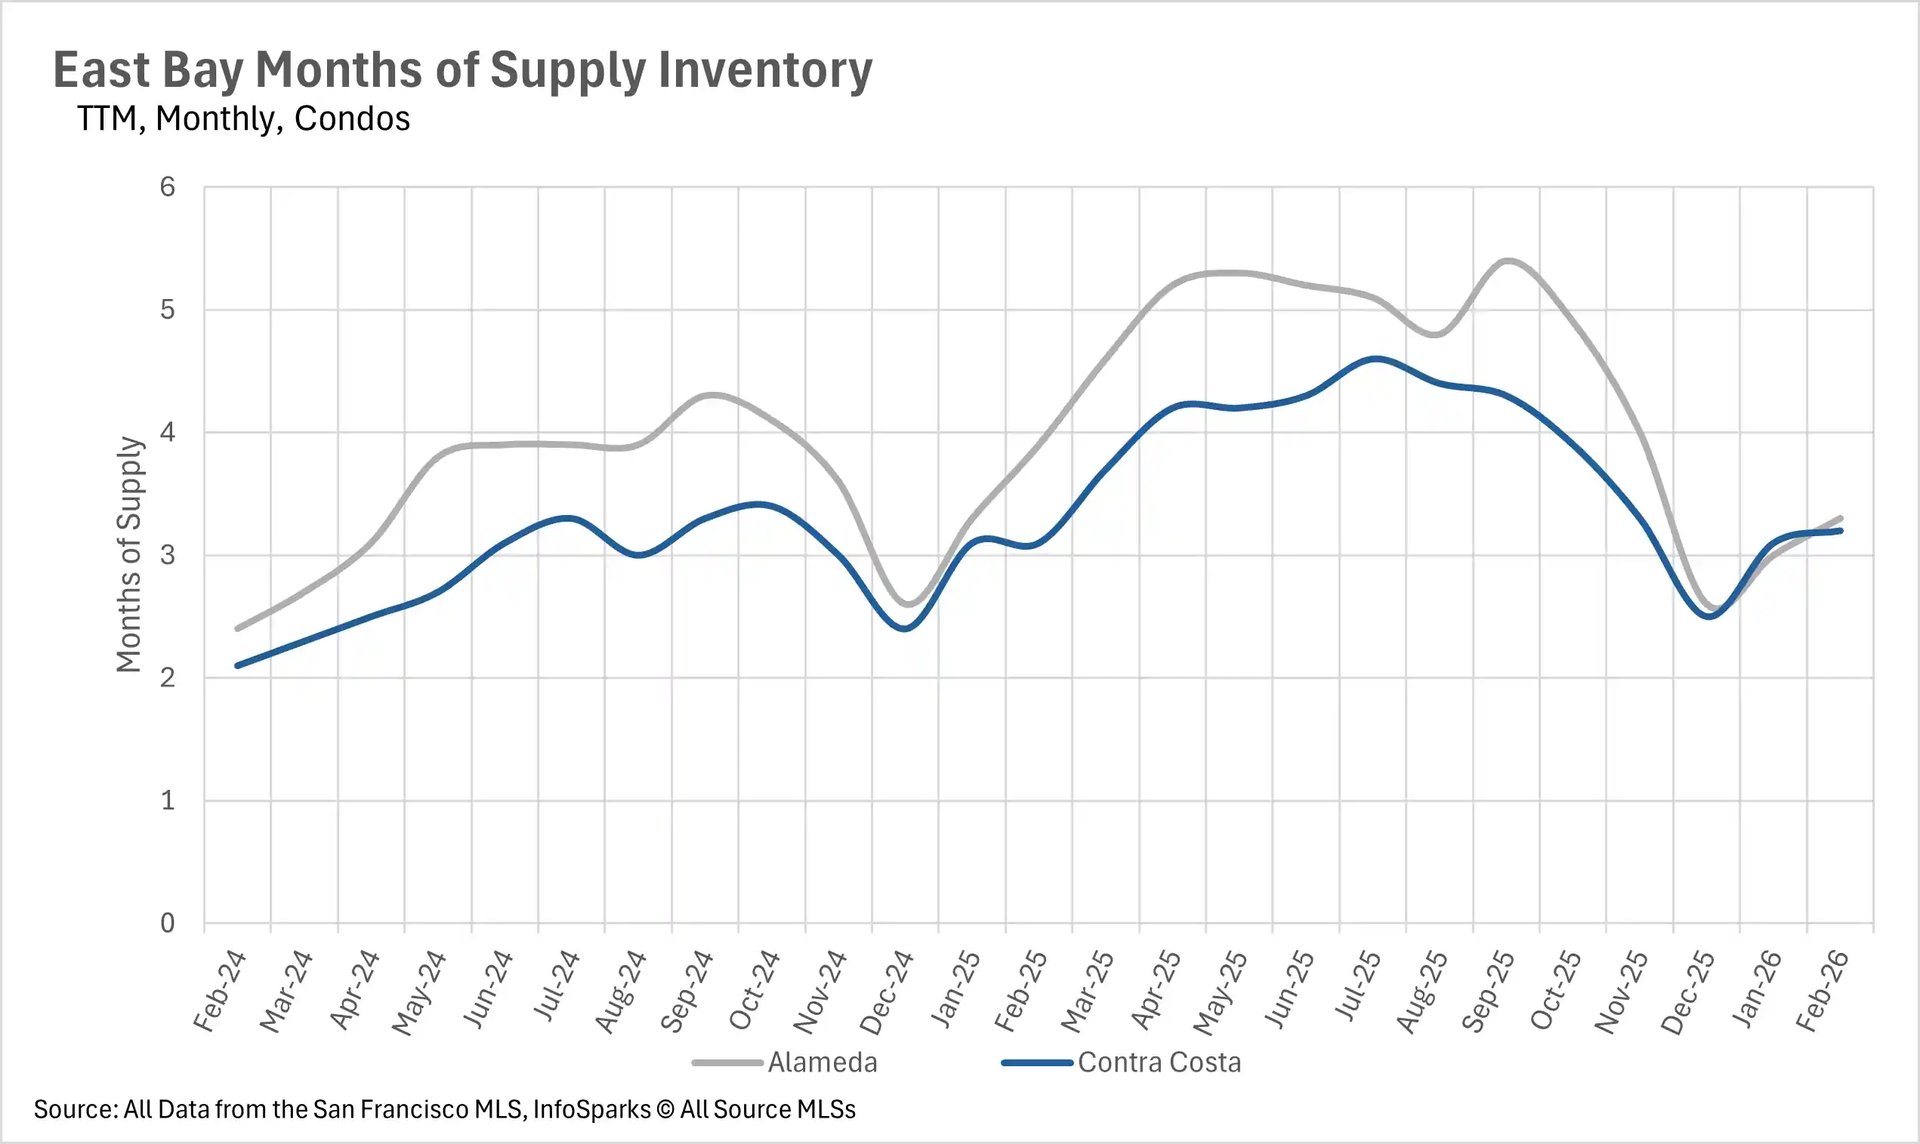
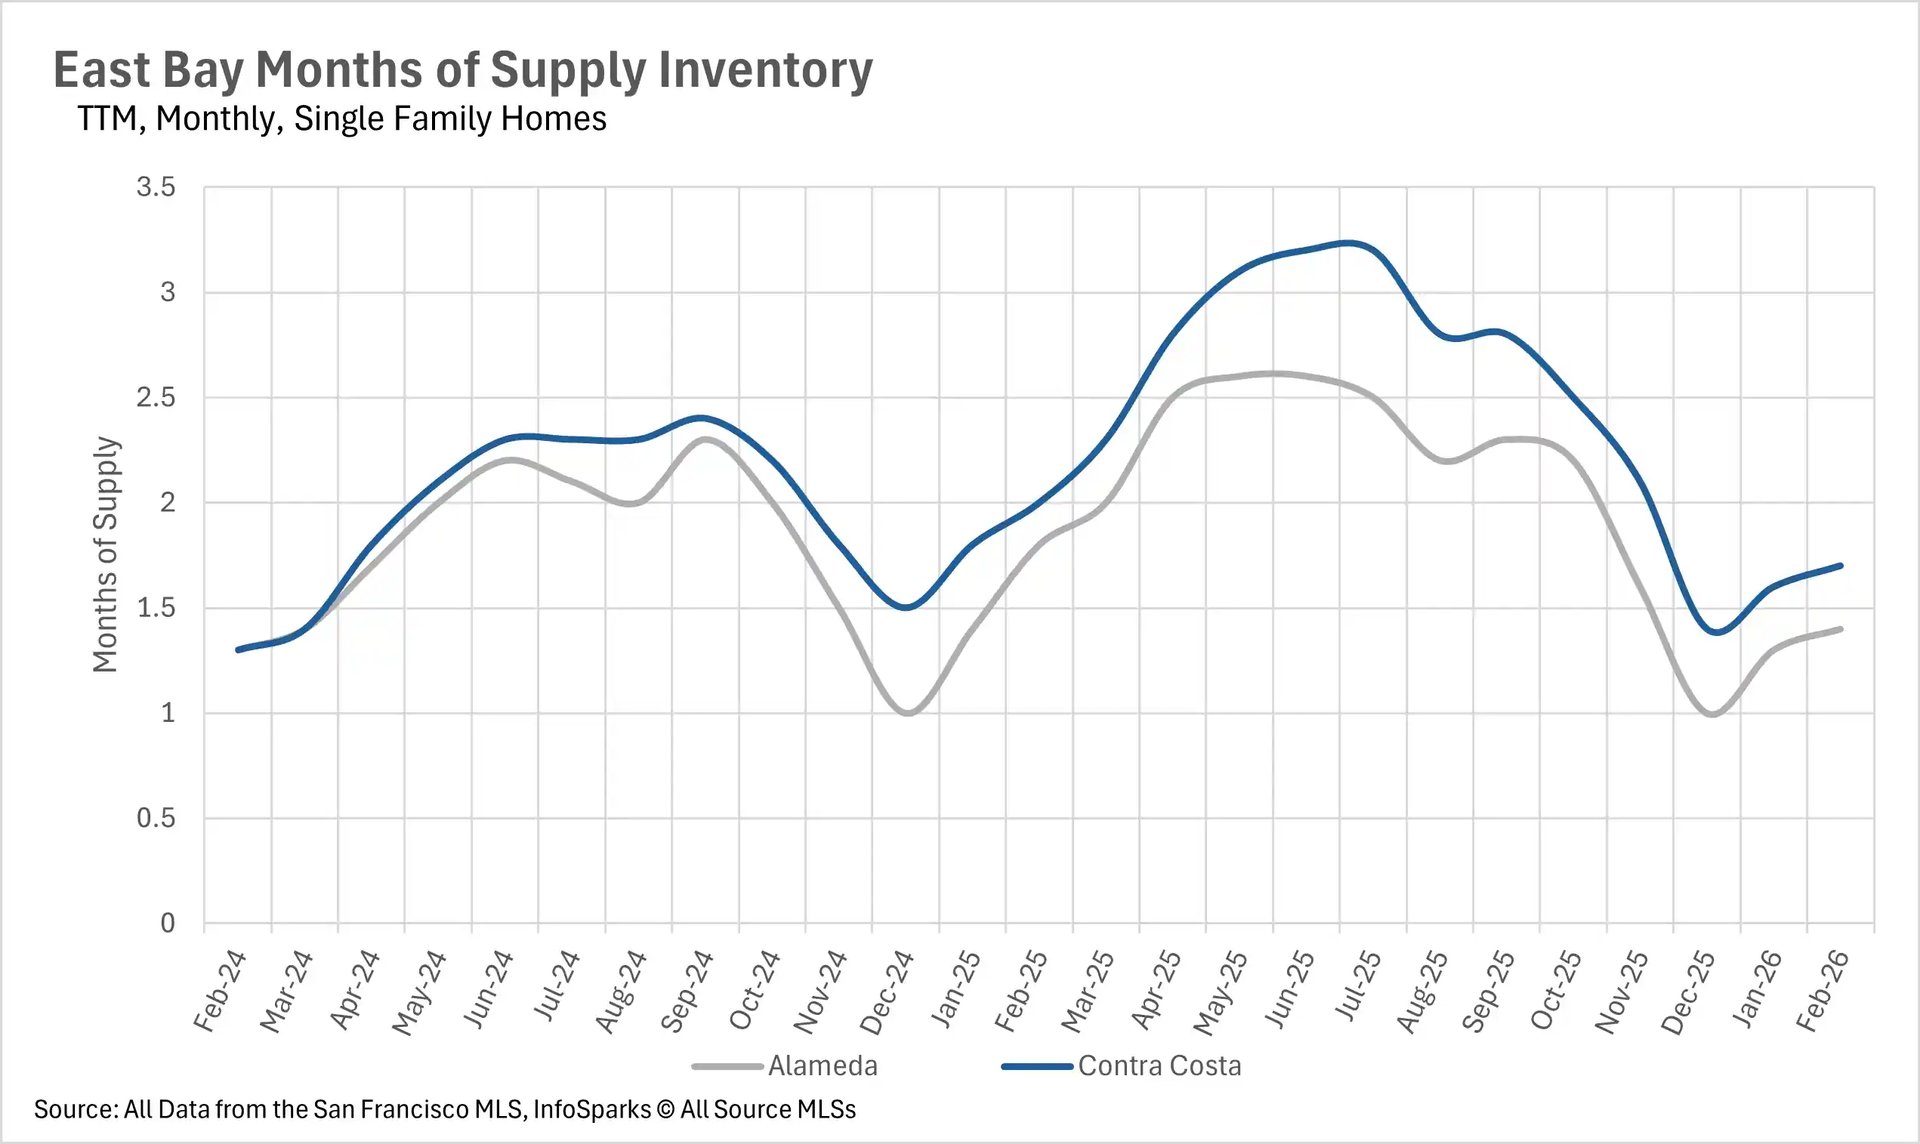
The single-family home market is firmly in seller's territory across virtually the entire Bay Area.  San Francisco sits at just 0.8 months of supply, while Santa Clara County and San Mateo County each have 1.1 months.  Marin County has 1.2 months of supply, down an incredible 68.42% year-over-year. Alameda County sits at 1.4 months, Contra Costa County at 1.7 months, Sonoma County at 1.8 months, and Solano County at 2 months.  Even Santa Cruz County, which has historically been more balanced, has tightened to just 2 months of supply.  The condo market is a bit more balanced, with several counties hovering right around the three-month threshold.  Alameda County has 3.3 months of condo supply, Contra Costa County has 3.2 months, and Sonoma County has 2.9 months.  However, Napa County remains a buyer's market at 4 months of condo supply, and Santa Cruz County sits at 3.6 months.  As we head deeper into the spring selling season, sellers across most of the Bay Area remain firmly in the driver's seat.


Local Lowdown Data


Line chart showing monthly median condo prices in North Bay (Sonoma, Marin, Solano, and Napa) from February 2023 to February 2026. Napa shows high volatility peaking near $1.5M, while Solano stays under $400k.

Comparative line chart of median single-family home prices in Sonoma, Marin, Solano, and Napa from 2023 to 2026. Marin County leads with prices between $1.5M and $2.0M.

Year-over-year percentage change bar chart for median condo prices in North Bay counties. Highlights a nearly 80% spike for Napa in July 2025 and a sharp 50% decrease in February 2026.

Bar chart displaying TTM year-over-year median price changes for single-family homes in North Bay. Data shows stable growth across most counties, with Napa experiencing a significant 20% decline in Feb 2026.

Monthly inventory combo chart for North Bay condos from 2024 to 2026. Illustrates new and sold listings versus total for-sale listings, showing an inventory peak in Spring 2025.

Real estate inventory chart for North Bay single-family homes (2024–2026). Seasonal trends show for-sale listings peaking at 4,000 units in mid-2025 before dropping to 1,500 by early 2026.

Line graph tracking months of supply for condos in North Bay. Napa shows a higher supply level, peaking at over 9 months in mid-2025, while Sonoma and Marin stay between 2-4 months.

Line chart comparing months of supply for single-family homes. Napa remains the outlier with higher supply levels, while Marin County drops to its lowest point of 1 month by Feb 2026.

Line chart showing average days on market for condos in North Bay. Napa reaches peaks near 200 days in early 2025, while Sonoma, Marin, and Solano range between 30 and 70 days.

Monthly trend chart for days on market for single-family homes. Highlights Napa peaking at 90 days and Marin County showing fast turnover at roughly 22 days by Feb 2026.

Low-angle view of modern, multi-story residential townhomes featuring vibrant red and pale beige exterior siding under a bright blue sky with scattered clouds.

Line chart displaying East Bay median condo prices over a three-year monthly period, comparing real estate trends in Alameda and Contra Costa counties.

Line chart showing East Bay median single-family home prices over a three-year period, tracking values across Alameda and Contra Costa counties.

Bar chart illustrating year-over-year median condo price changes in the East Bay, comparing percentage fluctuations for the Alameda and Contra Costa real estate markets.

Bar chart showing year-over-year median single-family home price percentage changes for East Bay real estate markets across Alameda and Contra Costa counties.

Combination chart tracking two-year monthly condo inventory in the East Bay, detailing the volume of new listings, sold listings, and total active homes for sale.

Combination chart tracking two-year monthly single-family home inventory in the East Bay, highlighting the volume of new listings, sold units, and total active housing supply.

Line graph depicting months of supply inventory for East Bay condos, comparing market saturation and supply levels in Alameda and Contra Costa counties.

Line graph showing months of supply housing inventory for East Bay single-family homes, tracking market balance across Alameda and Contra Costa counties.

Line graph tracking the average days on market for condos in the East Bay, comparing the speed of real estate sales in Alameda and Contra Costa counties.

Low-angle view of modern, multi-story residential townhomes featuring vibrant red and pale beige exterior siding under a bright blue sky with scattered clouds.

Line chart displaying Silicon Valley median condo prices over a three-year monthly period, comparing real estate trends in San Mateo, Santa Clara, and Santa Cruz counties.

Line chart showing Silicon Valley median single-family home prices over a three-year period, tracking values across San Mateo, Santa Clara, and Santa Cruz counties.

Bar chart illustrating year-over-year median condo price changes in Silicon Valley, comparing percentage fluctuations for the San Mateo, Santa Clara, and Santa Cruz markets.

Bar chart showing year-over-year median single-family home price percentage changes for Silicon Valley real estate markets across San Mateo, Santa Clara, and Santa Cruz.

Combination chart tracking two-year monthly condo inventory in Silicon Valley, detailing the volume of new listings, sold listings, and total active homes for sale.

Combination chart tracking two-year monthly single-family home inventory in Silicon Valley, highlighting the volume of new listings, sold units, and total active housing supply.

Line graph depicting months of supply inventory for Silicon Valley condos, comparing market saturation and supply levels in San Mateo, Santa Clara, and Santa Cruz.

Line graph showing months of supply housing inventory for Silicon Valley single-family homes, tracking market balance across San Mateo, Santa Clara, and Santa Cruz.

Line graph tracking the average days on market for condos in Silicon Valley, comparing the speed of real estate sales in San Mateo, Santa Clara, and Santa Cruz.

Modern stone building featuring a terracotta dome and large glass windows against a clear blue sky, partially framed by green and yellow trees.

Line chart displaying San Francisco median real estate prices over a three-year monthly period, comparing price trends between single-family homes and condos.

Bar chart illustrating San Francisco median real estate price changes year-over-year, showing percentage fluctuations for both single-family homes and condos.

Line graph tracking the average percentage of the original list price received in San Francisco over a three-year period, comparing single-family homes and condos.

Line graph of San Francisco months of supply housing inventory, showing market saturation trends for single-family homes versus condos.

Combination chart tracking two-year monthly condo inventory in San Francisco, detailing the volume of new listings, sold listings, and total active condos for sale.

Combination chart tracking two-year monthly single-family home inventory in San Francisco, highlighting the volume of new listings, sold units, and total active housing supply.

Let’s Talk

You’ve got questions and we can’t wait to answer them.

Follow Us on Instagram