Bay Area Real Estate - June 2026 Market Report

Bay Area Real Estate - June 2026 Market Report

The Local Lowdown

Quick Take:

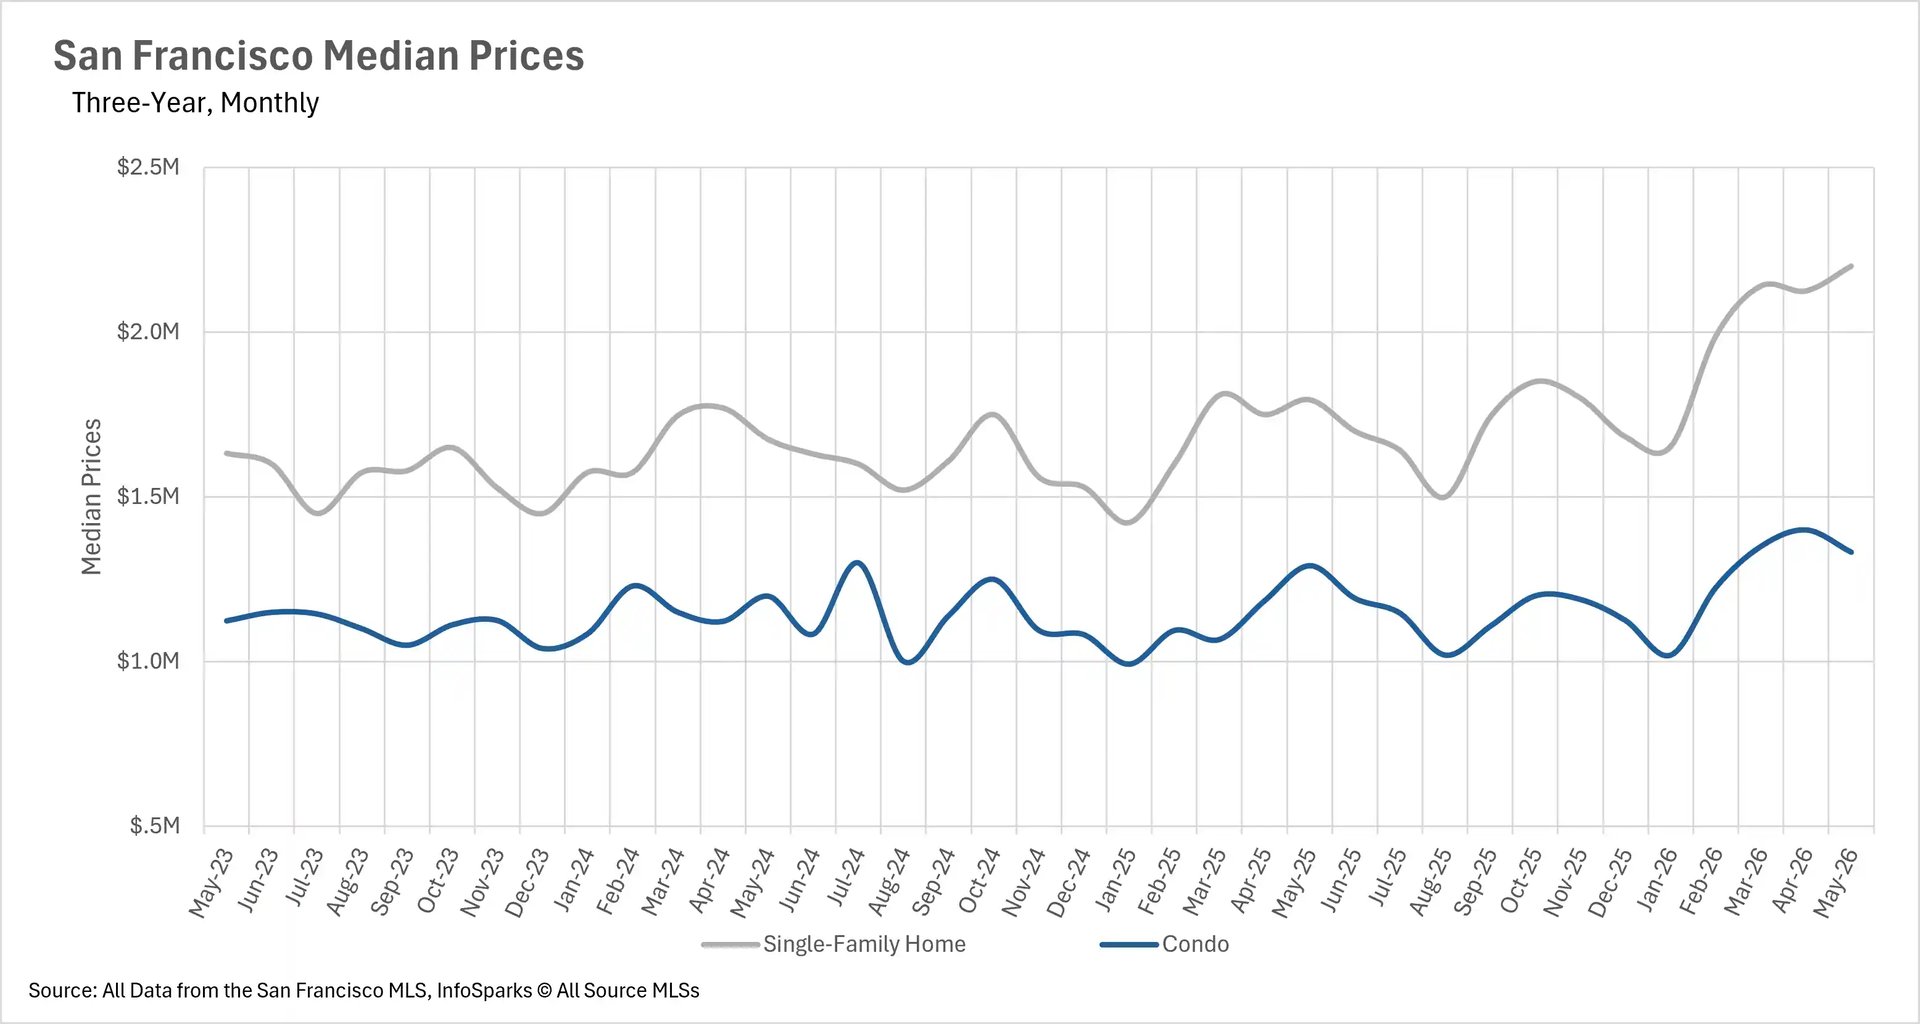
  • Prices are rising across much of the Bay Area, with San Francisco single-family homes breaching the $2.2 million mark for the first time and the East Bay posting gains across both single-family homes and condos for the first time in over a year.

  • Inventory levels have plummeted across the region, with year-over-year declines ranging from nearly 19% in Silicon Valley to more than 44% in San Francisco, leaving buyers with extremely limited options heading into summer.

  • Single-family homes are selling in roughly two weeks or less throughout the Bay Area, while the condo market is showing signs of improvement in several sub-markets.

  • The single-family home market is firmly in seller's territory across virtually every county, while the condo market remains more favorable for buyers in several East Bay and North Bay markets.

Note: You can find the charts/graphs for the Local Lowdown at the end of this section.

Prices are climbing as the Bay Area heads into summer

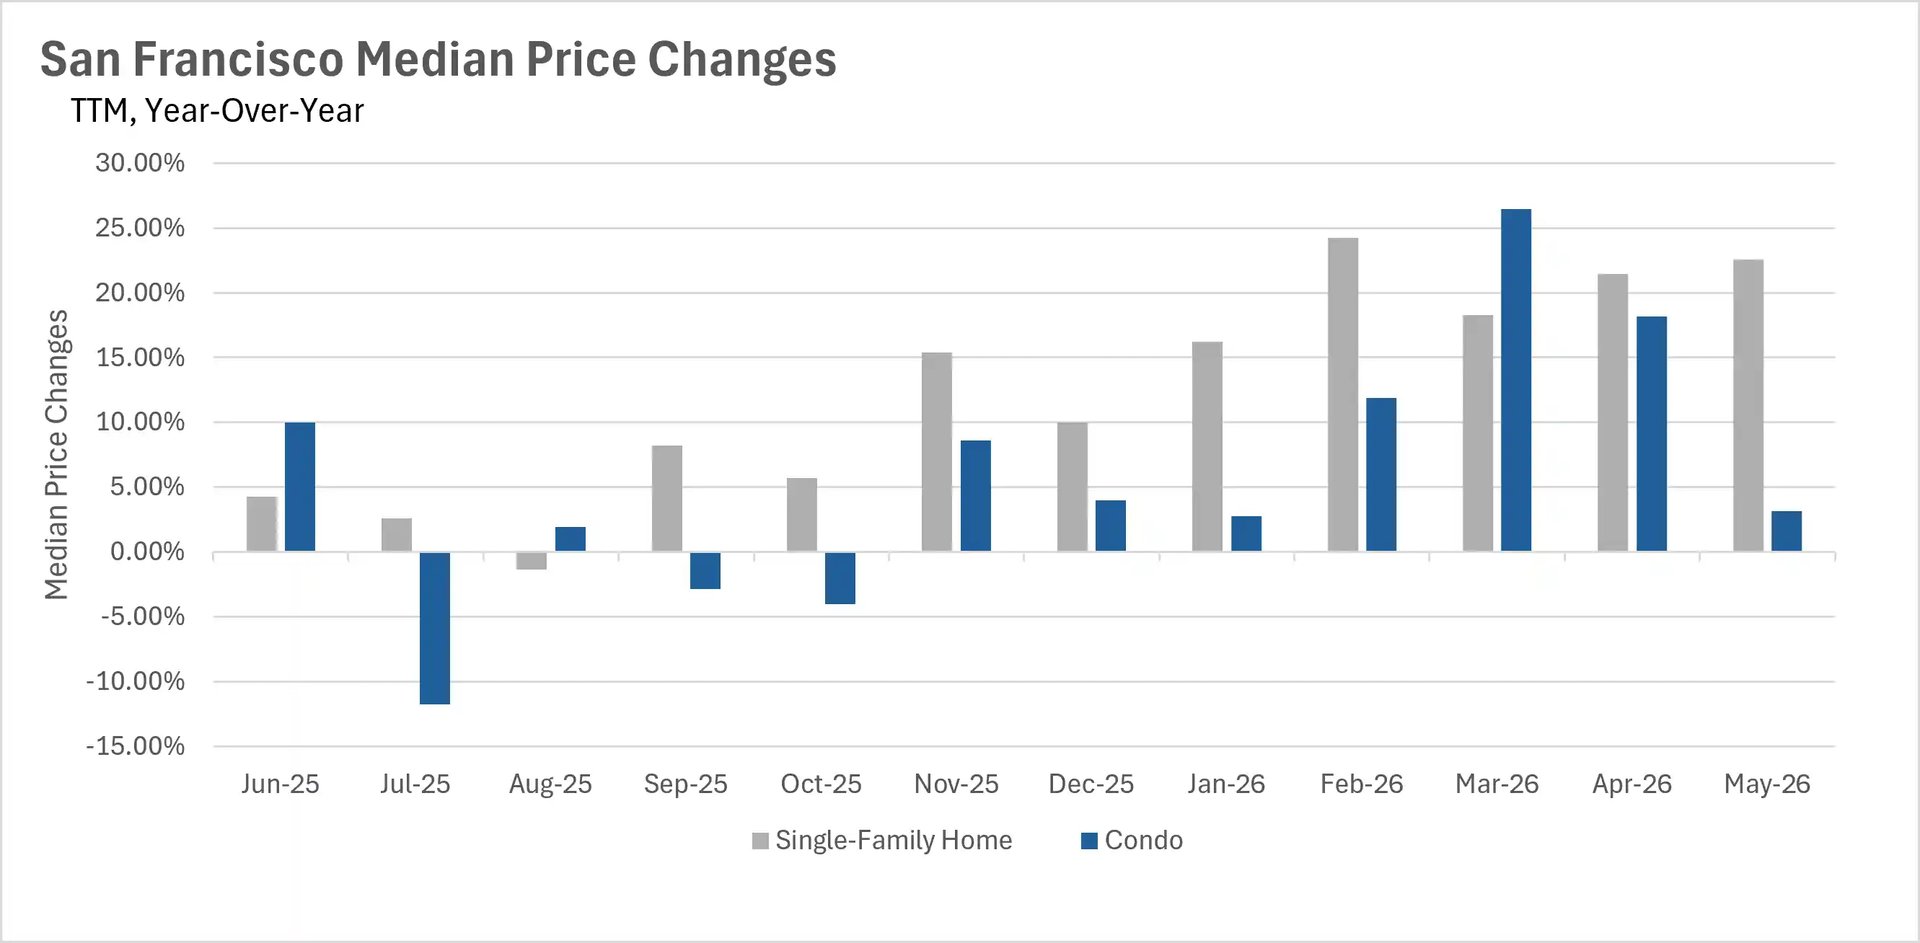
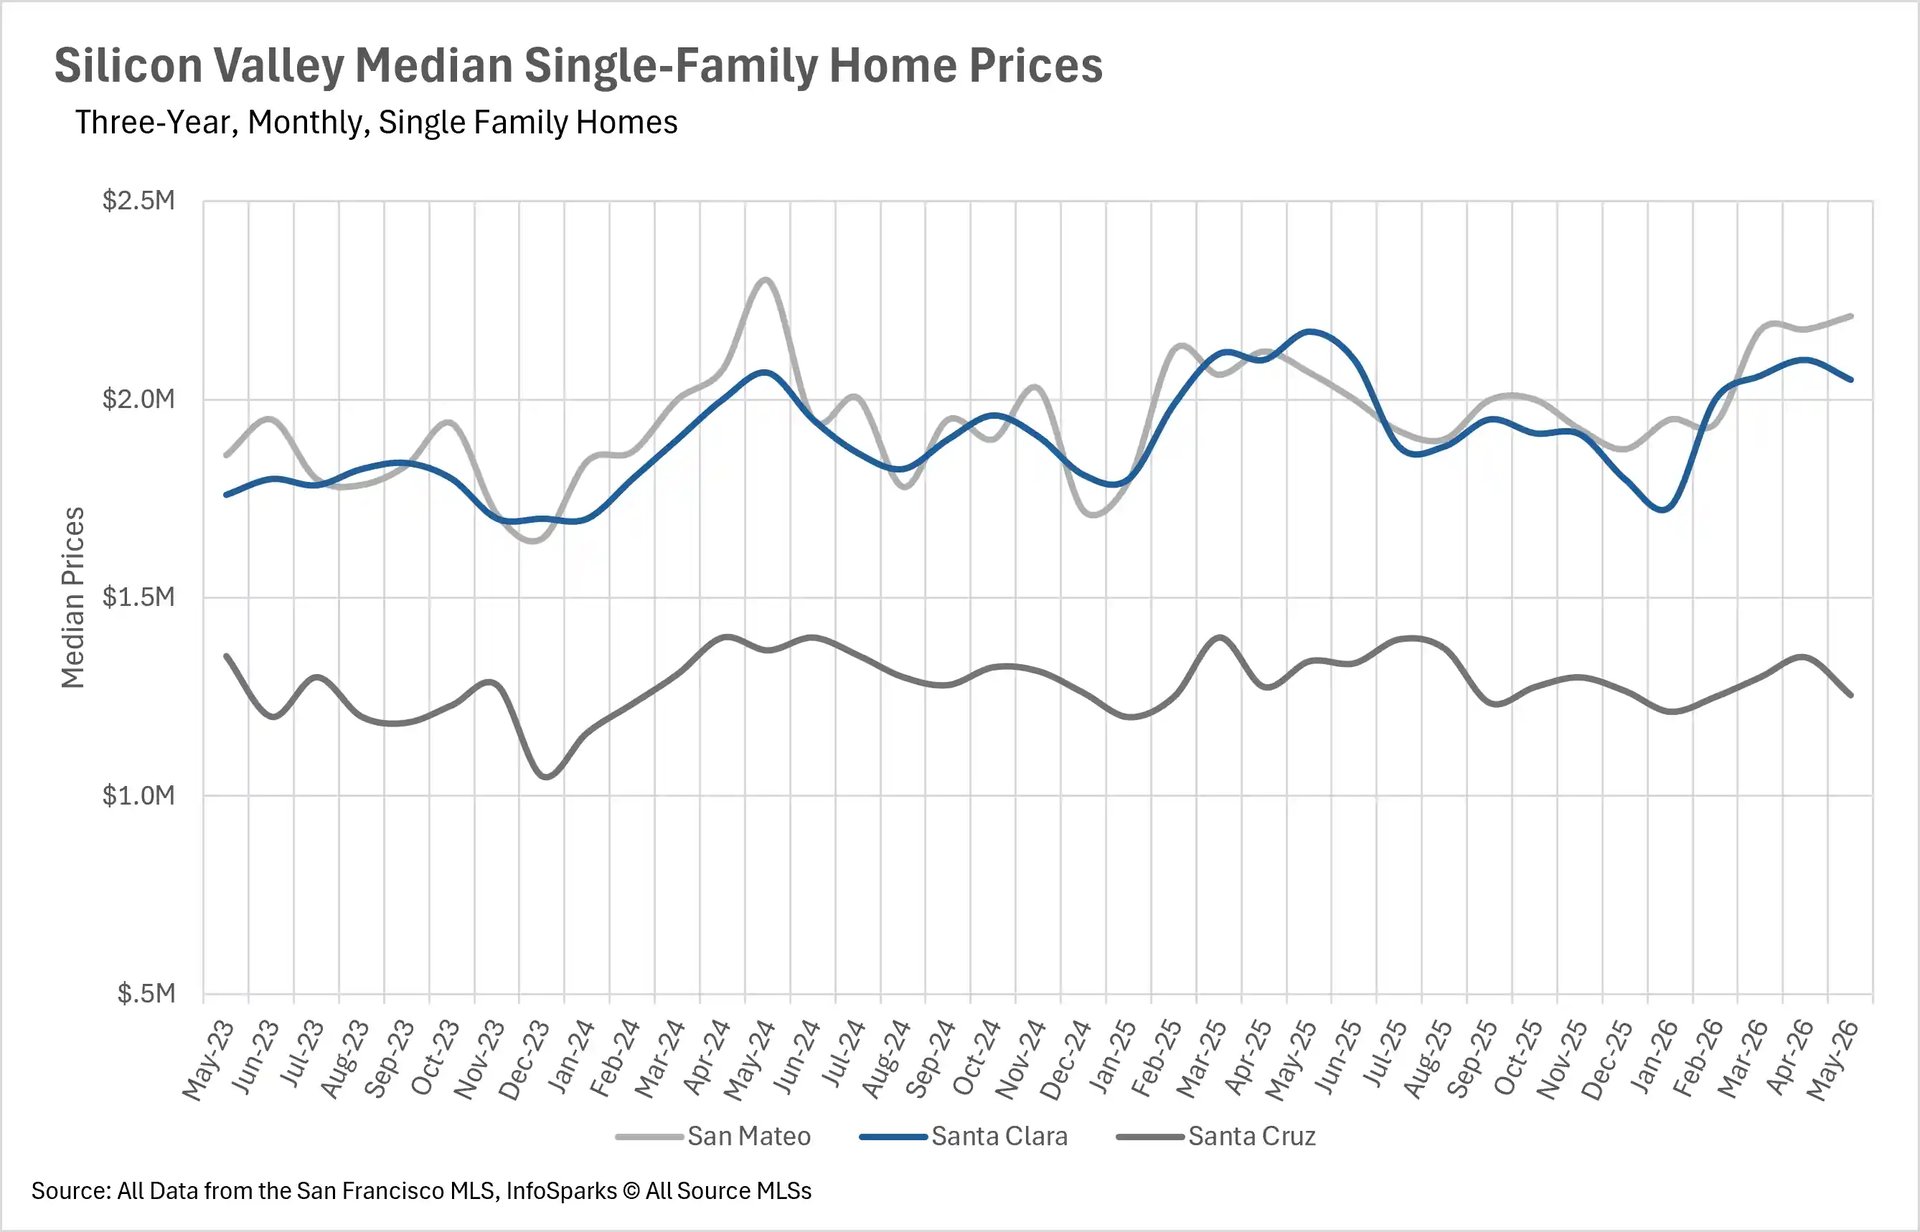
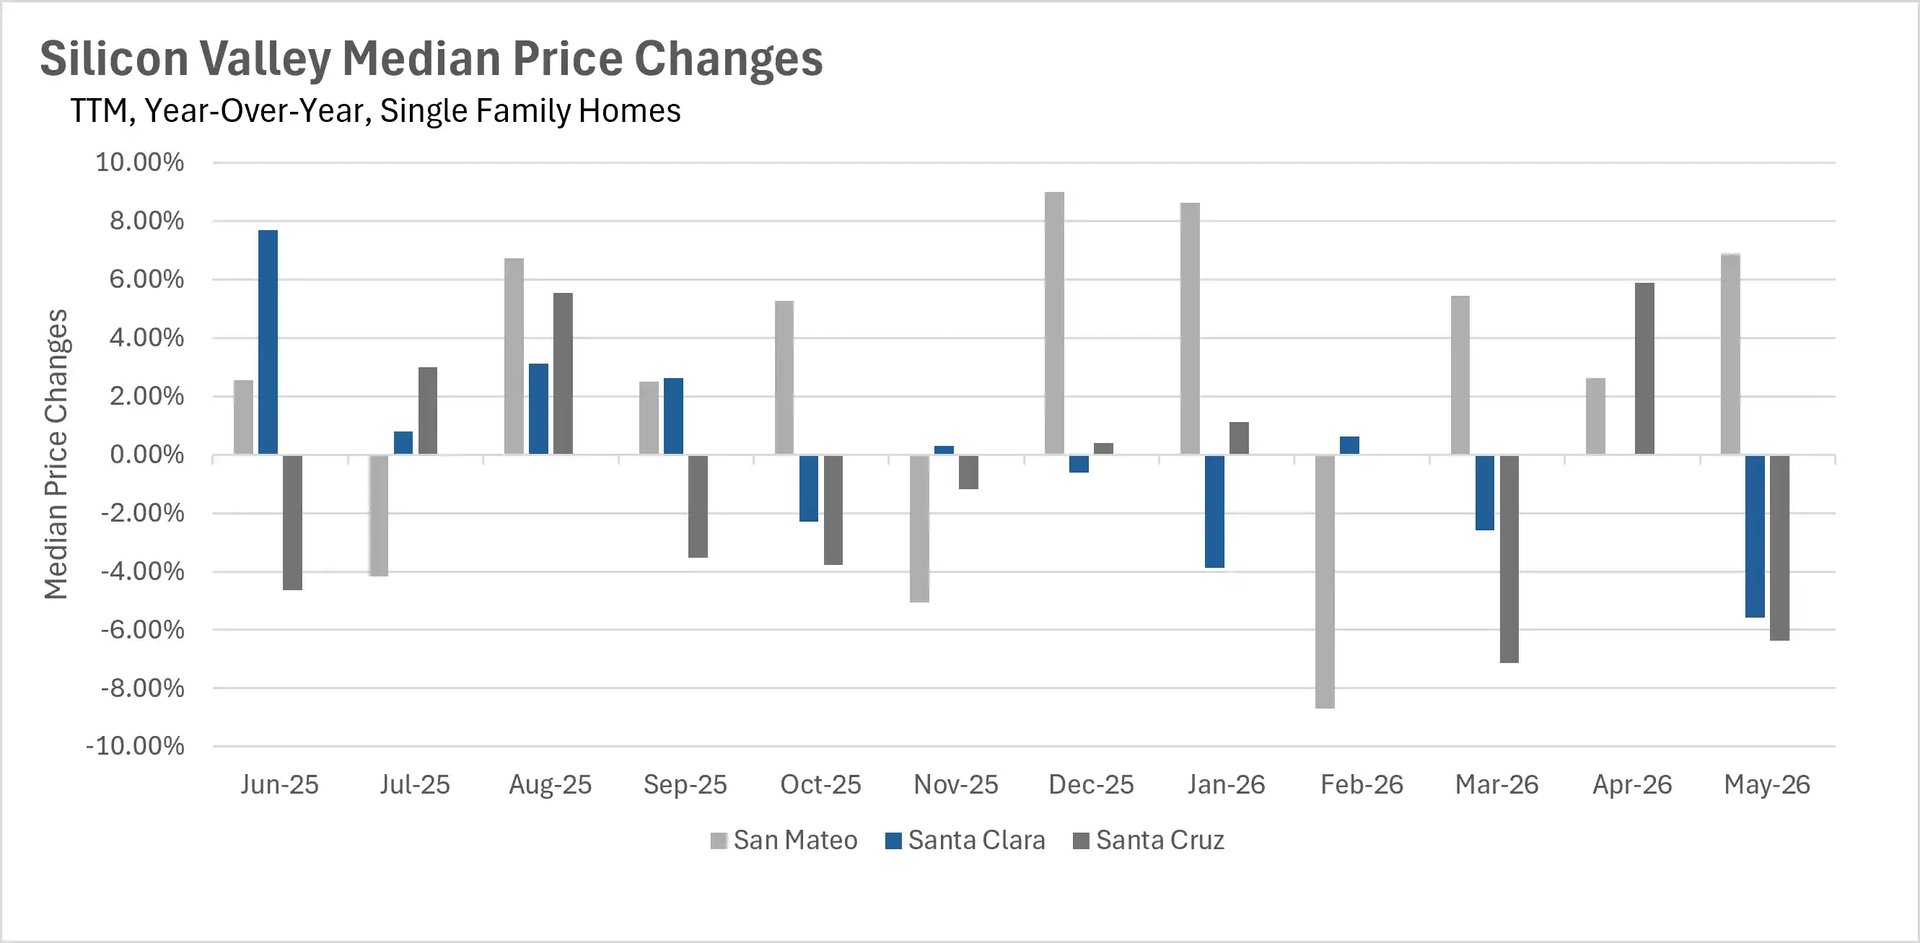
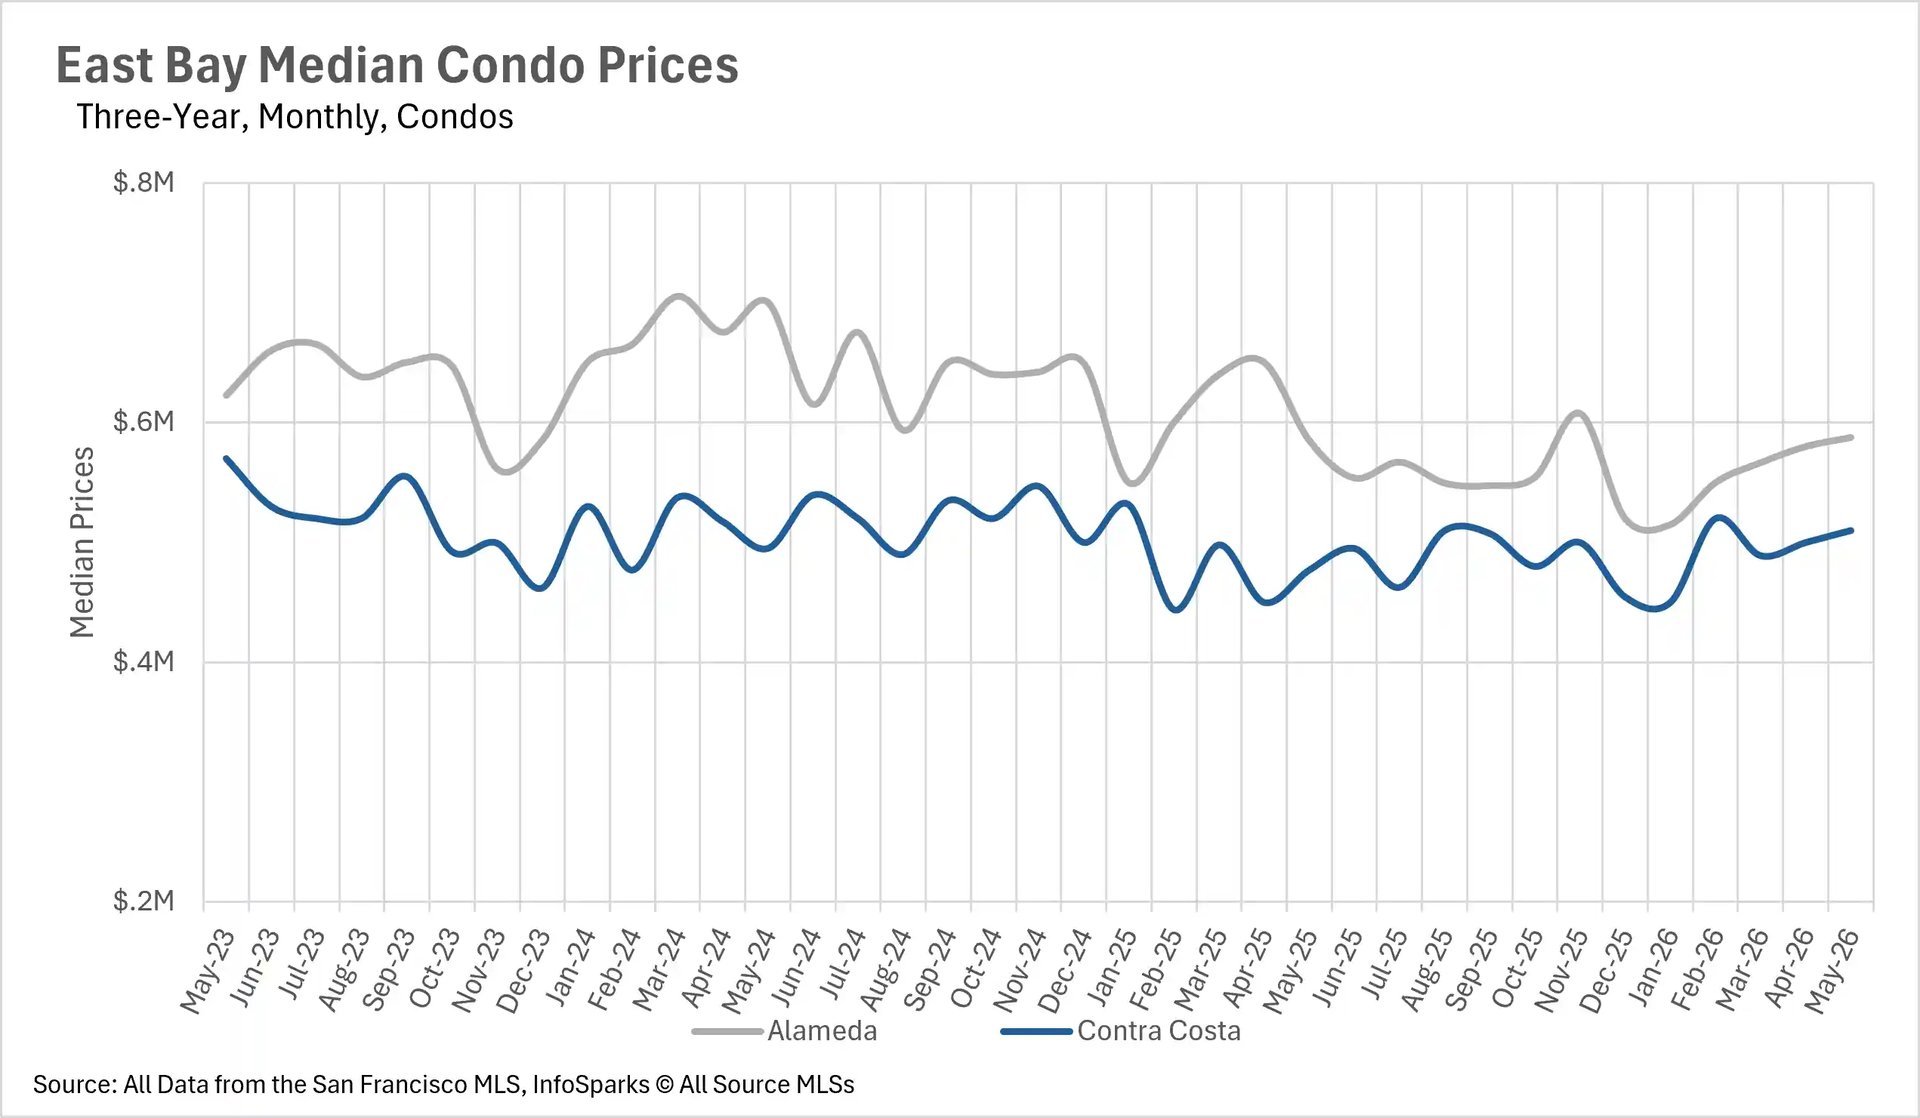
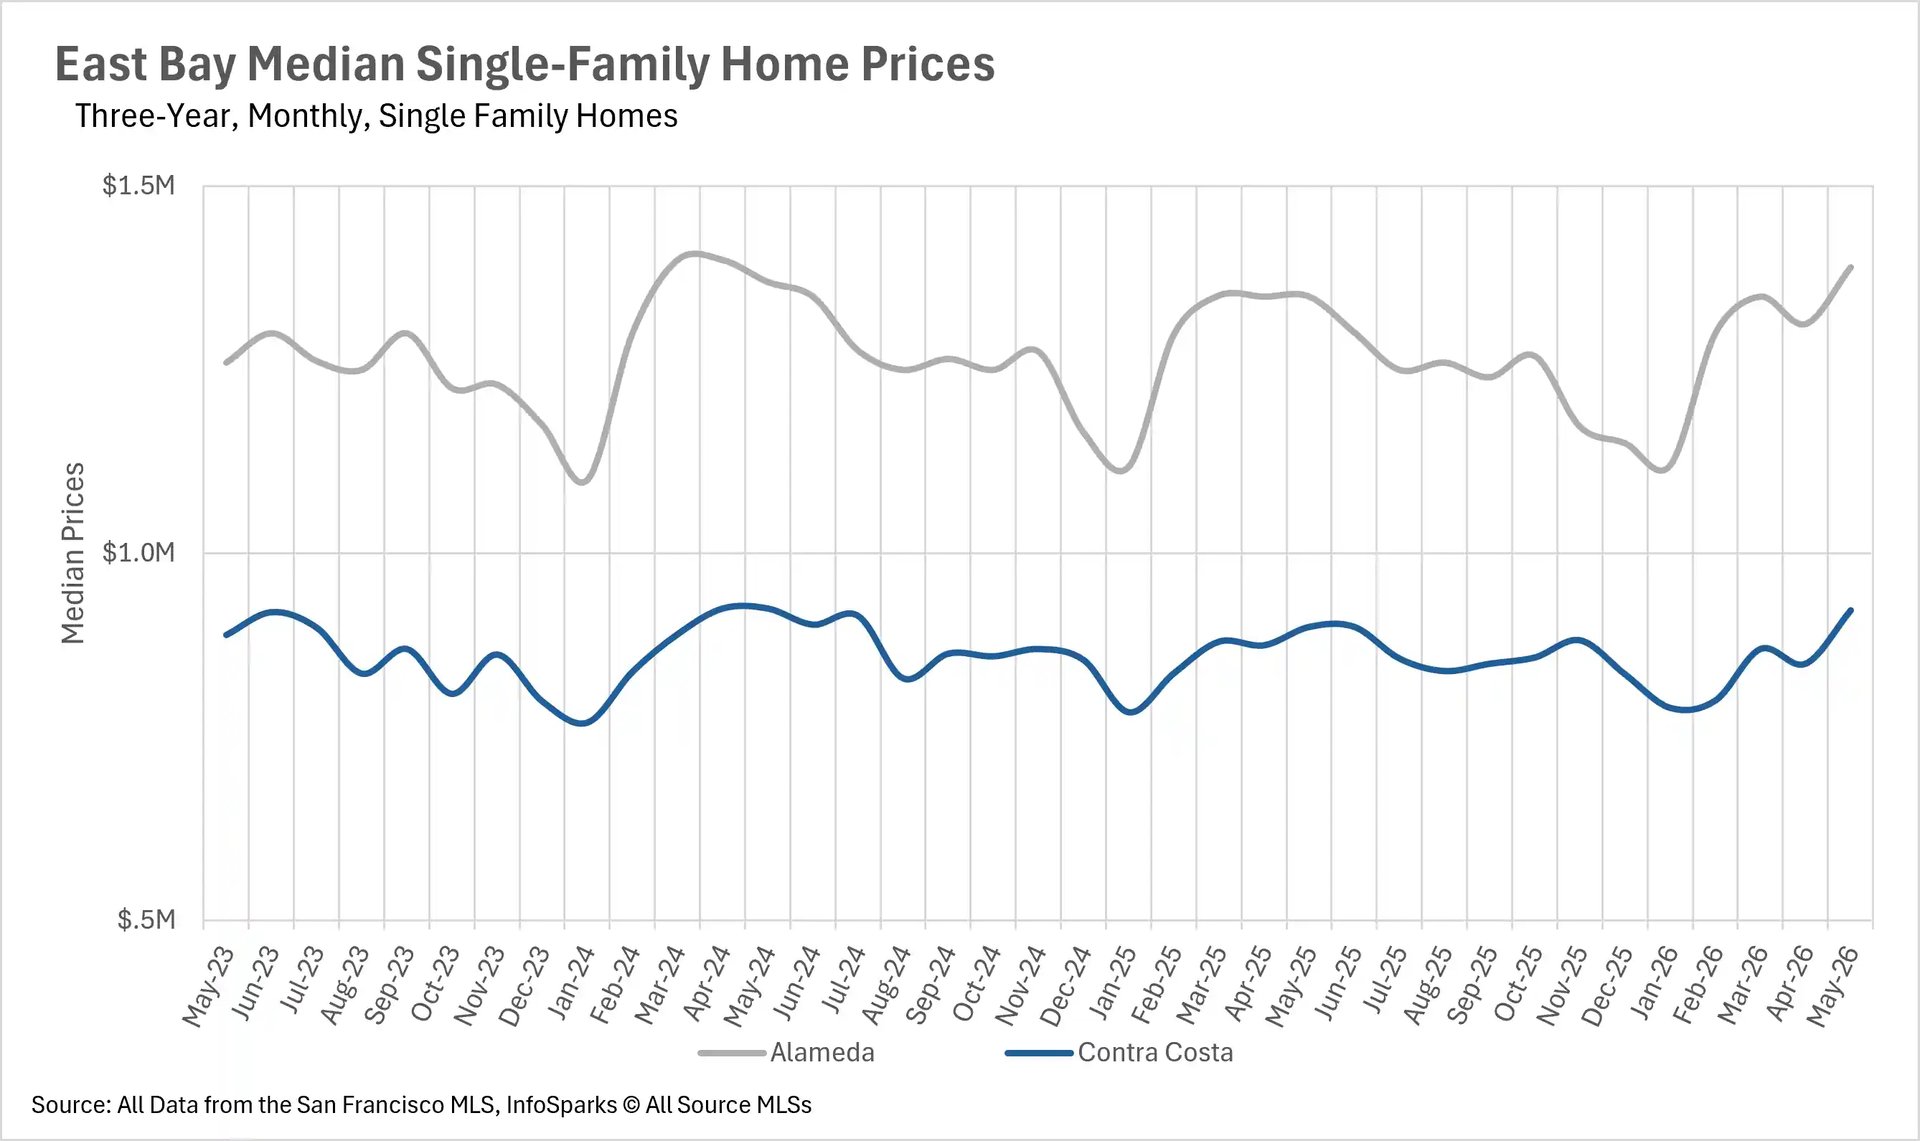
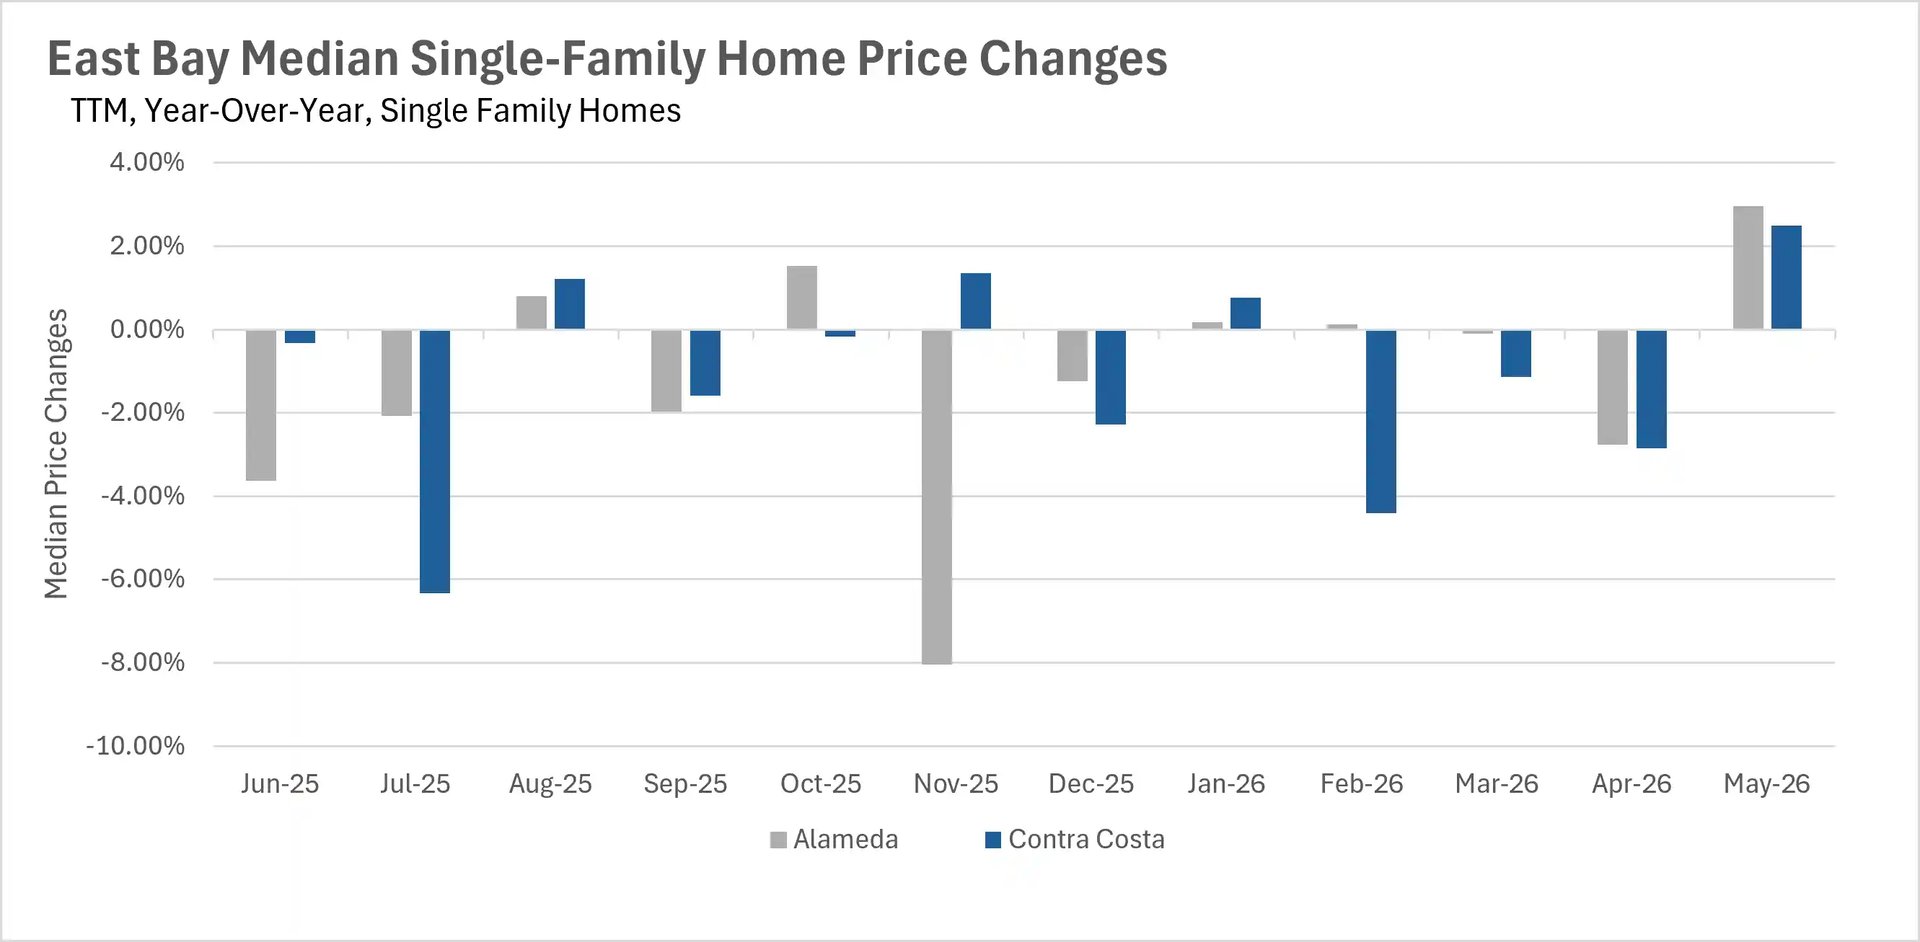
May brought positive momentum to much of the Bay Area's single-family home market, with several notable milestones along the way. San Francisco's median single-family home sale price soared 22.56% year-over-year to $2,200,000, marking one of the strongest gains in the market's recent history. In Silicon Valley, San Mateo County posted an impressive 6.87% year-over-year increase to $2,210,000, though Santa Clara County pulled back 5.58% to $2,050,000 and Santa Cruz County declined 6.38% to $1,254,500. The East Bay delivered a welcome surprise, as both Alameda and Contra Costa Counties posted year-over-year gains of 2.96% and 2.50%, respectively.

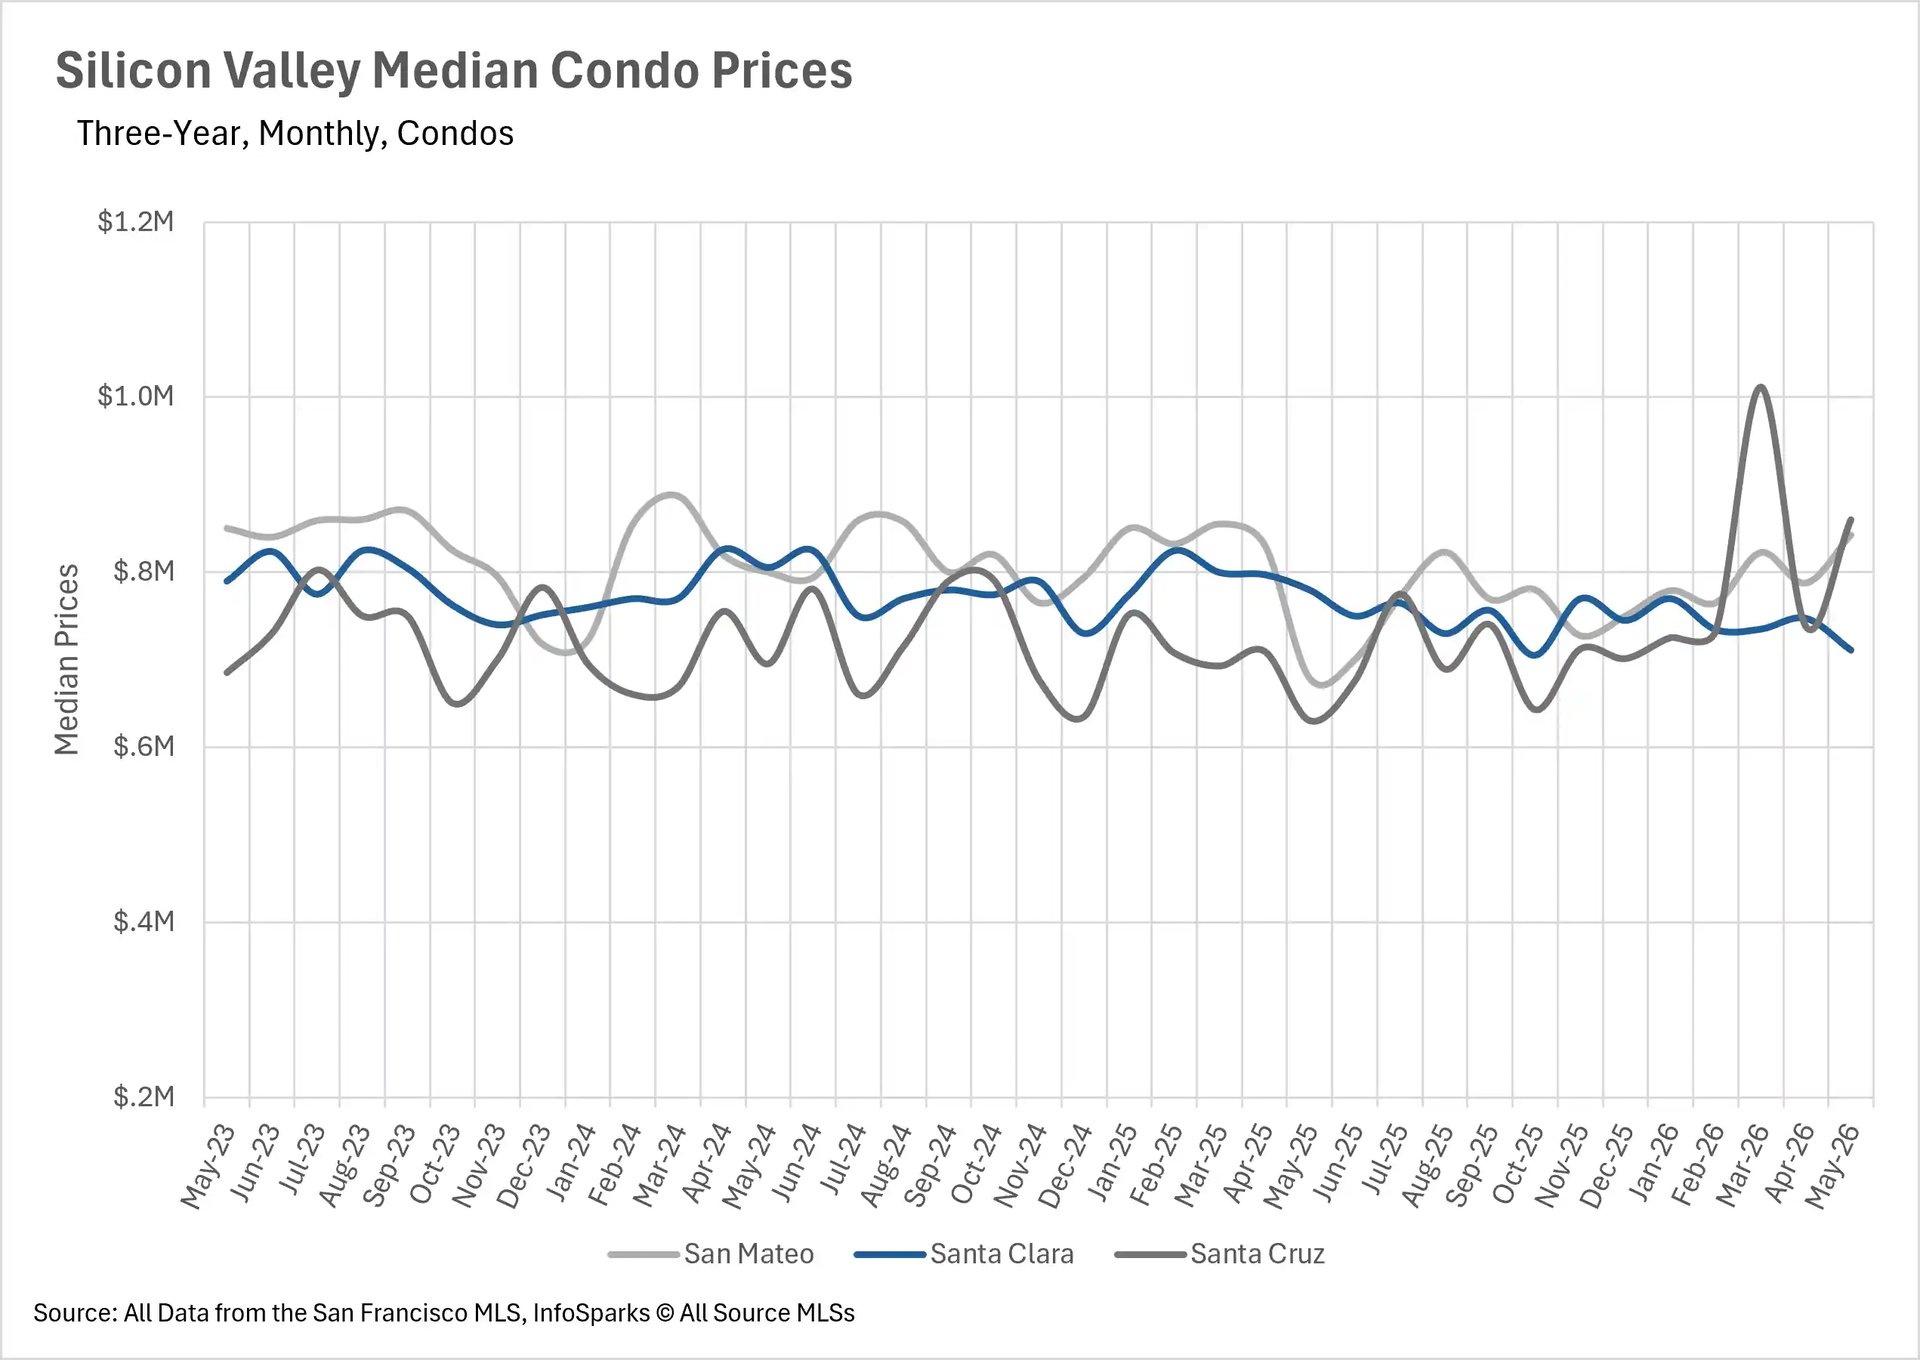
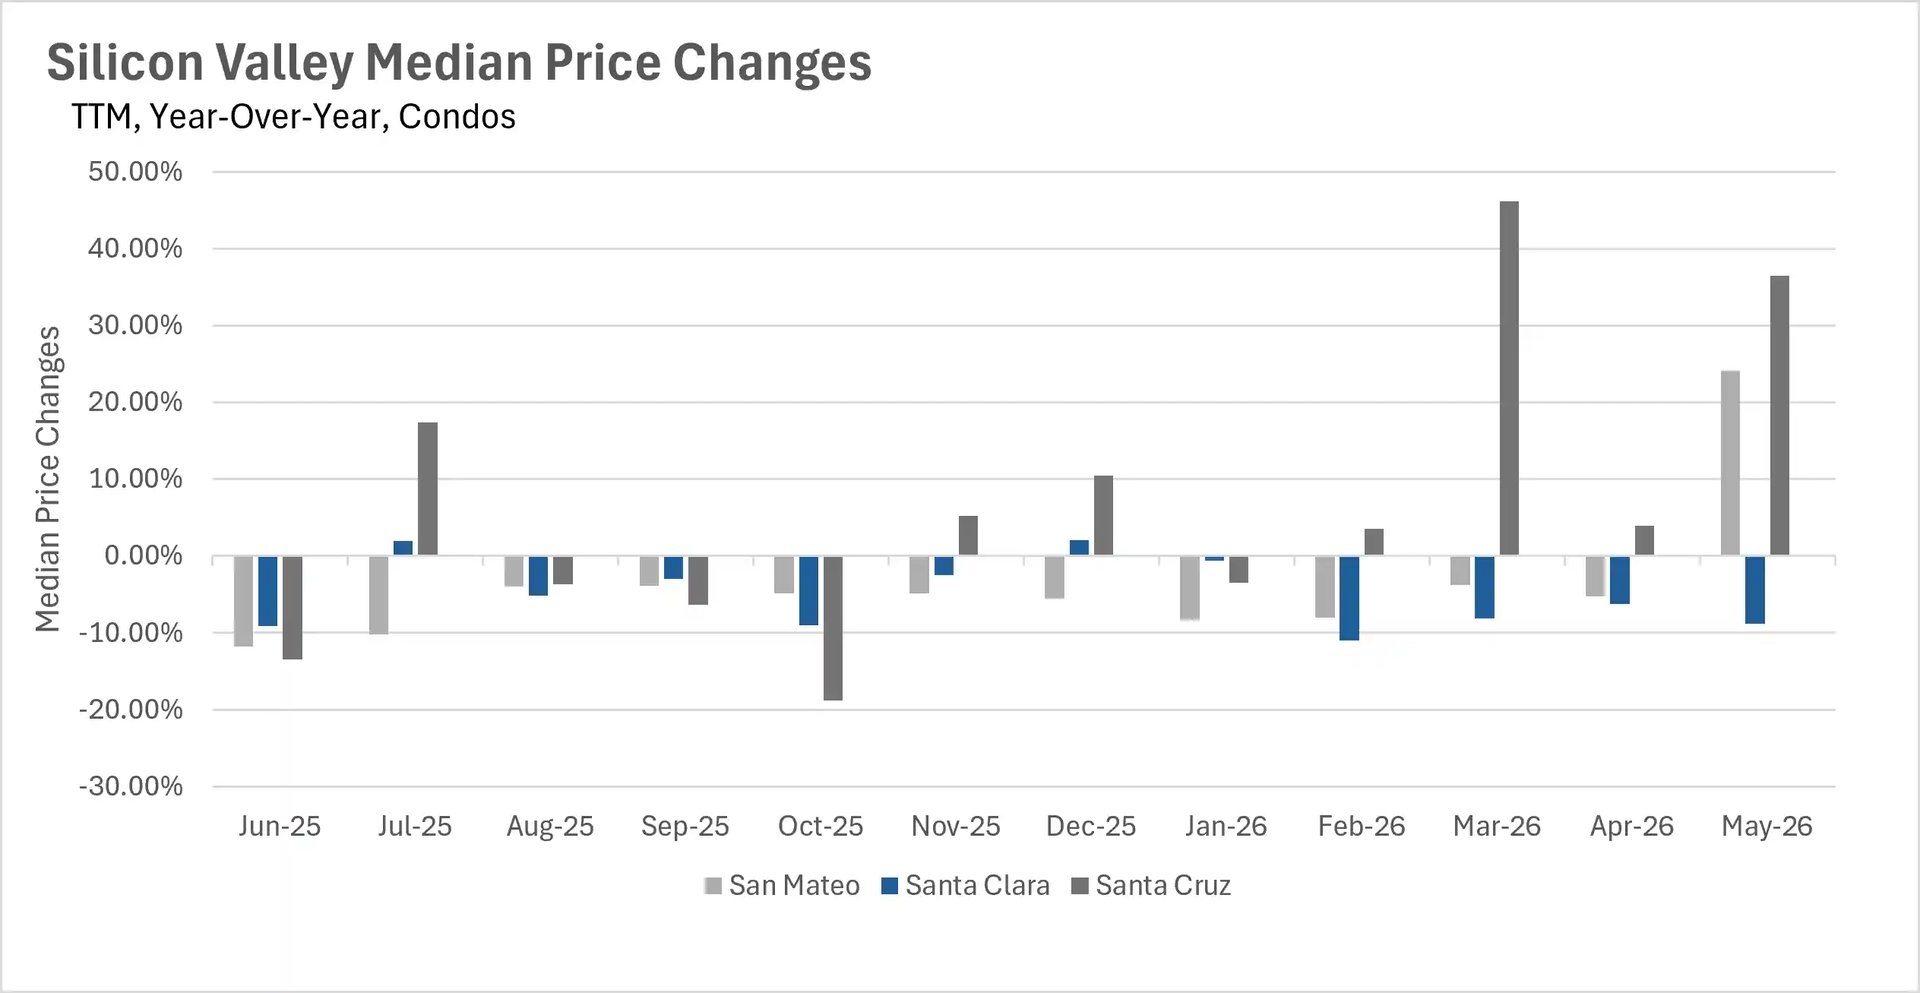
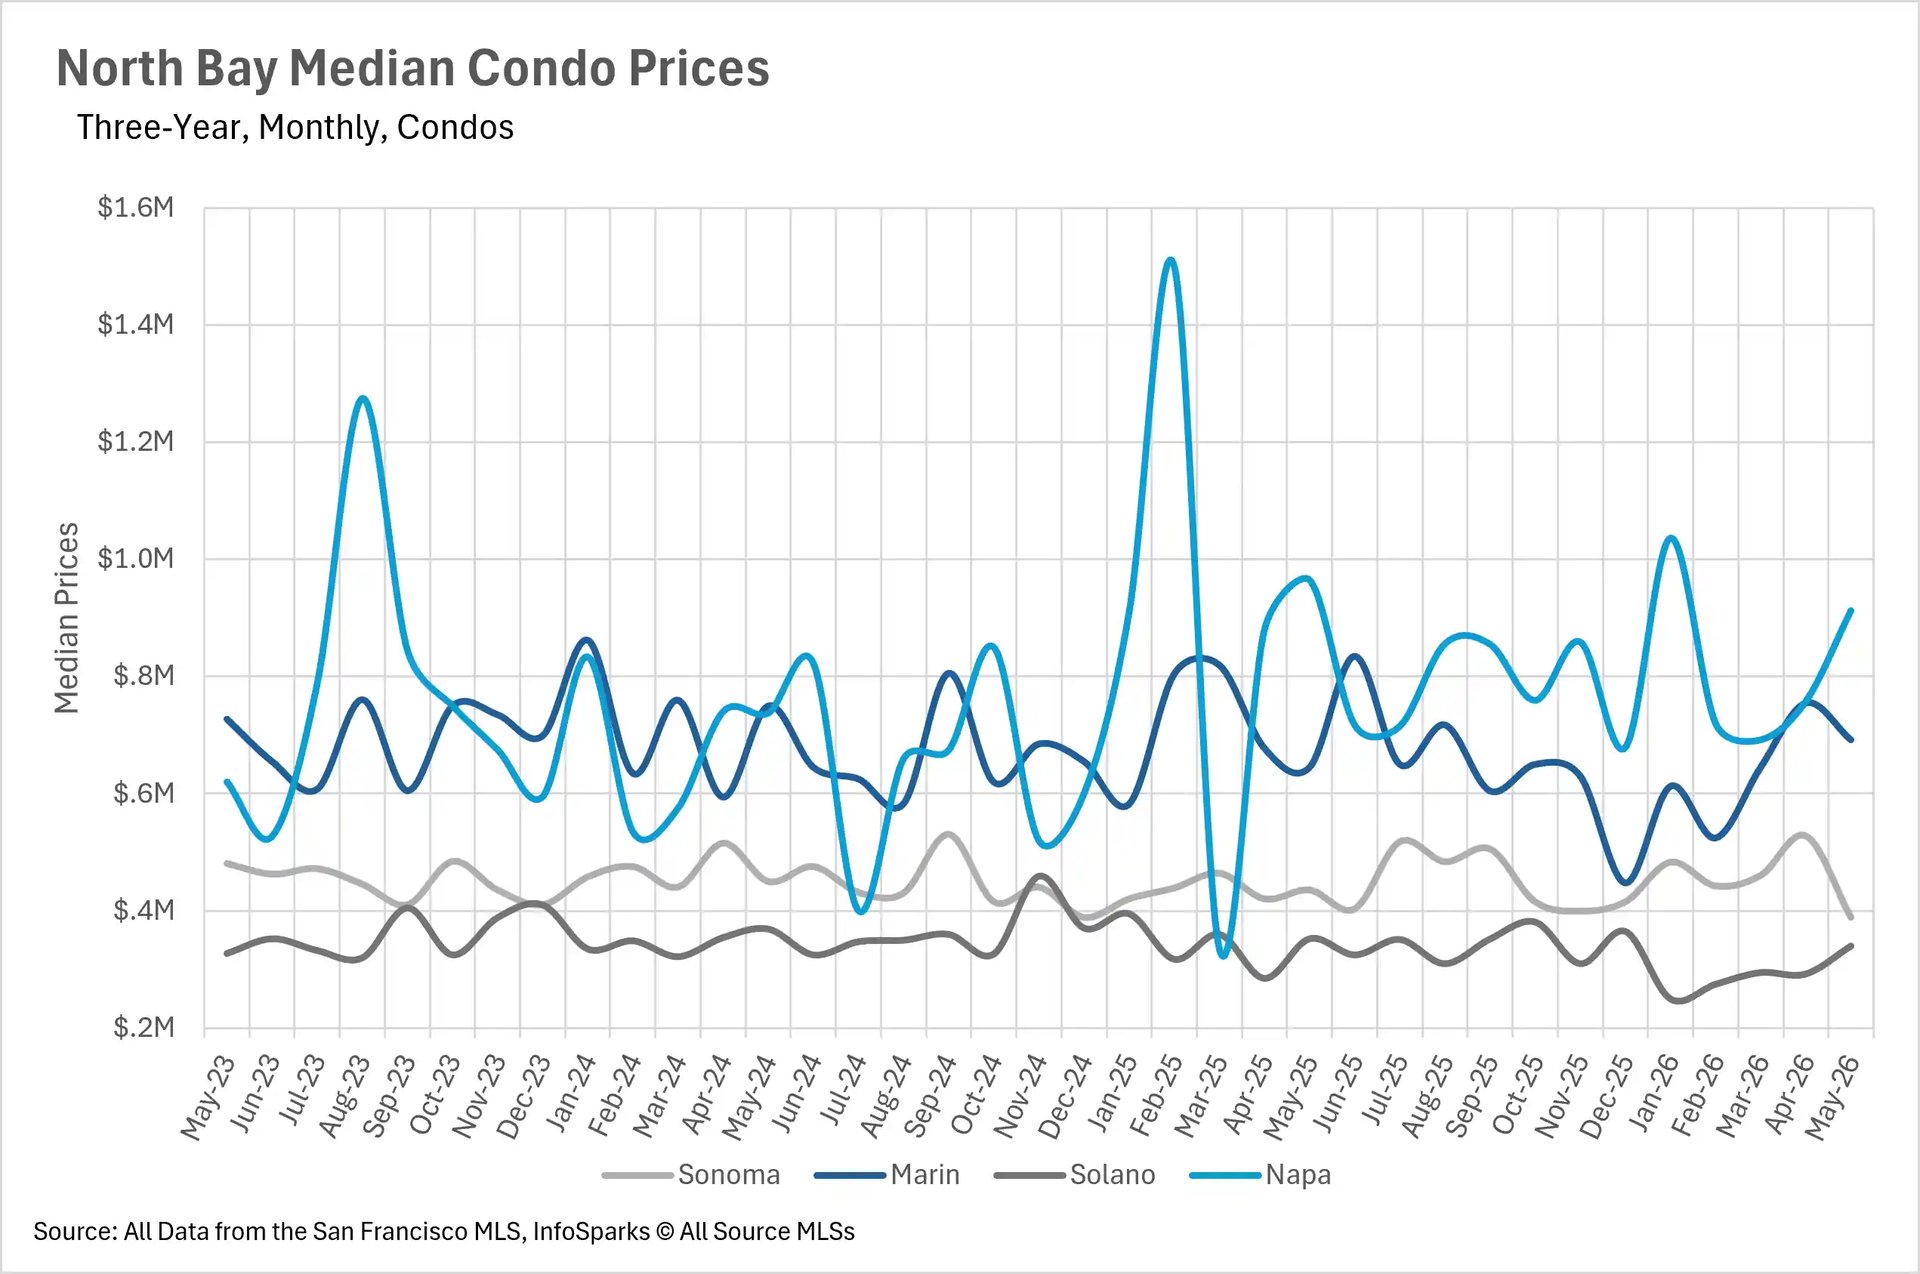
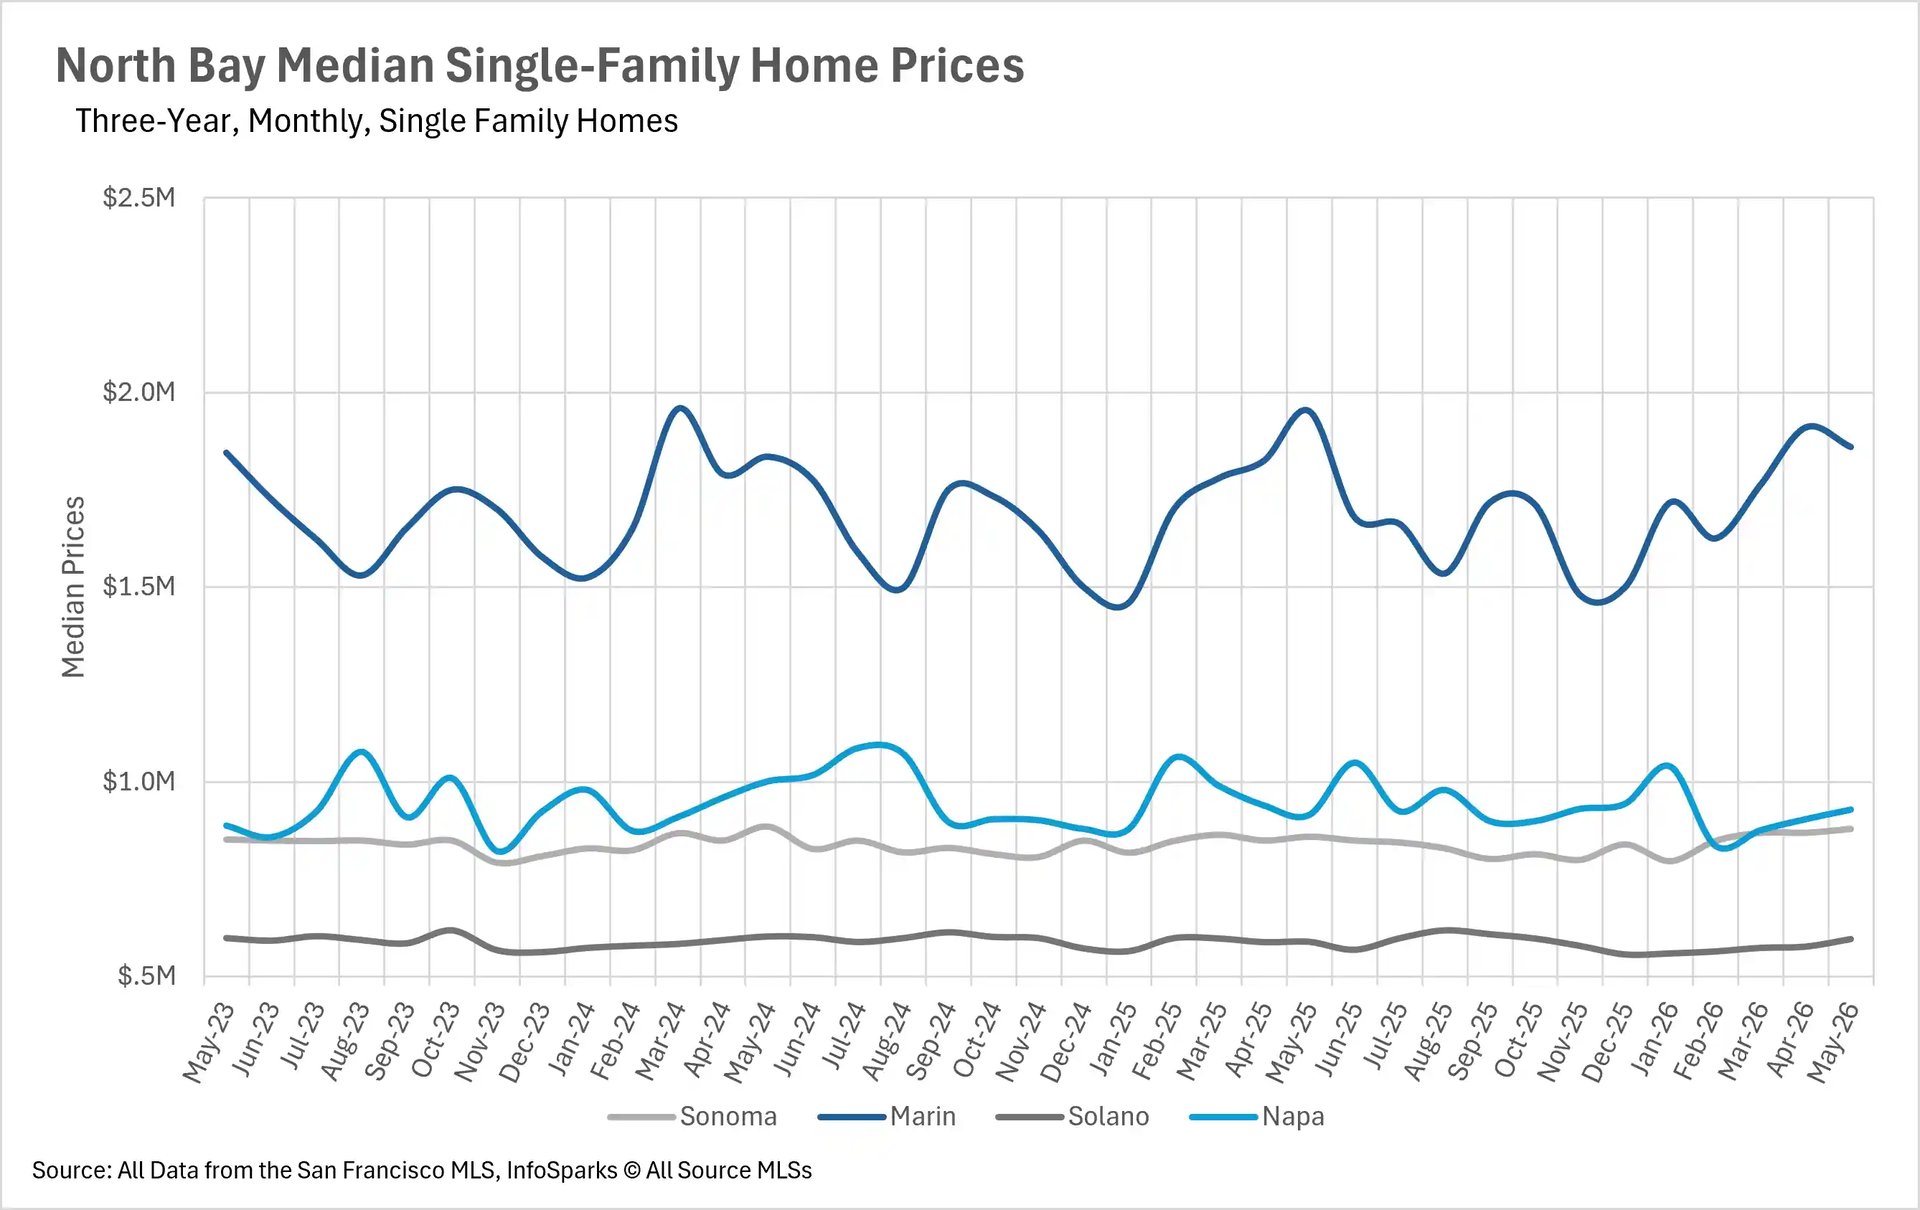
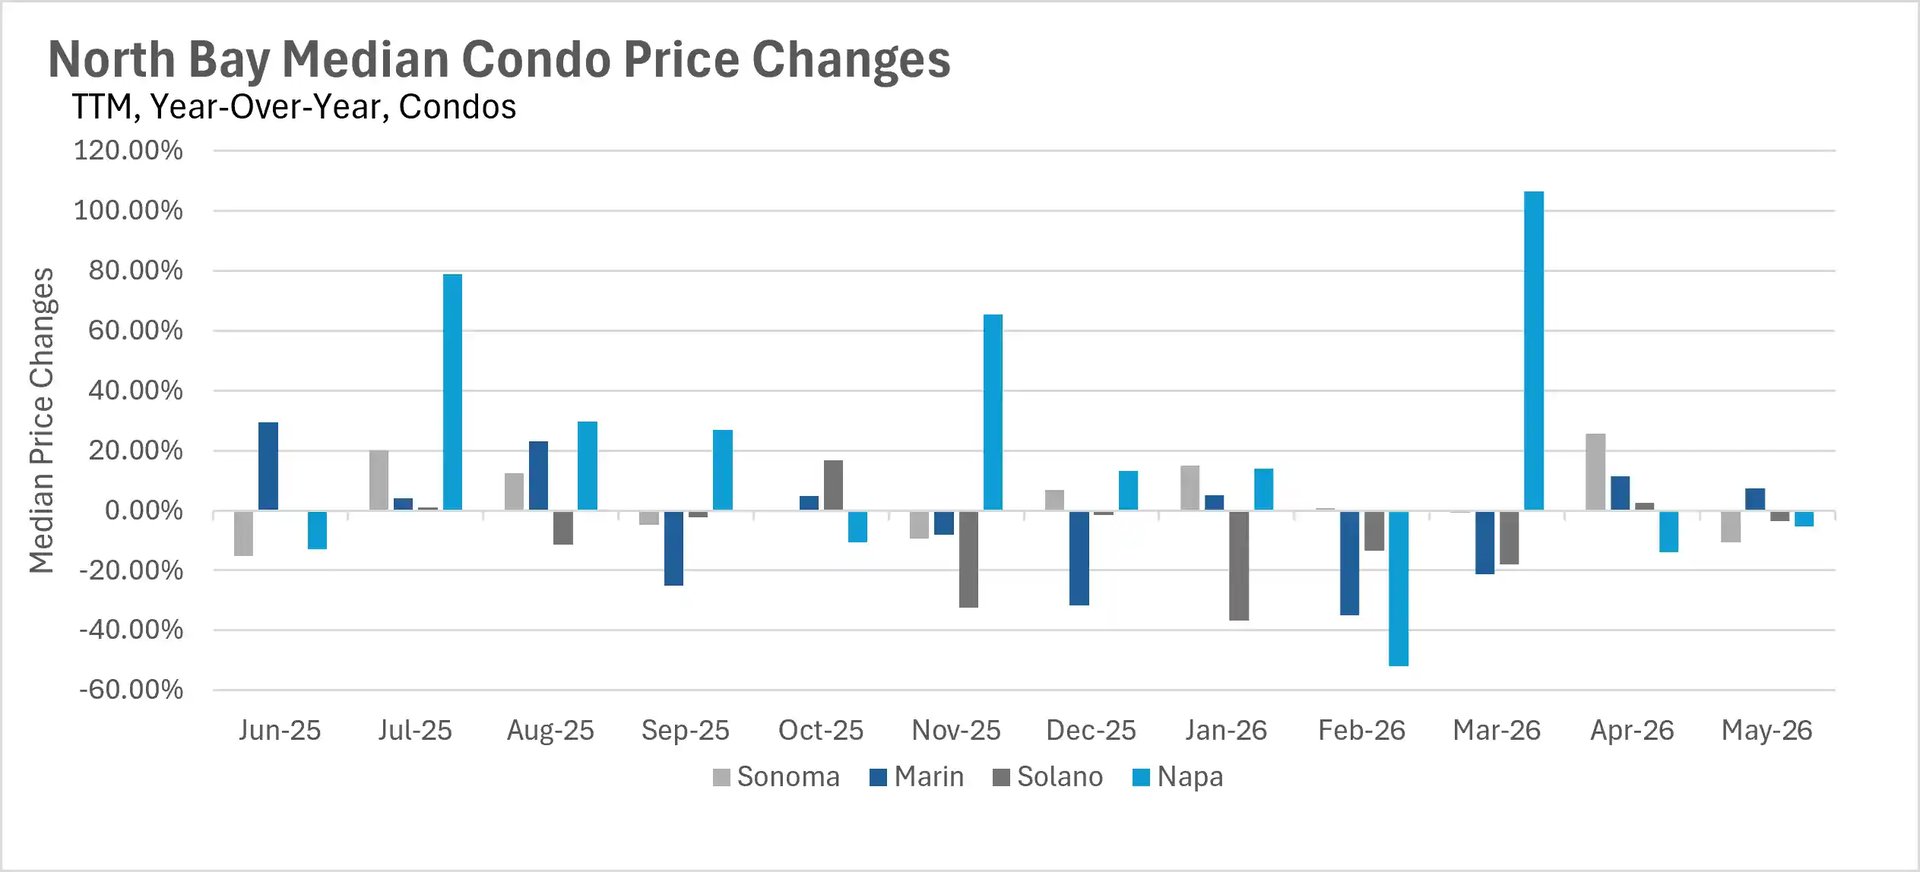
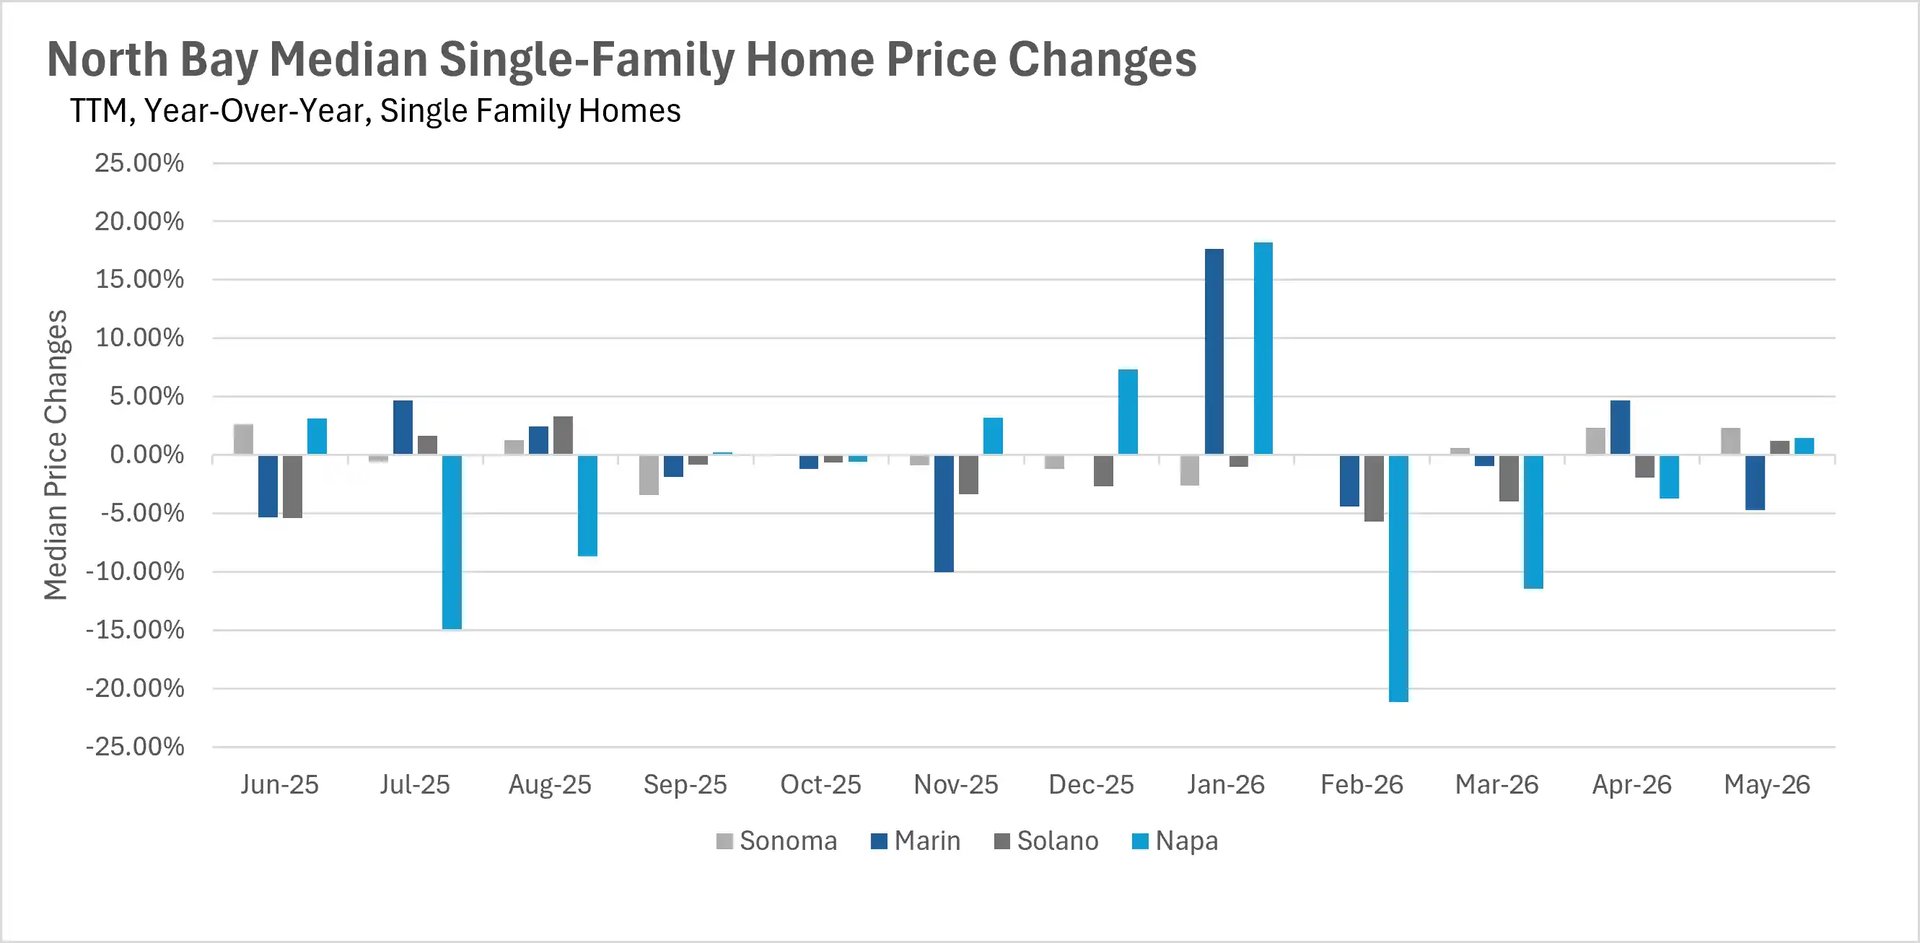
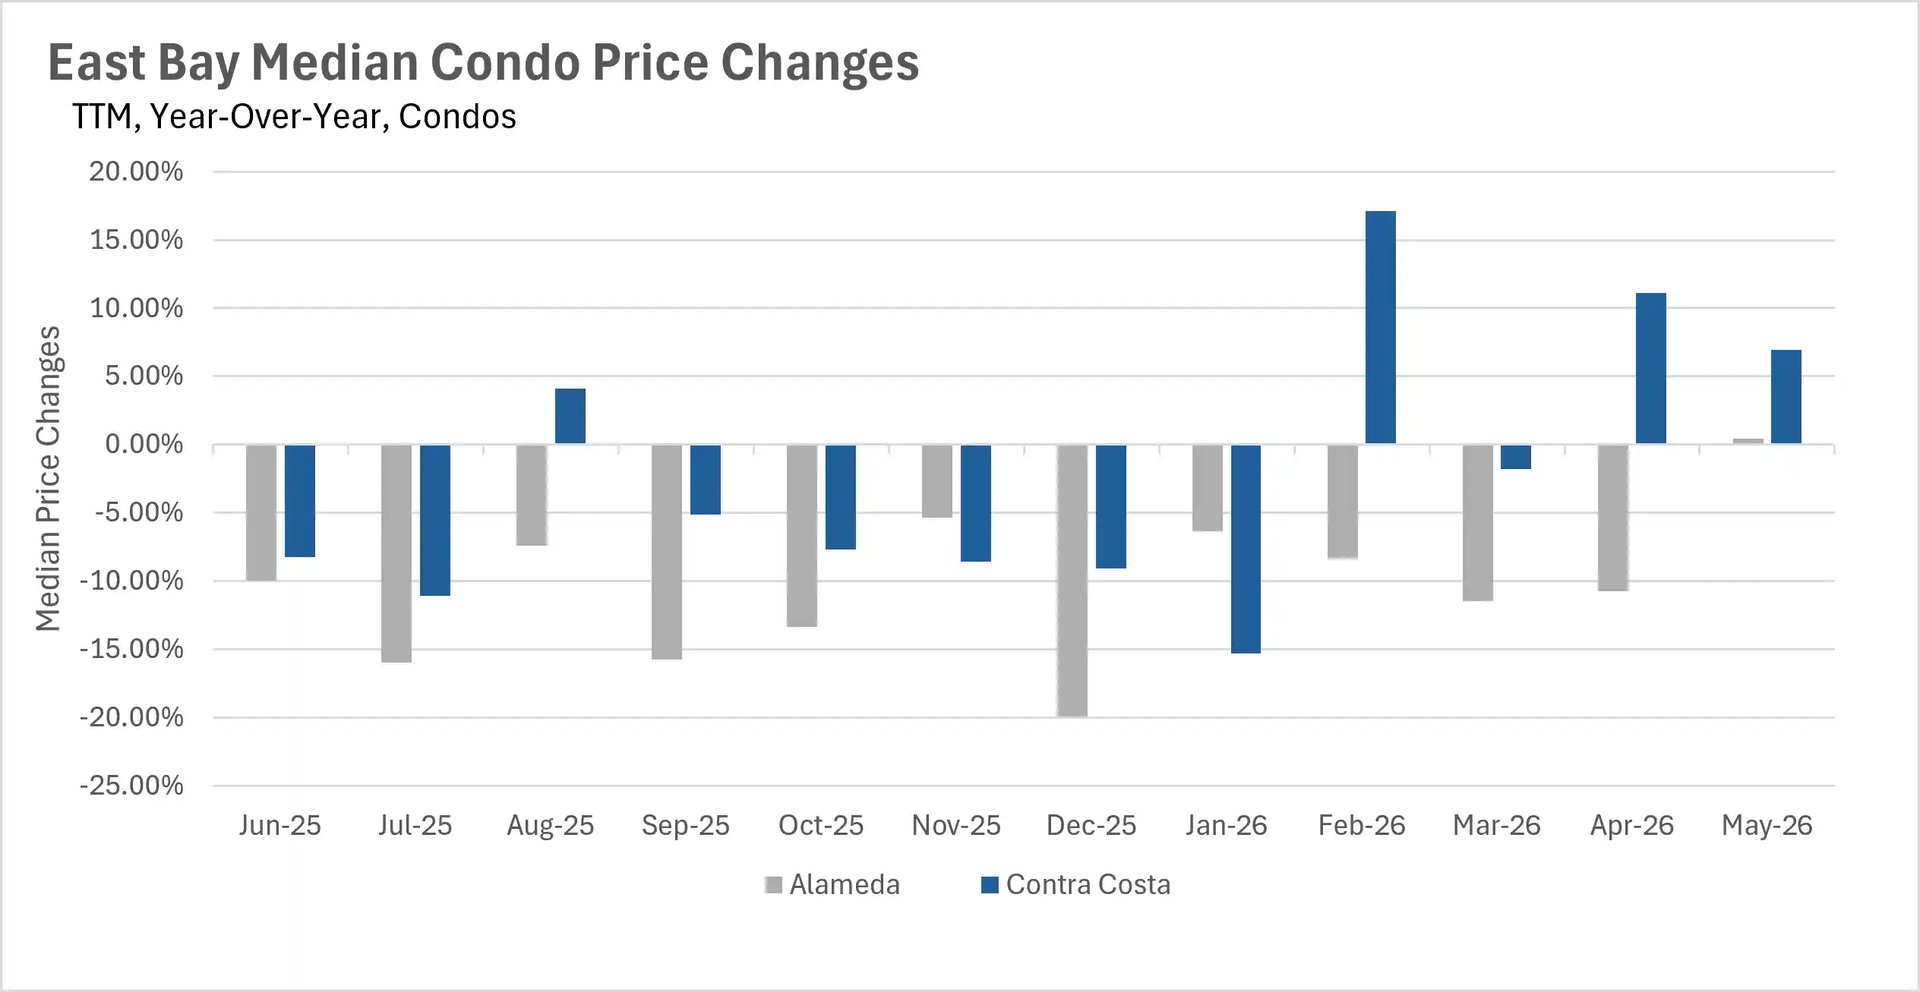
Three of the four North Bay counties also saw gains, with Sonoma County up 2.33%, Napa County up 1.47%, and Solano County up 1.19%, though Marin County declined 4.70%. On the condo side, the East Bay stood out as both counties posted positive year-over-year growth for the first time in quite some time. Silicon Valley's condo market was a wild card, with San Mateo County condos surging 24.06% and Santa Cruz County condos skyrocketing 36.51%, while Santa Clara County condos continued to decline by 8.85%.

Inventory has reached critically low levels across the Bay Area

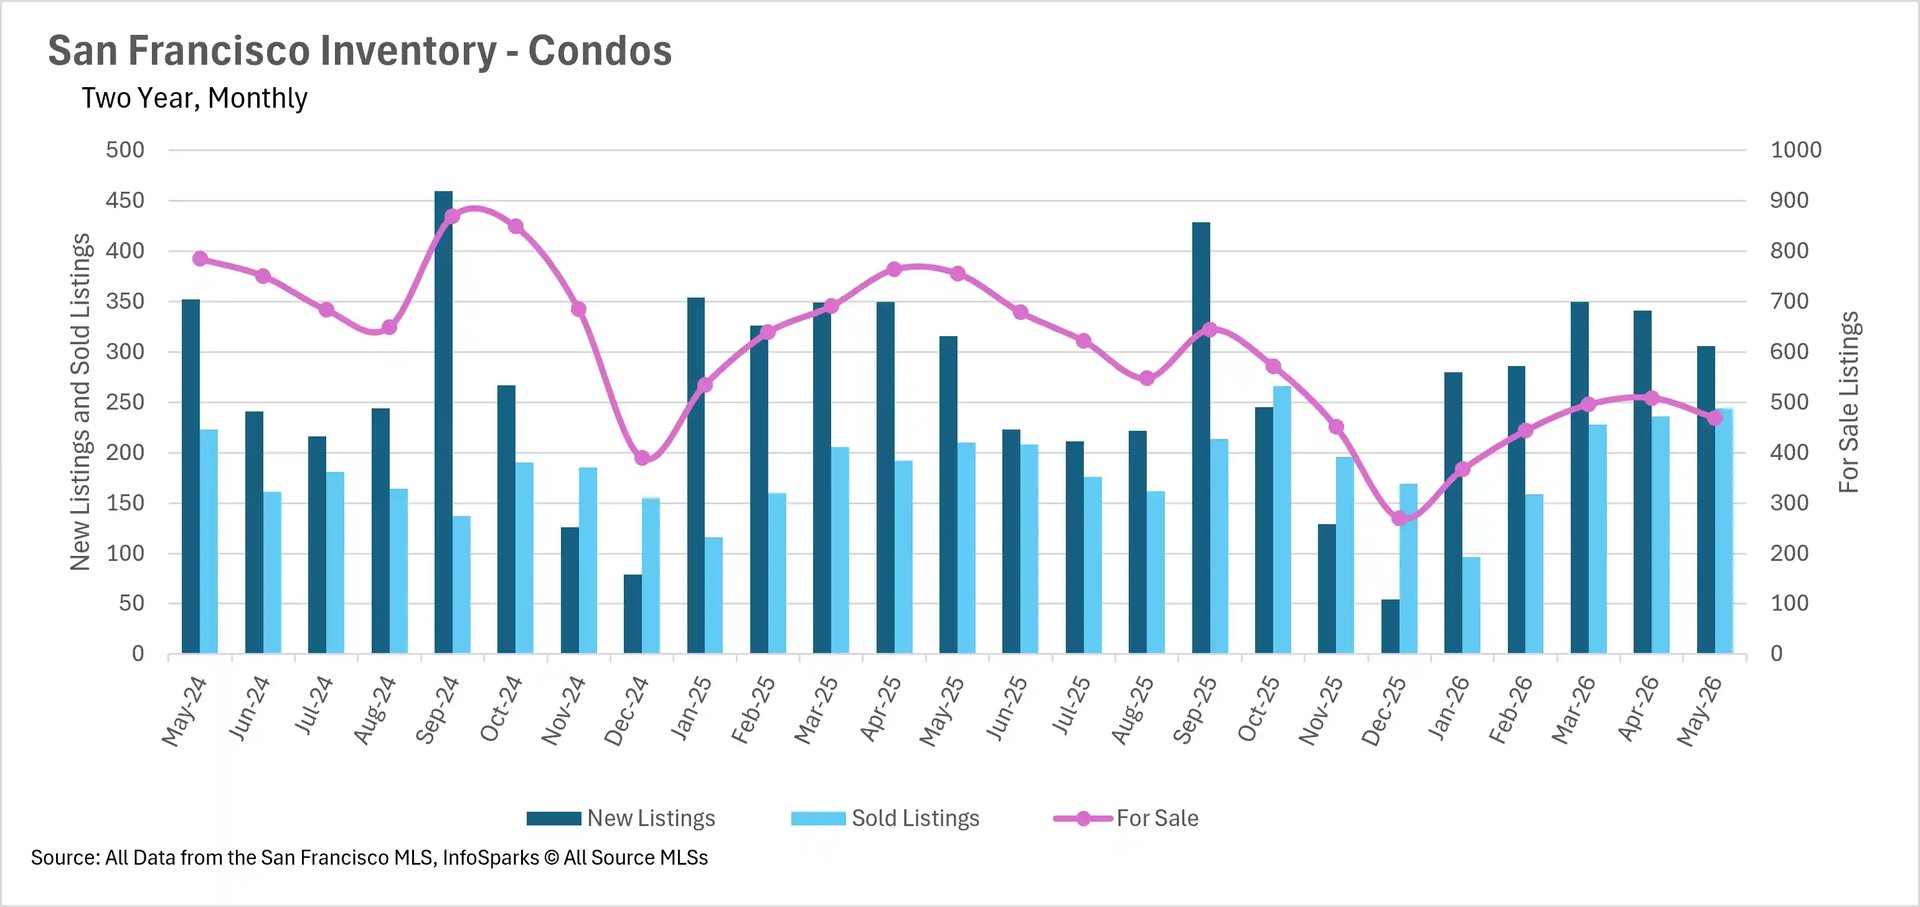
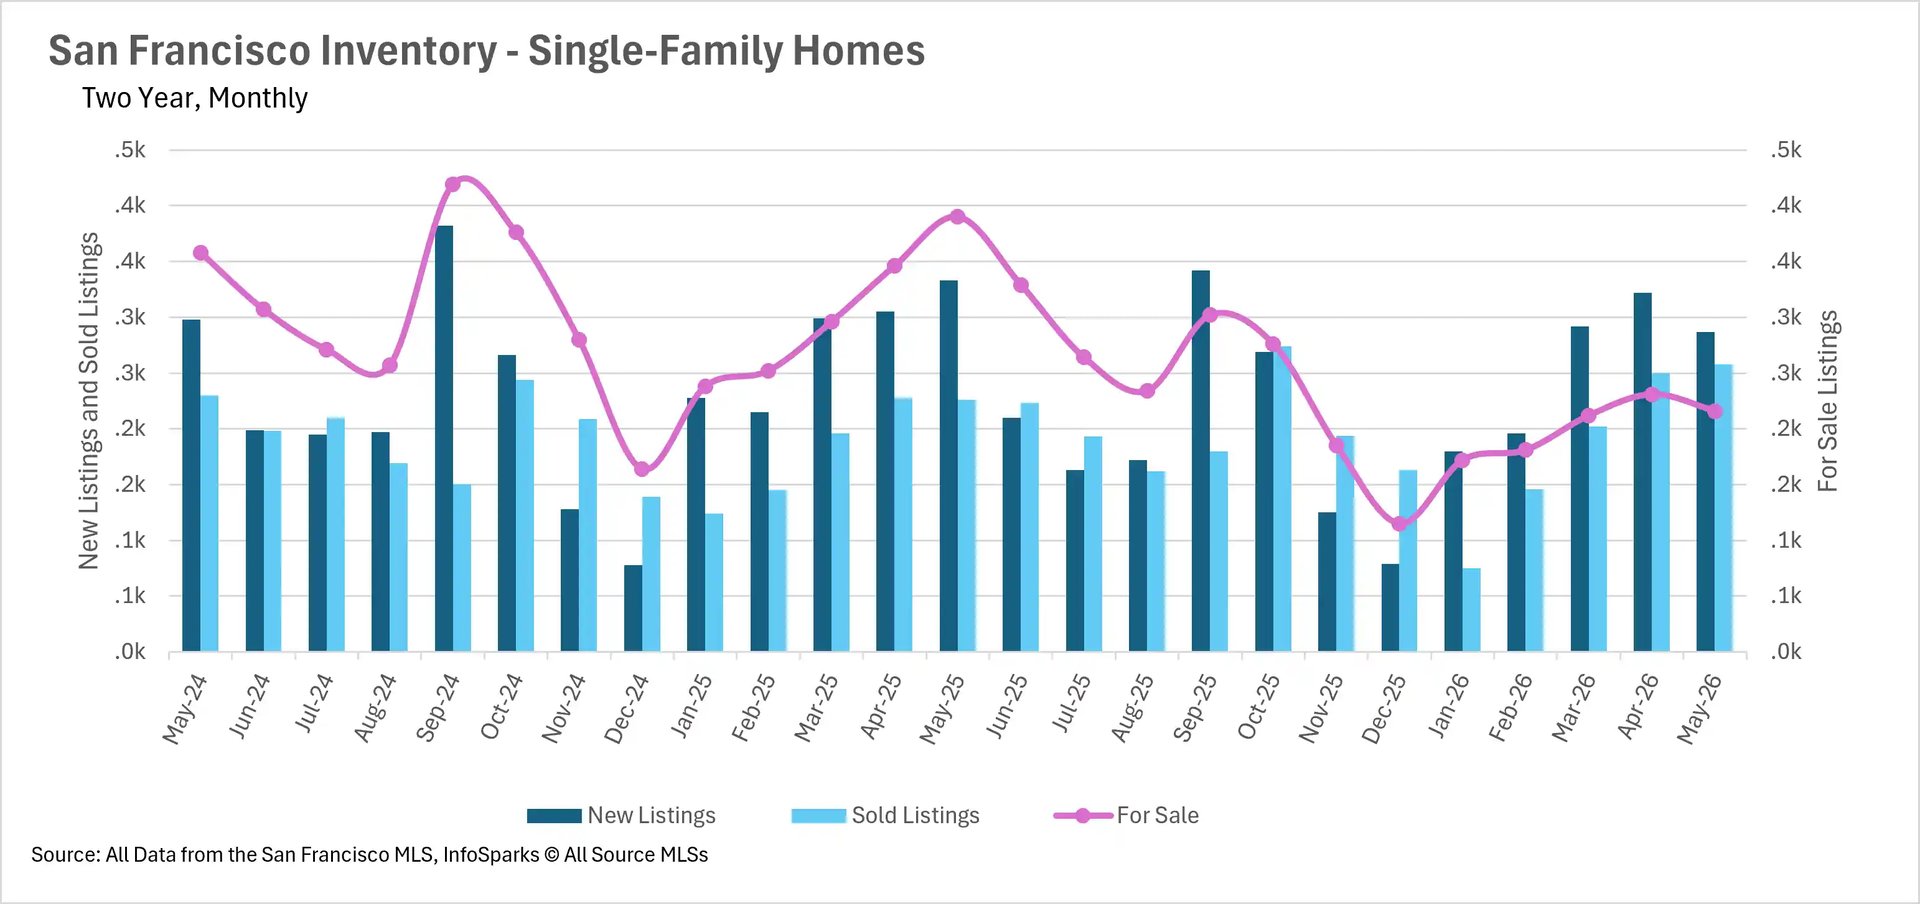
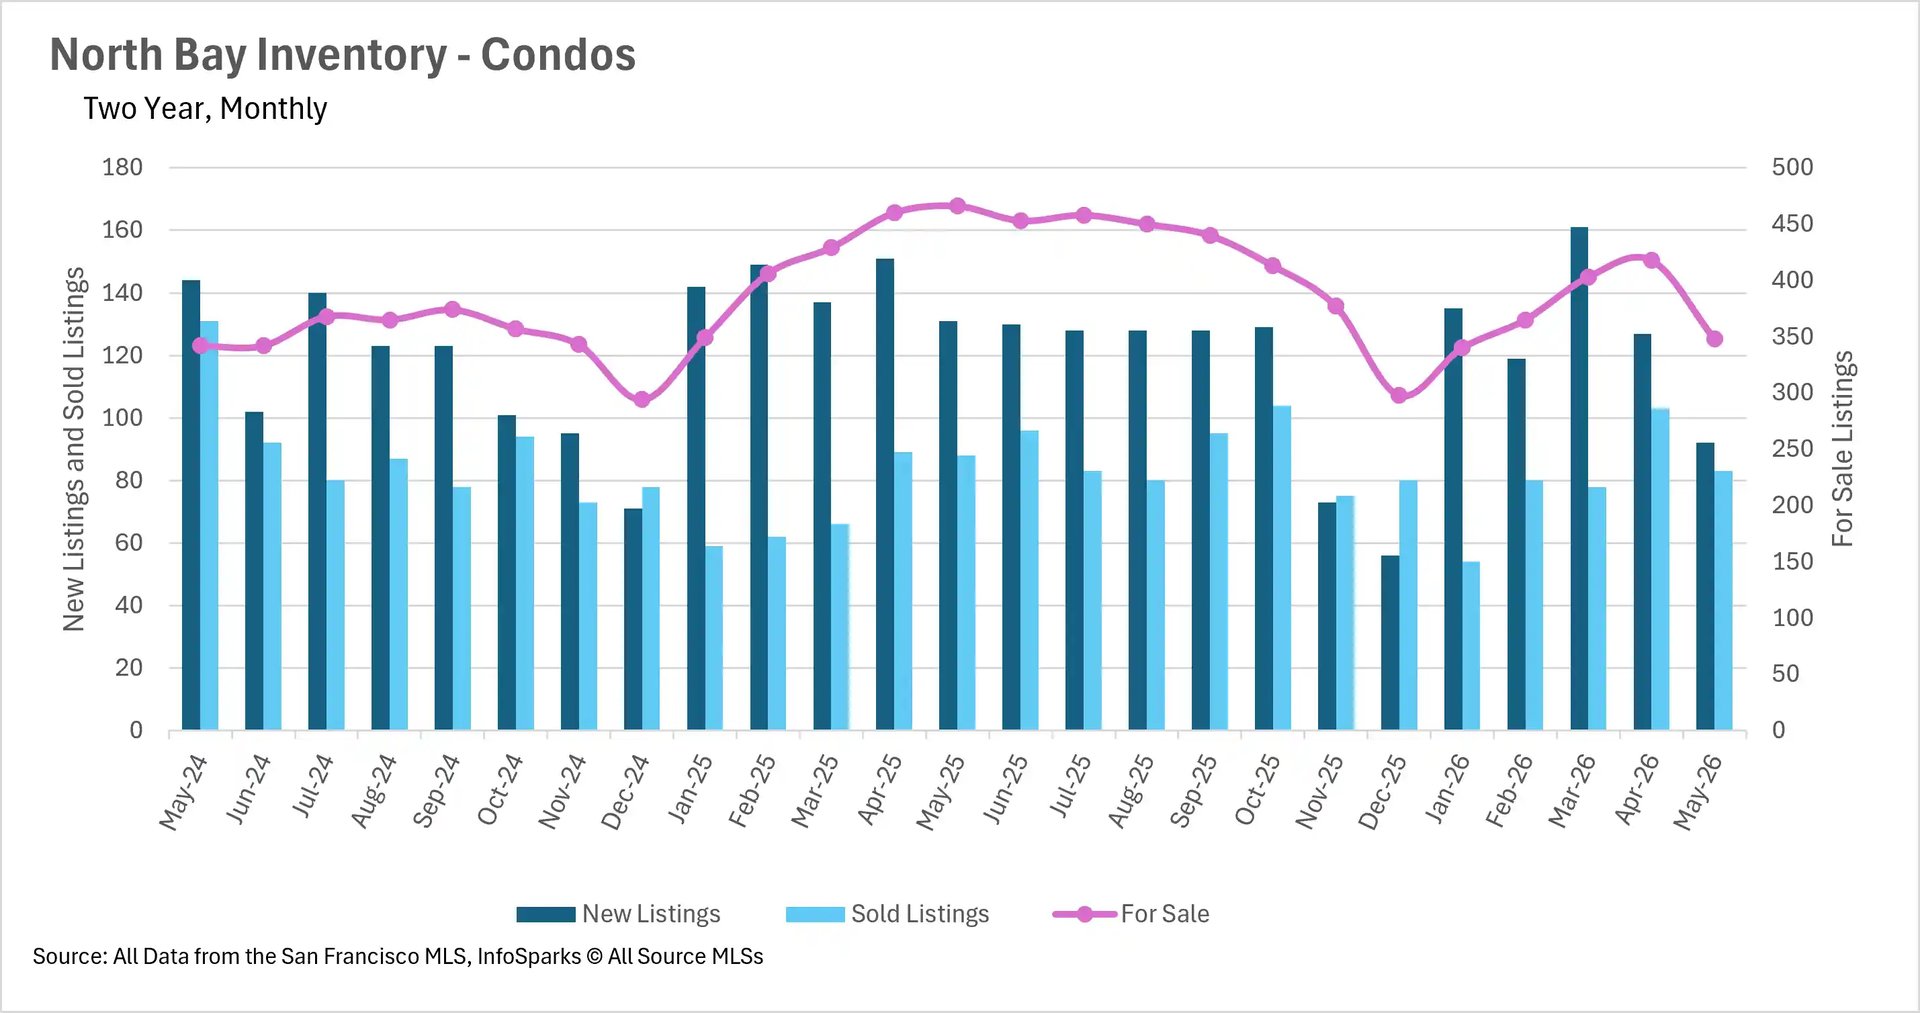
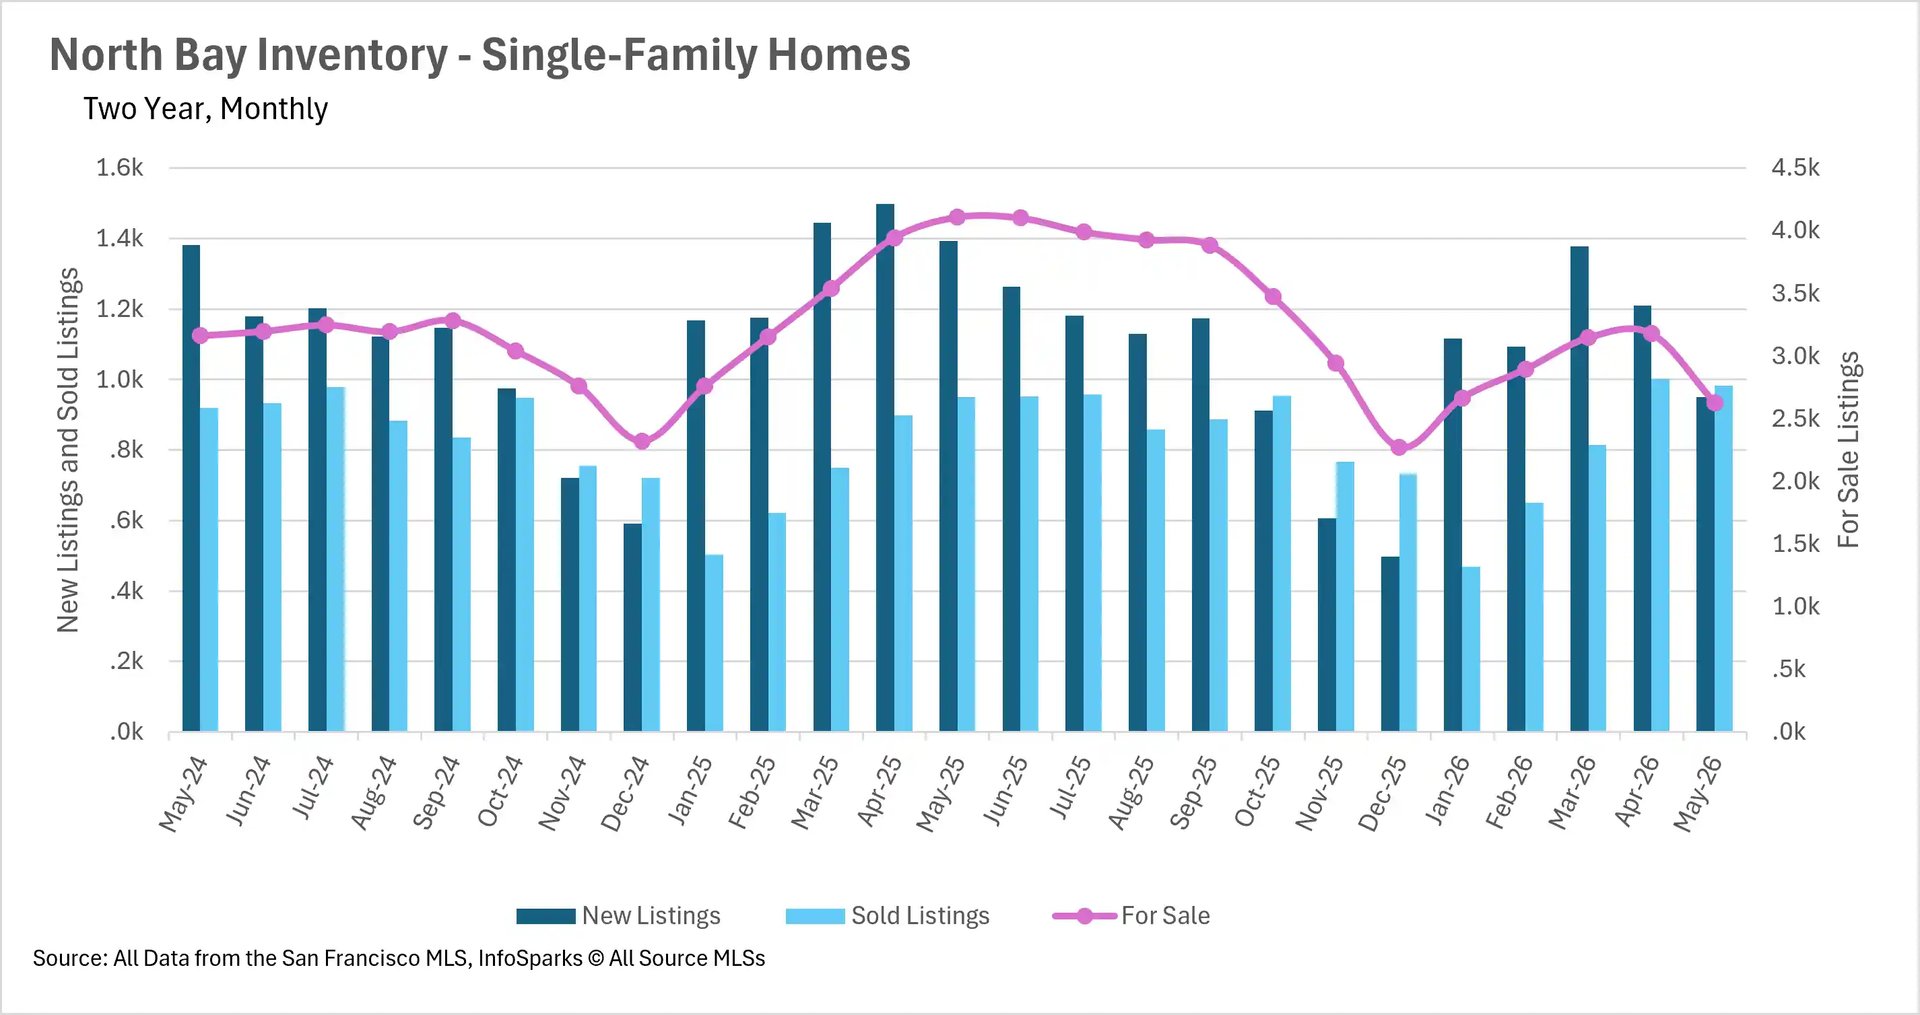
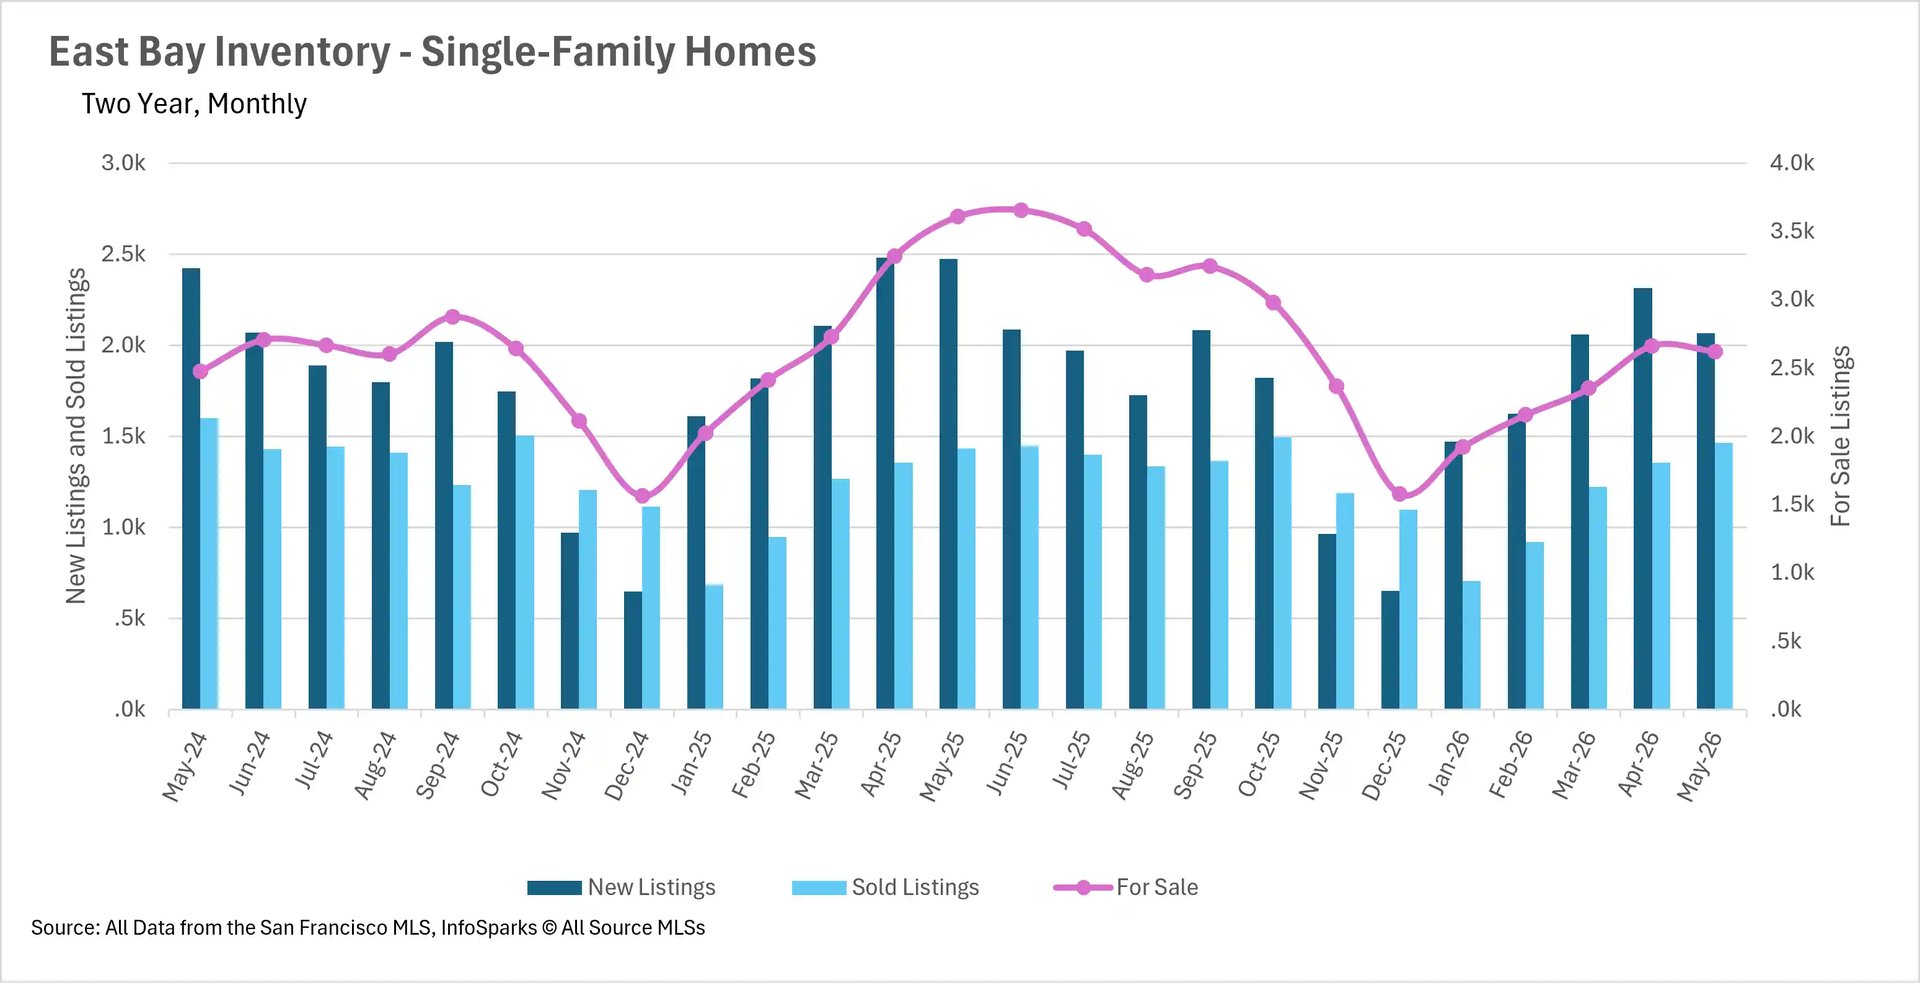
The inventory shortage that has defined the Bay Area market throughout 2026 has only intensified as we move into the summer selling season. San Francisco is experiencing the most severe crunch, with single-family inventory down a staggering 44.62% year-over-year and condo inventory down 37.96%, leaving fewer than 700 homes available for sale in the entire city. The North Bay is also feeling the squeeze, with single-family home inventory down 36% and condo inventory down 25.32%.

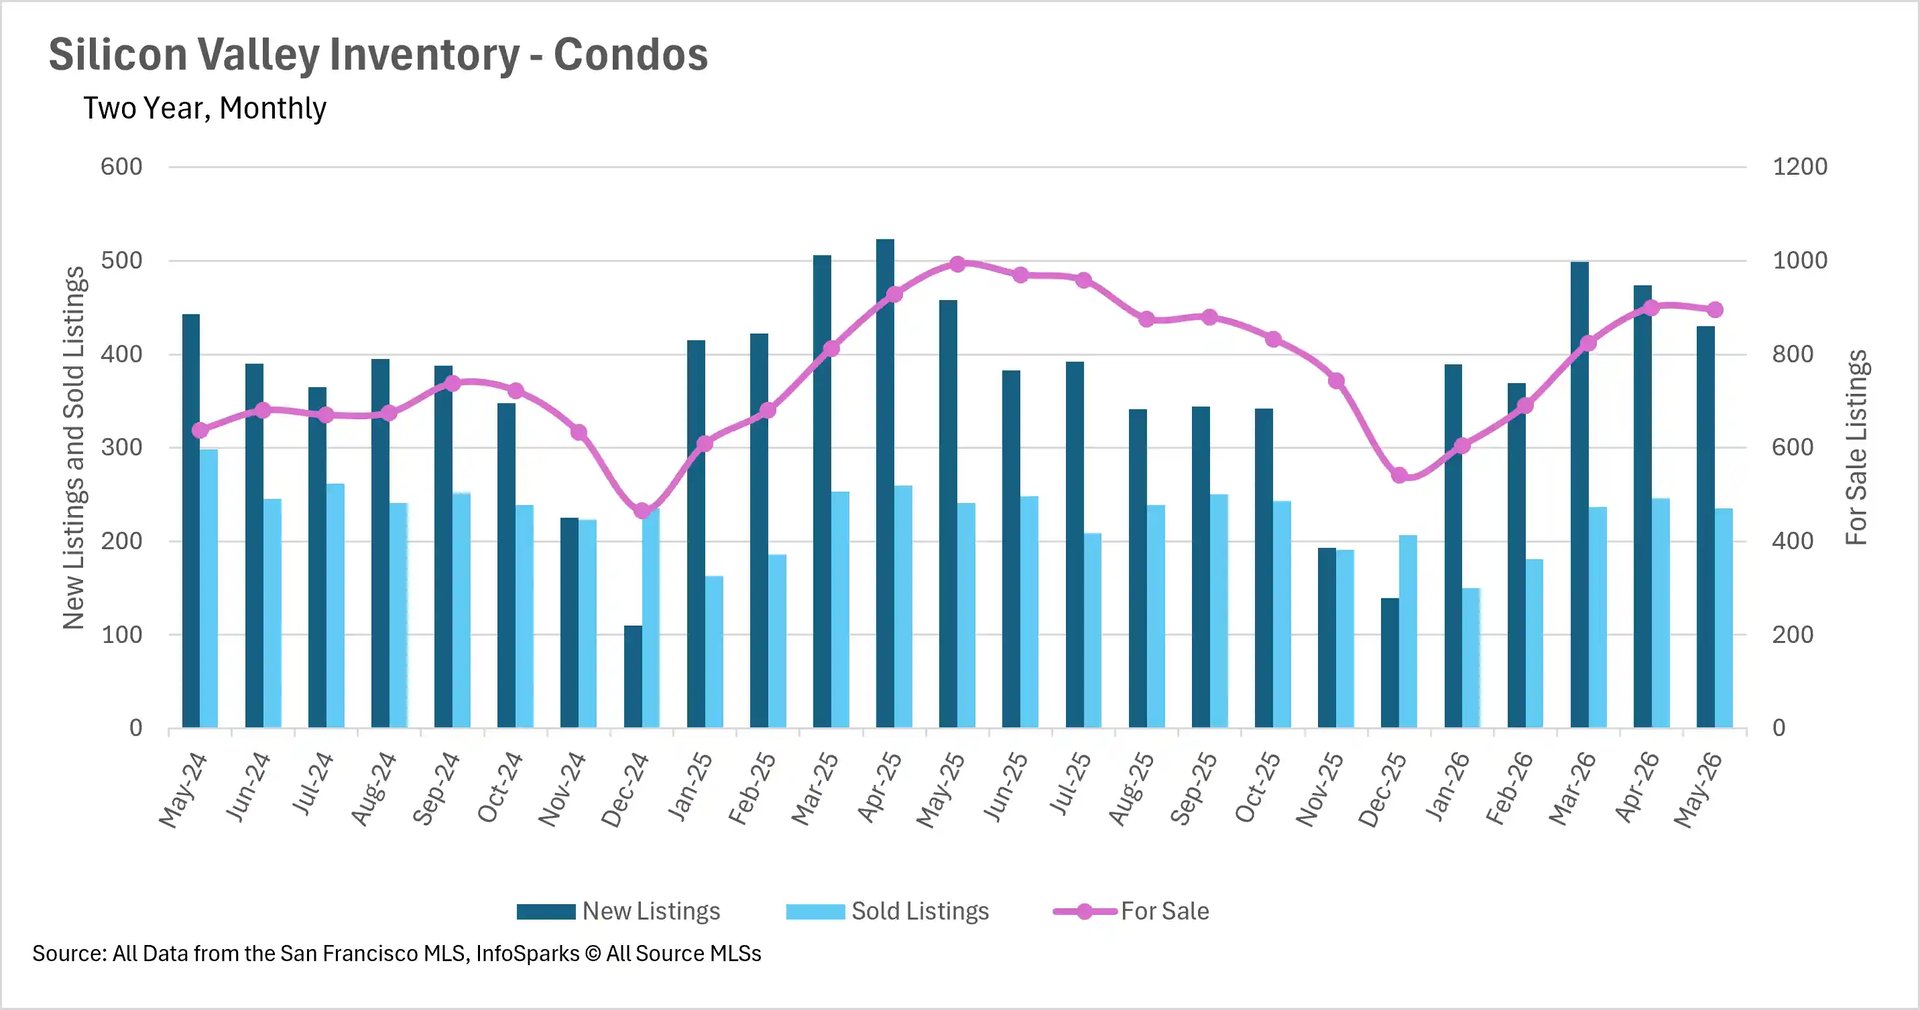
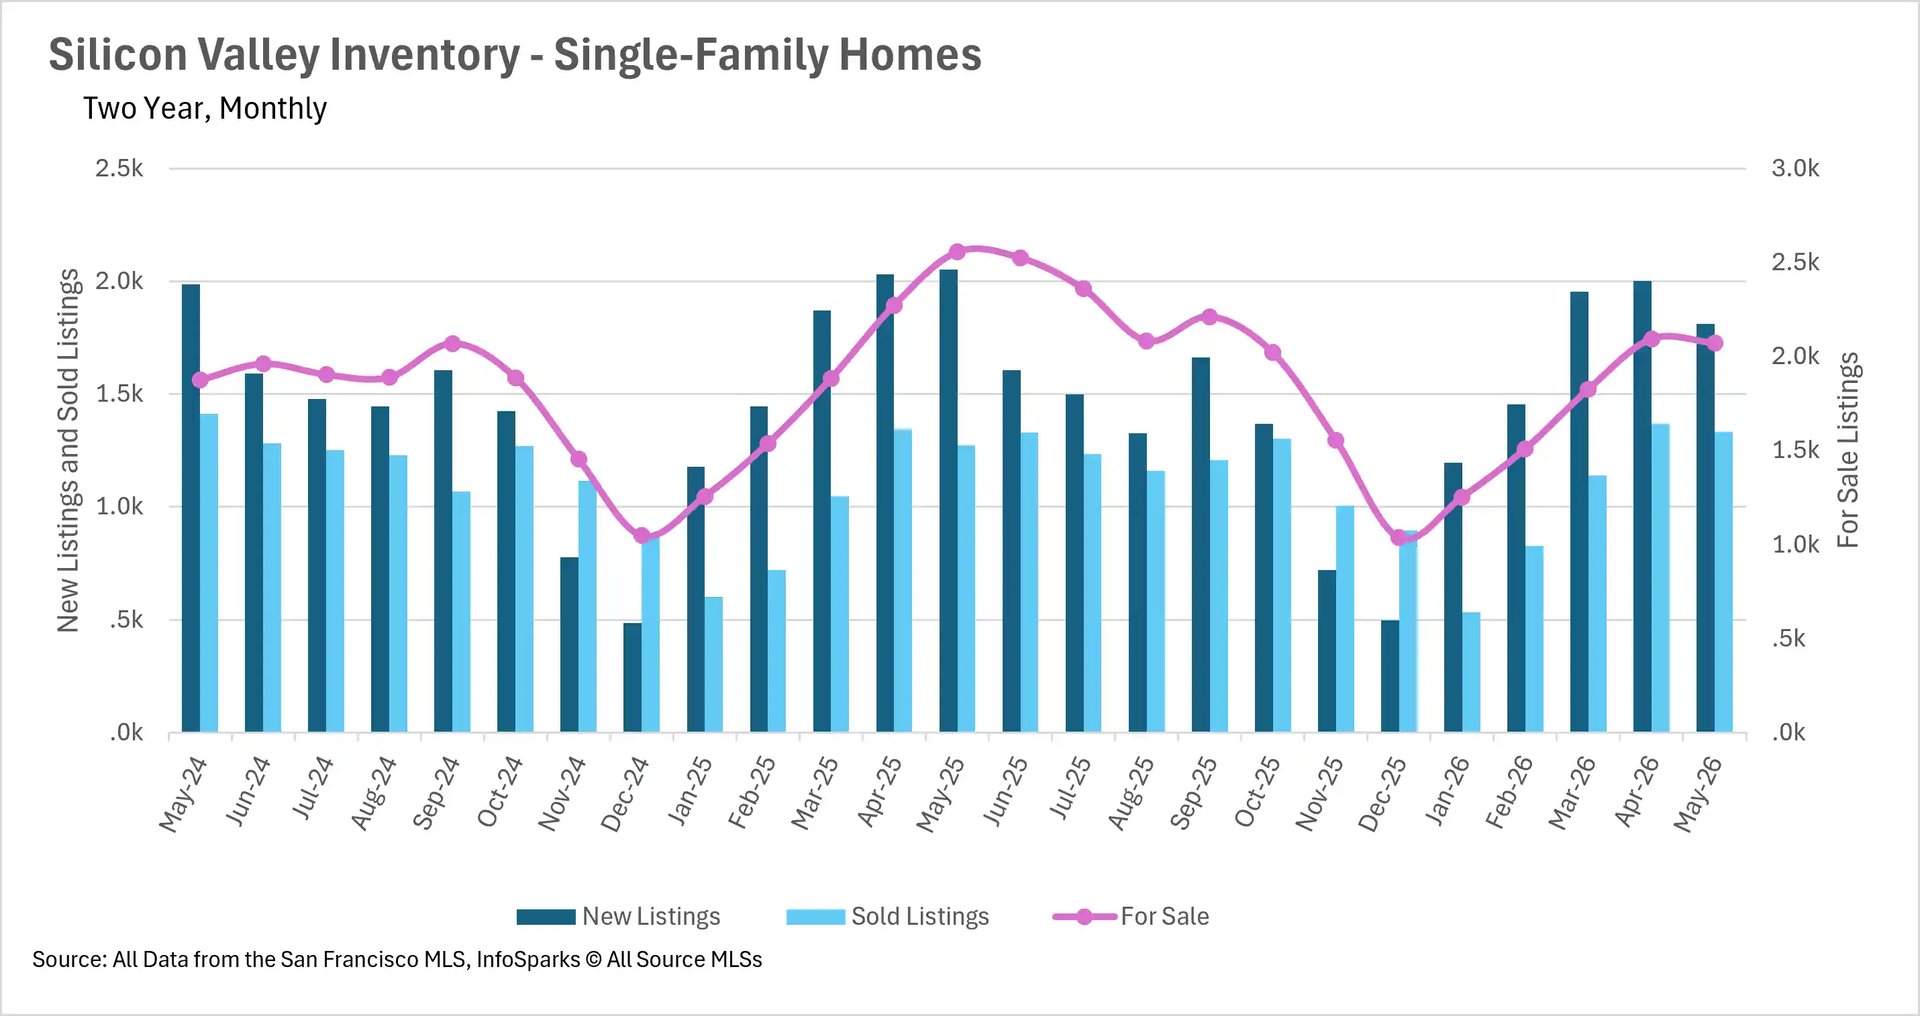
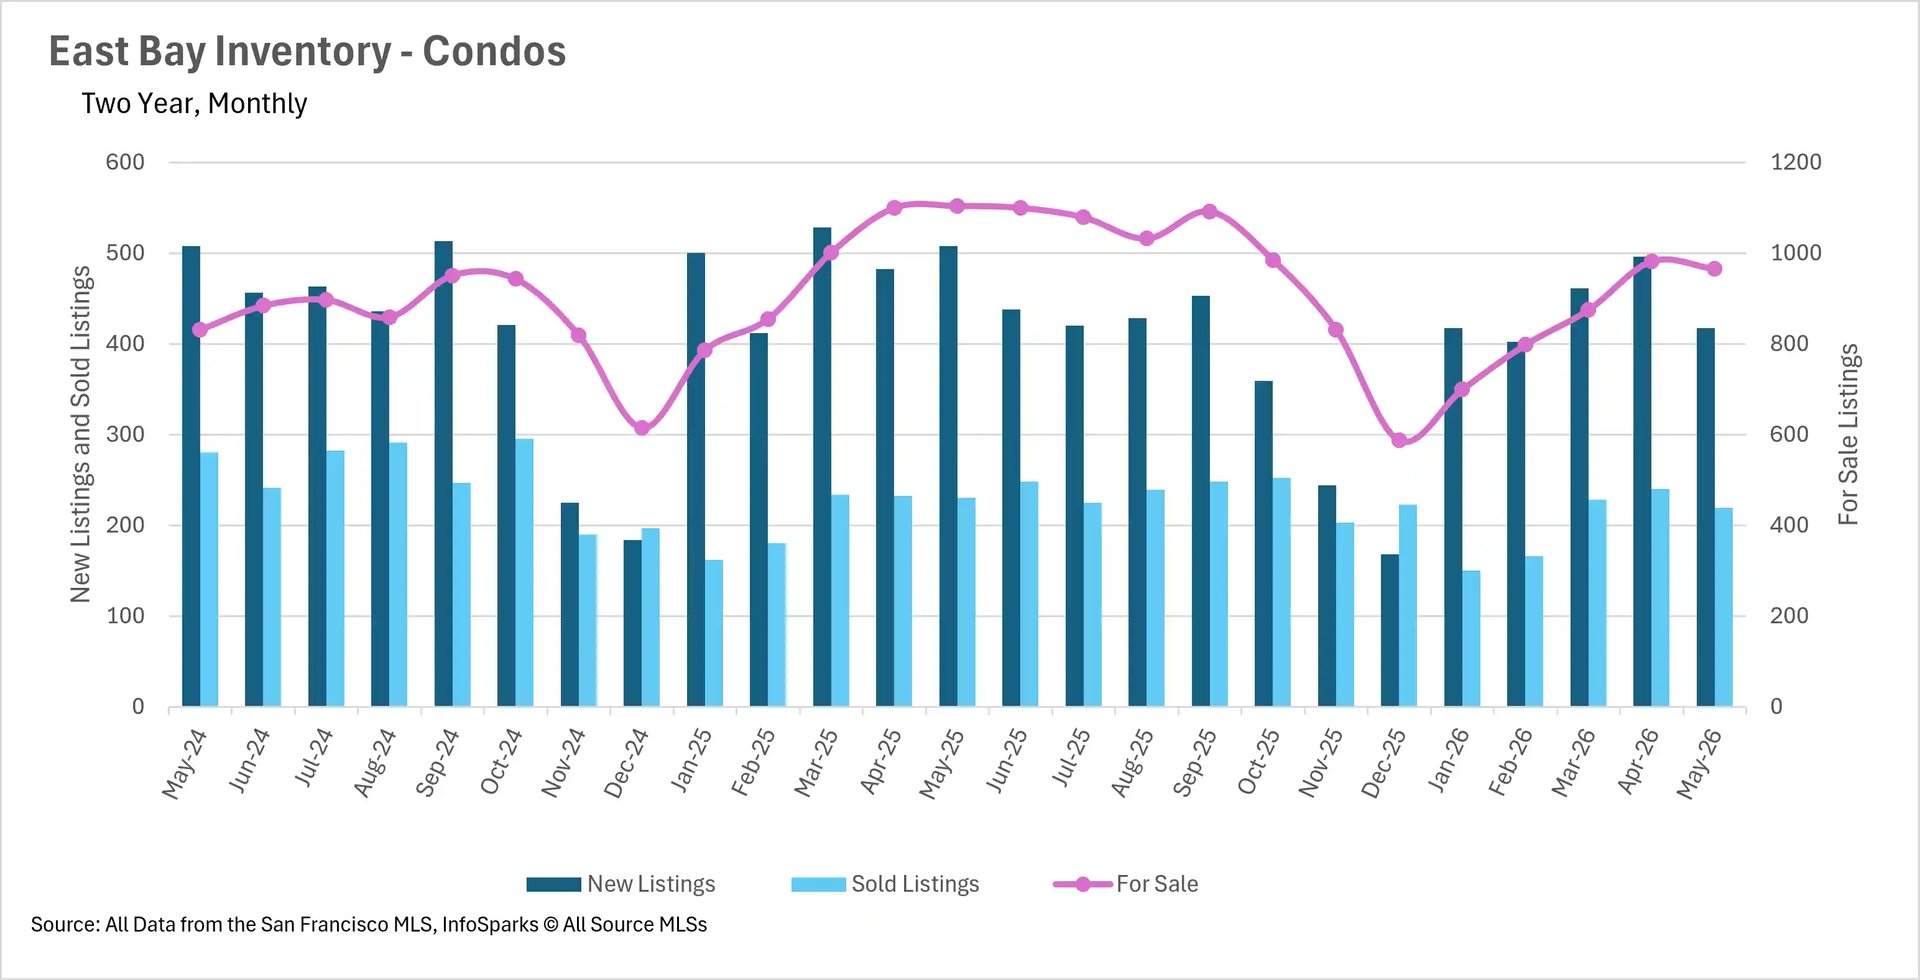
The East Bay has seen single-family inventory decline by 27.38% and condo inventory drop by 12.59%, while Silicon Valley's single-family inventory is down 18.94% and condo inventory is down 9.77%. New listings continue to trail last year's pace in most markets, with the North Bay seeing single-family new listings down 31.73% and Silicon Valley down 11.79%. On the demand side, sold listings are actually up in several markets, with Silicon Valley single-family sales up 4.47% and North Bay single-family sales up 3.37%. This combination of declining supply and steady or growing demand is the primary driver behind the price appreciation we're seeing across much of the region.

Single-family homes are selling quickly, and the condo market is picking up speed

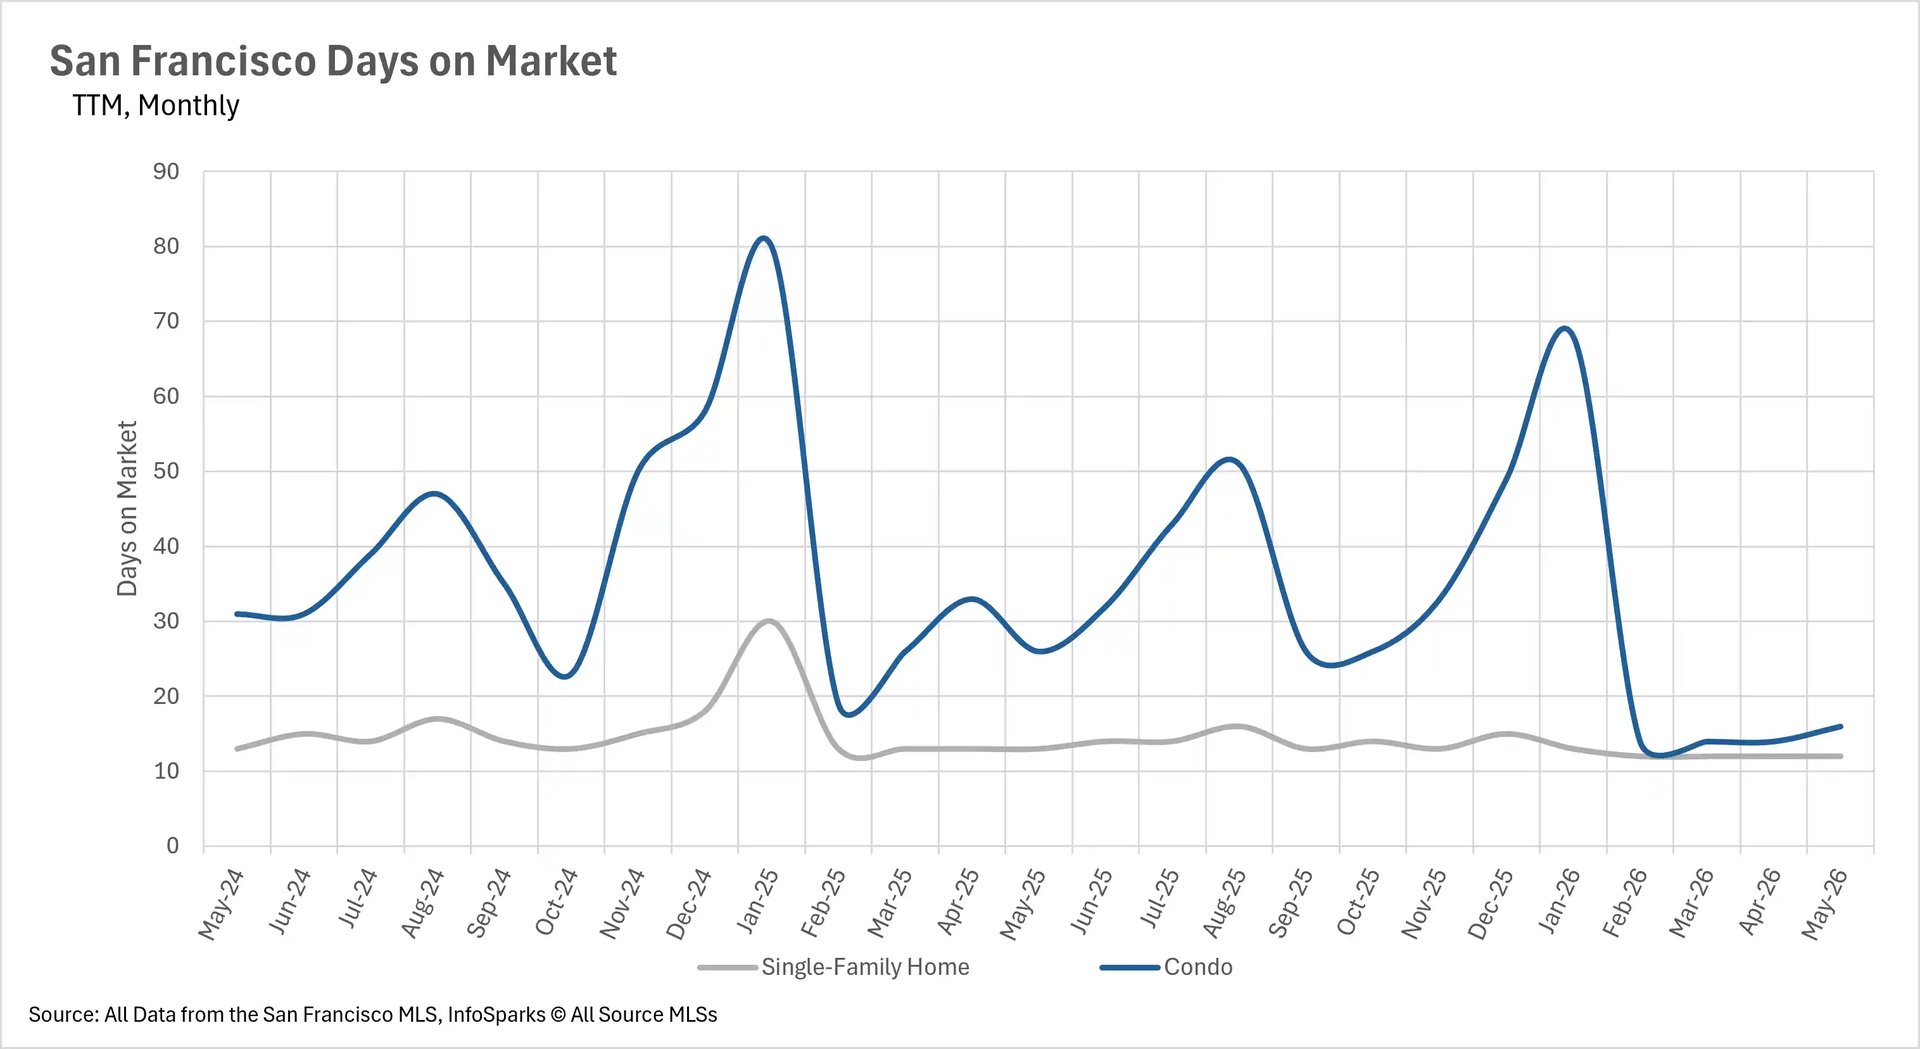
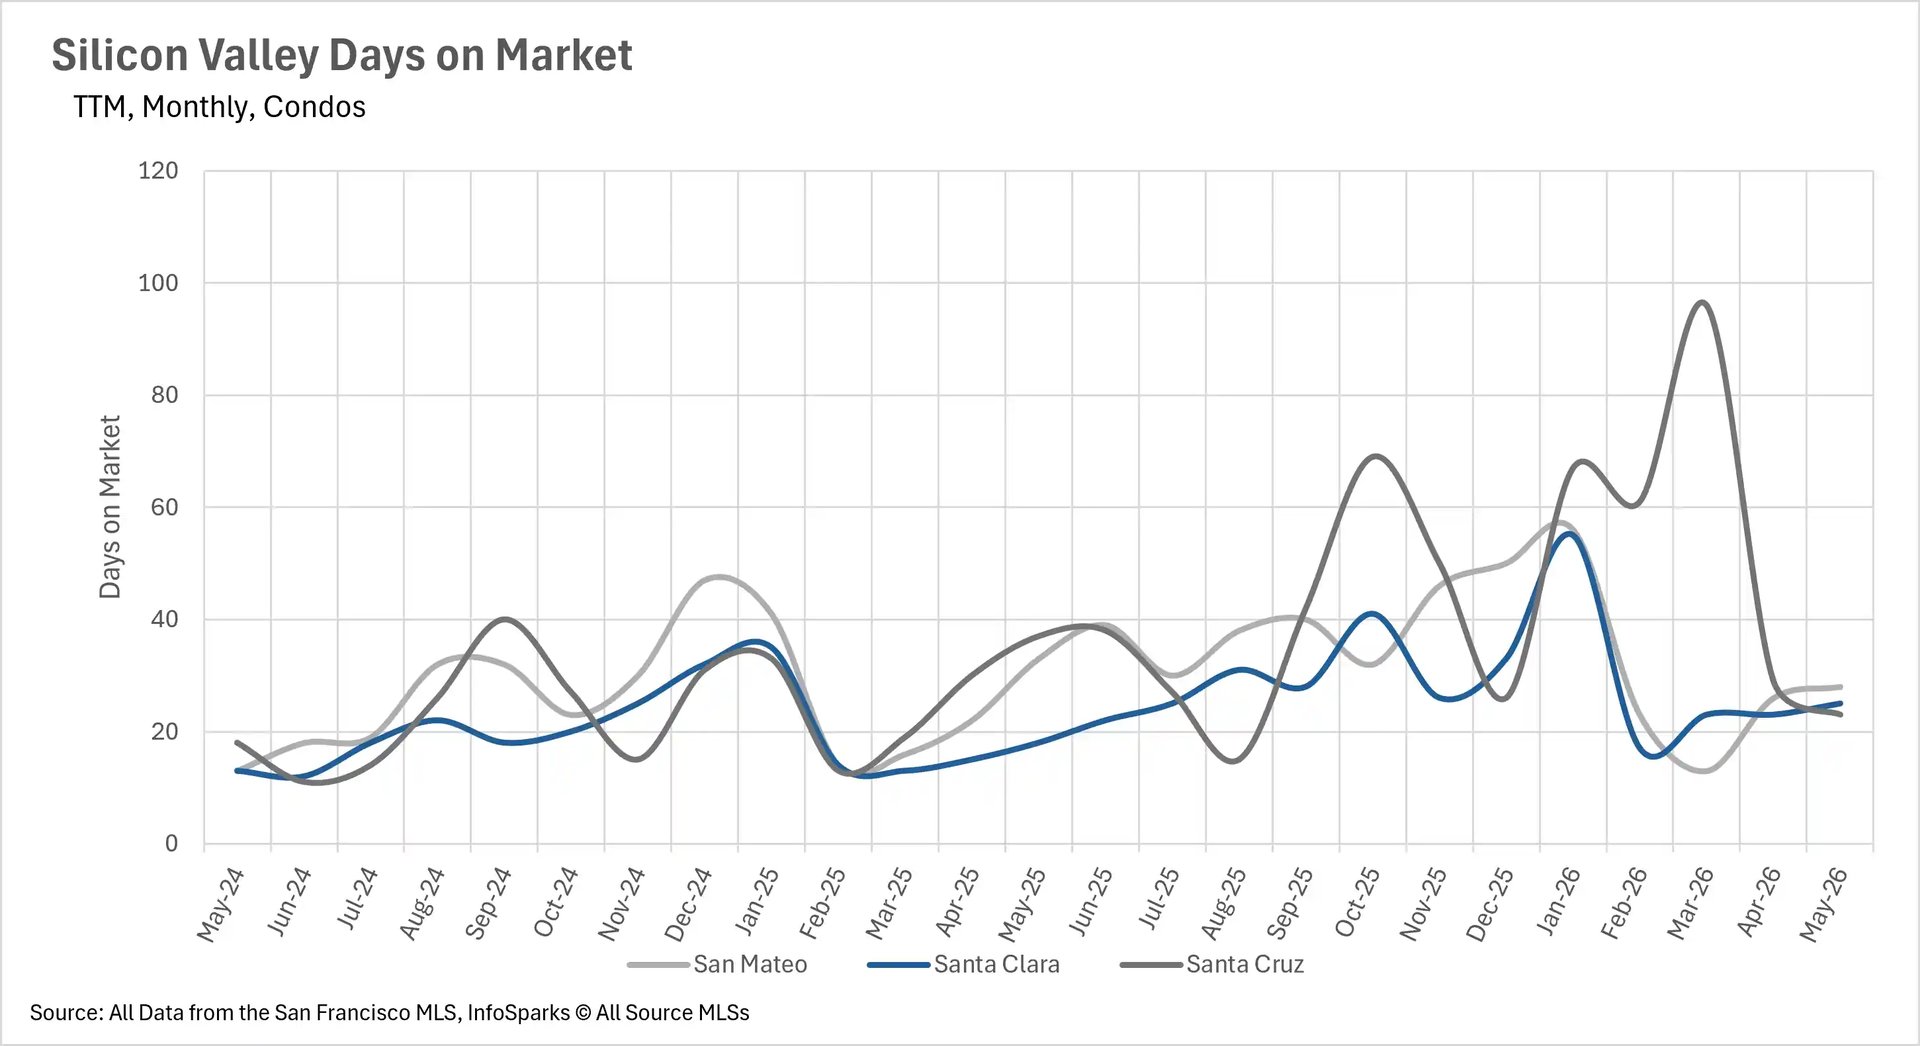
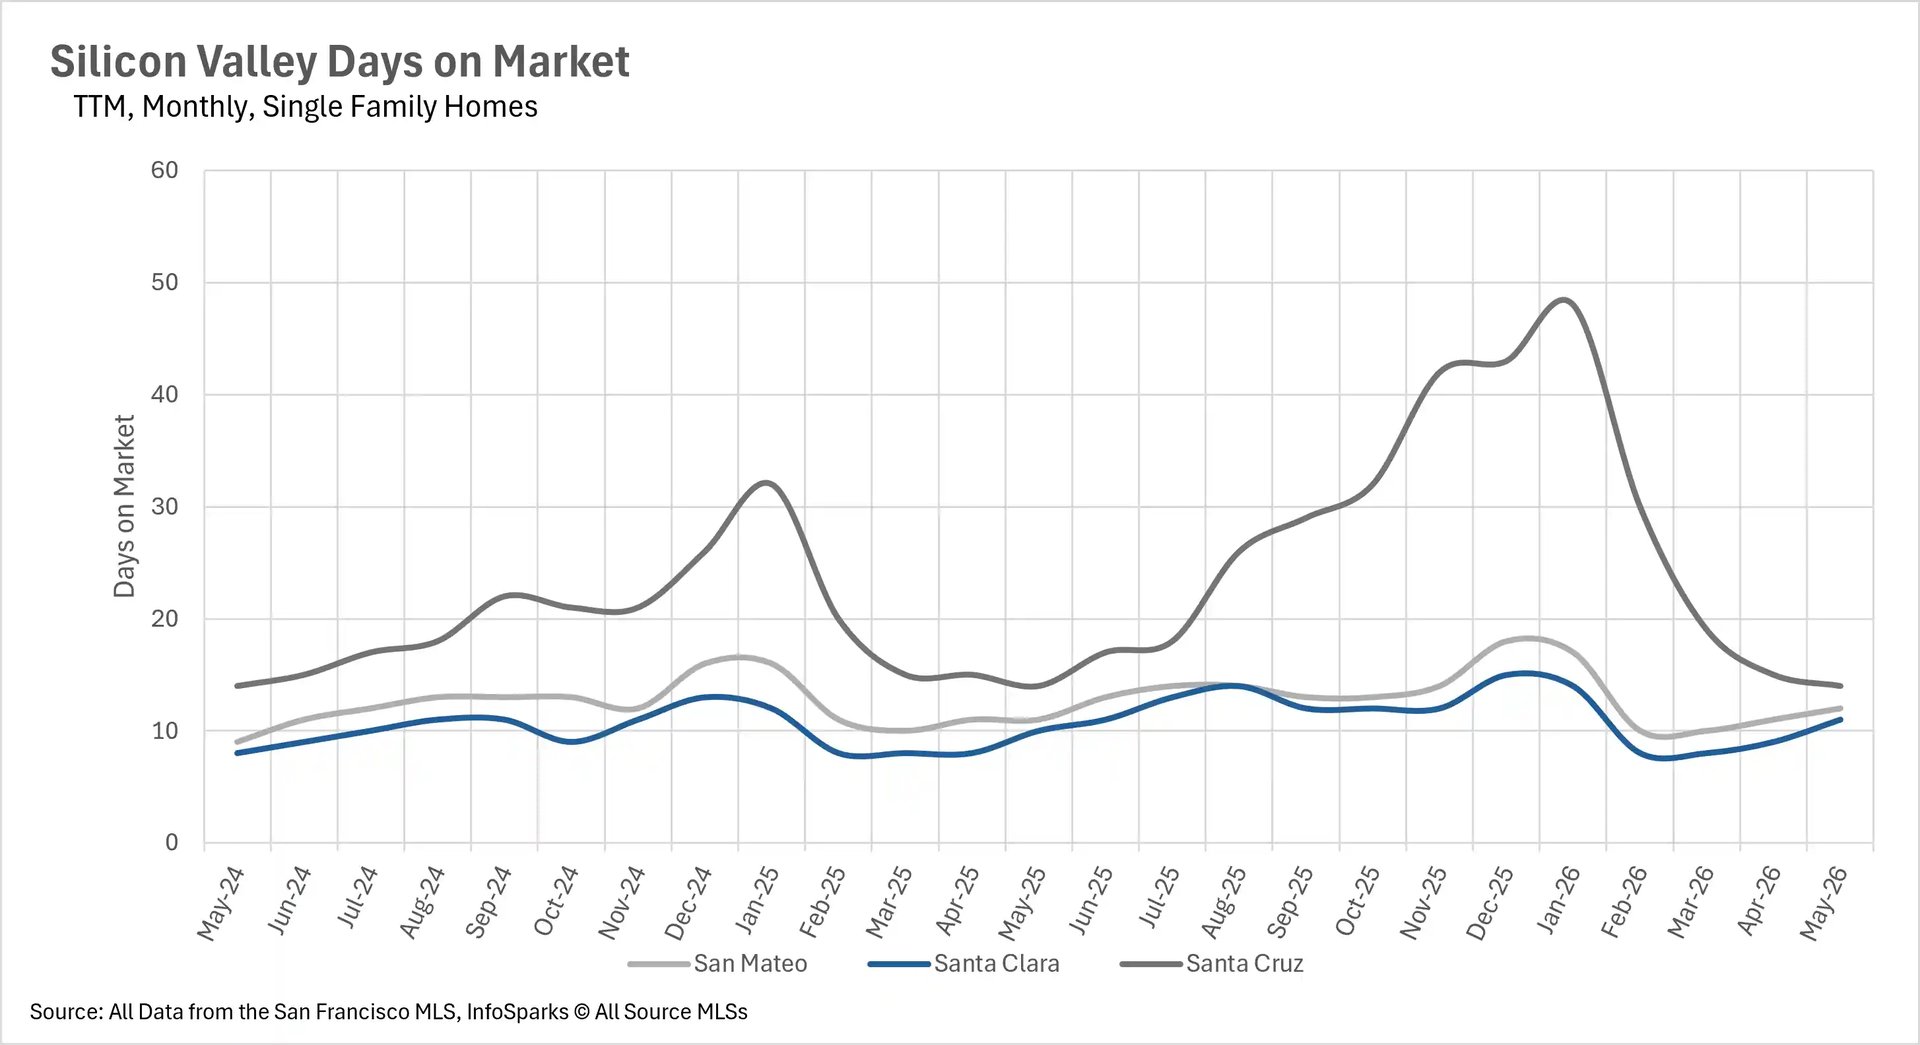
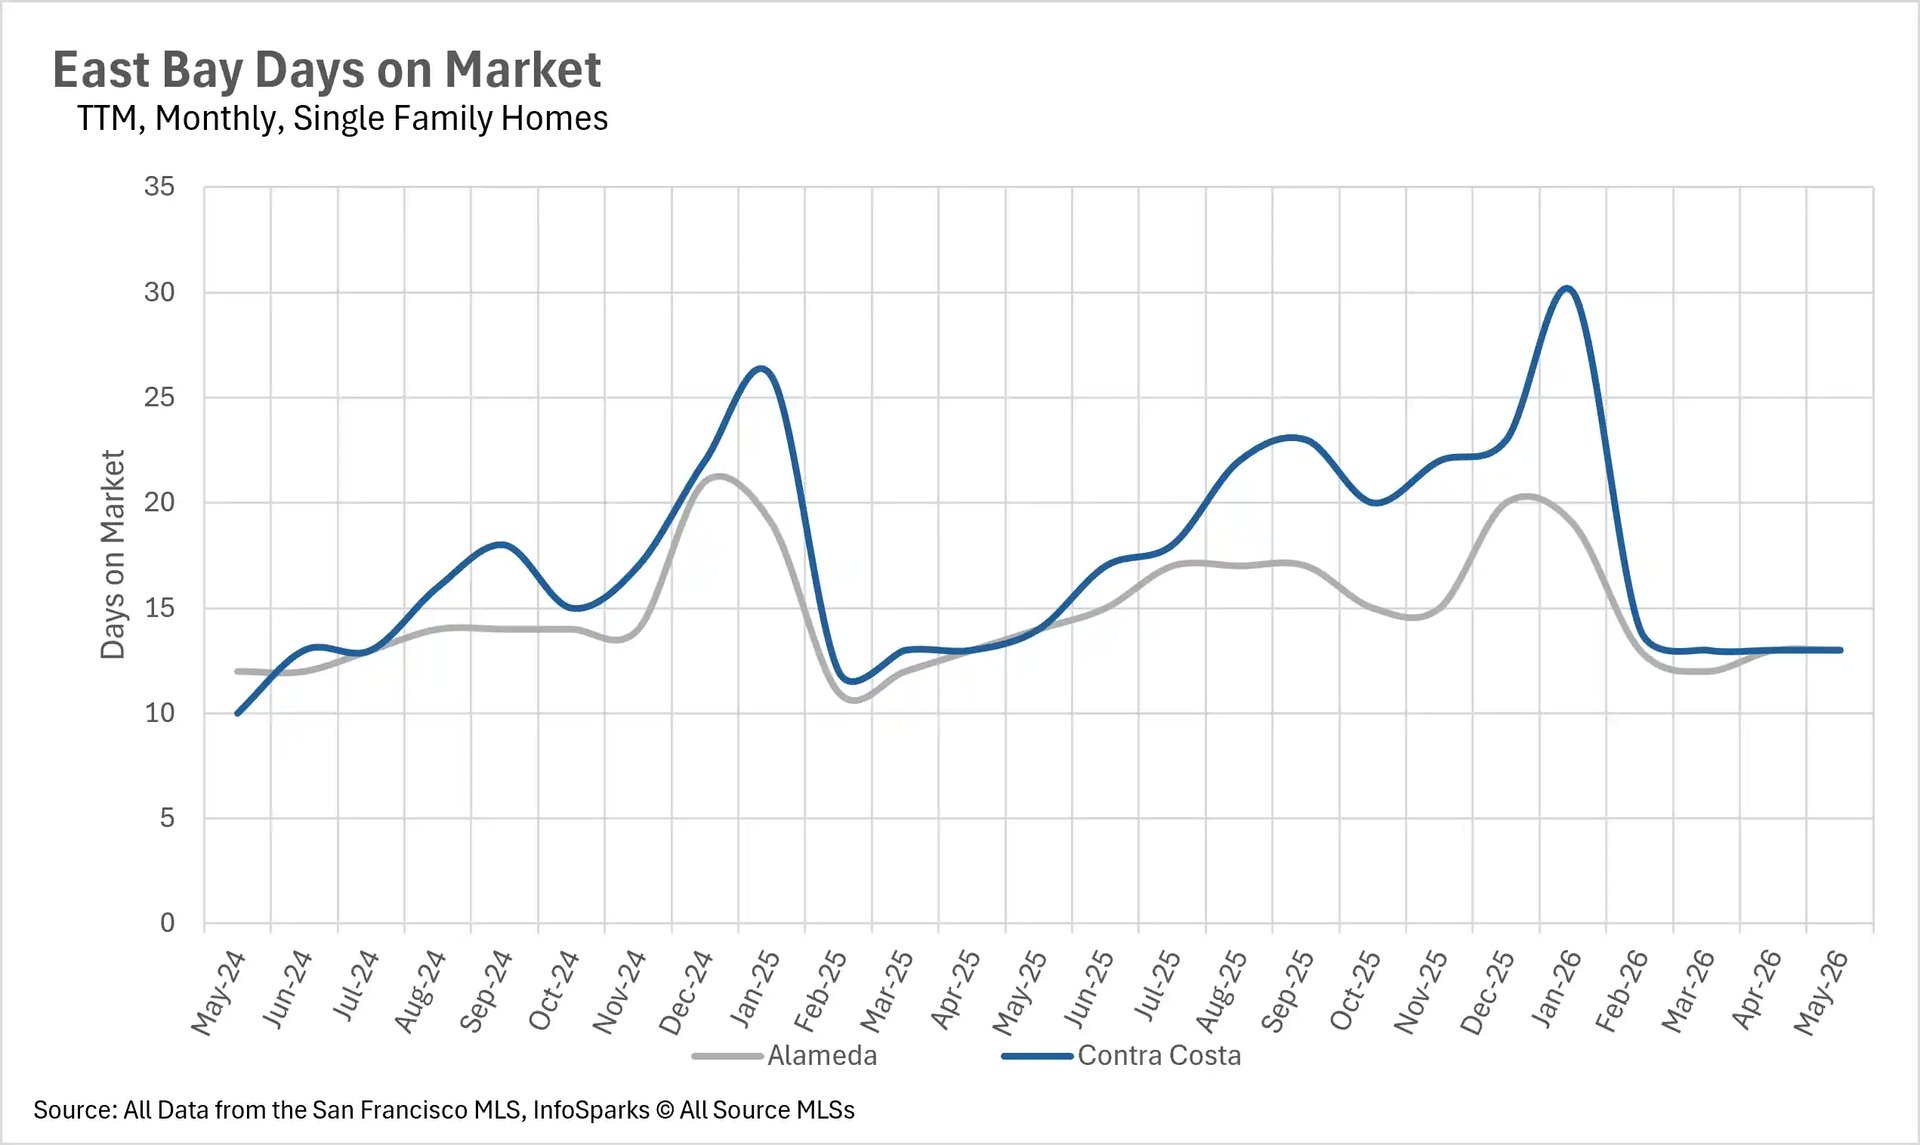
The pace of sales for single-family homes across the Bay Area remains remarkably fast as the summer selling season approaches. San Francisco single-family homes are selling in just 12 days, while Santa Clara County homes are moving in 11 days and San Mateo County homes in 12 days. In the East Bay, single-family homes in both Alameda and Contra Costa Counties are selling in just 13 days, a 7.14% improvement compared to last year.

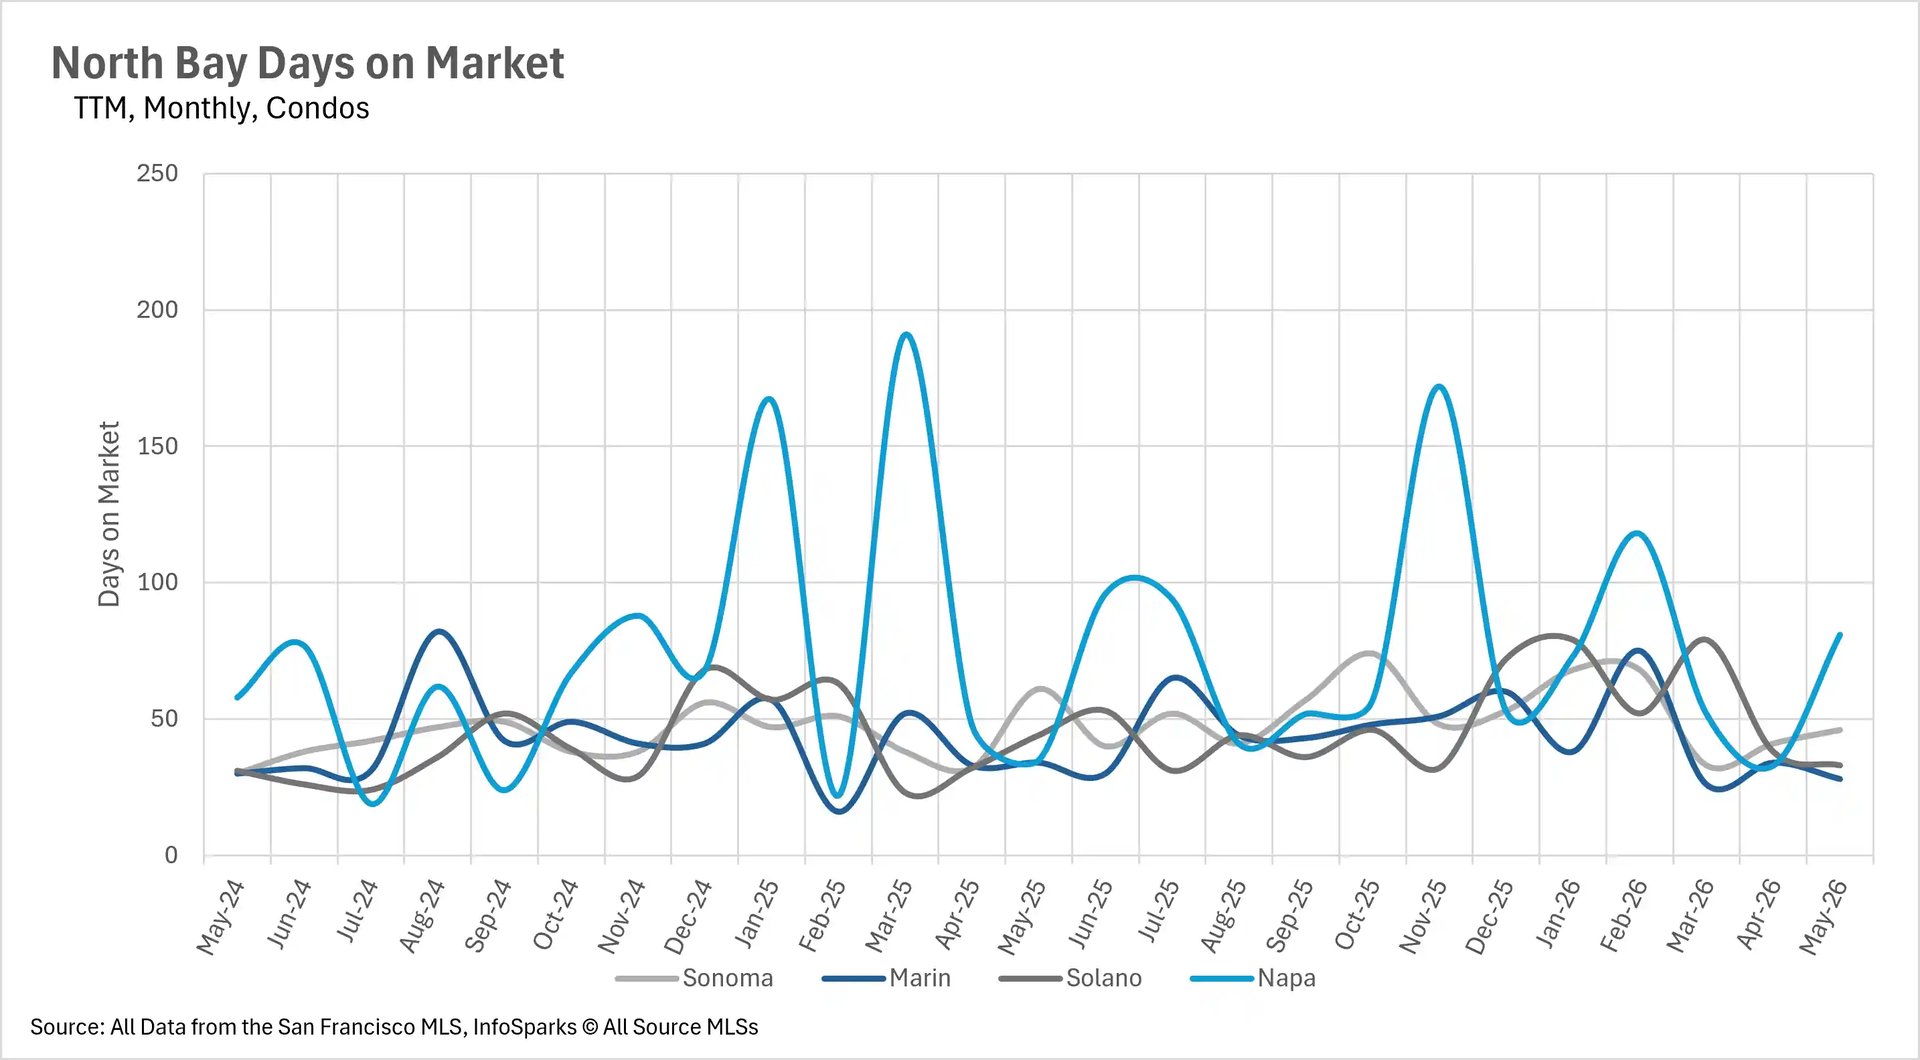
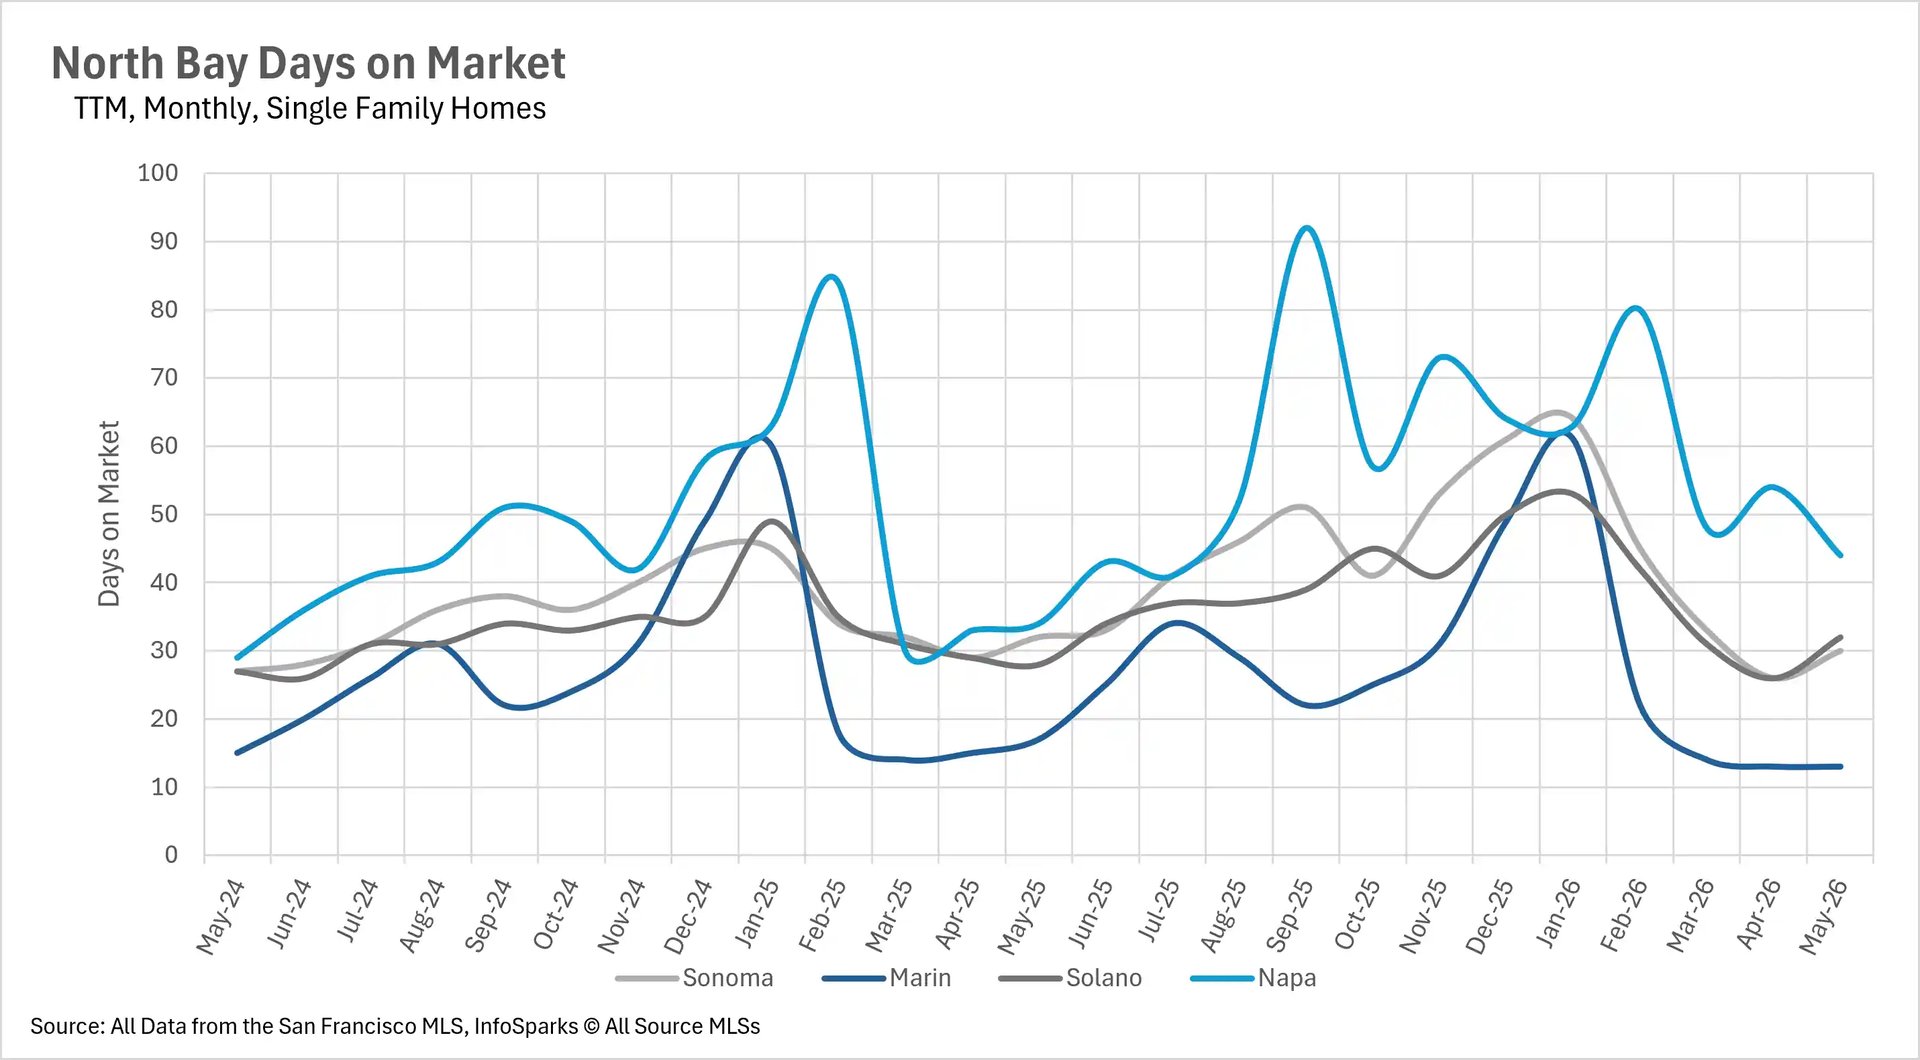
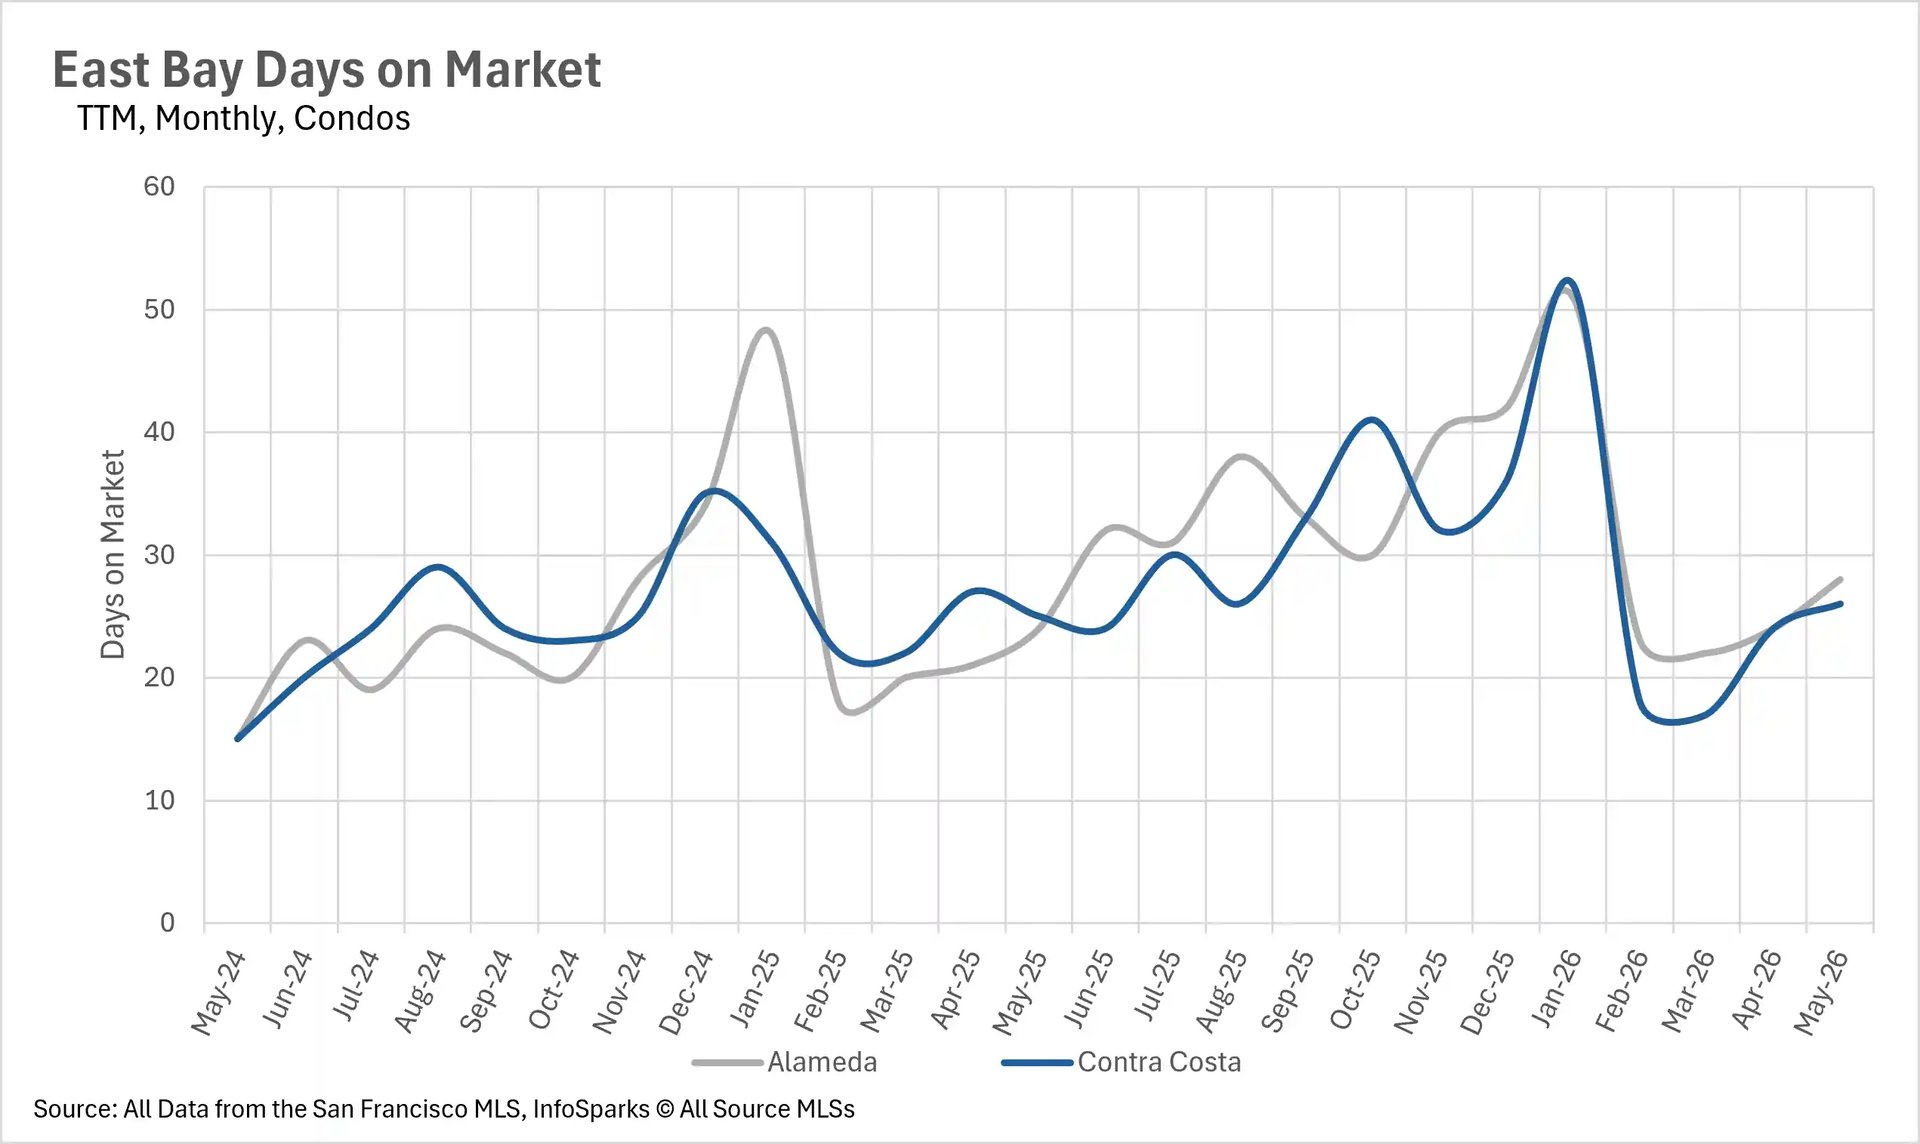
The North Bay saw impressive velocity as well, with Marin County single-family homes selling in just 13 days, a 23.53% improvement year-over-year, and Sonoma County homes moving 6.25% faster at 30 days. The condo market is also showing encouraging signs of improvement in several markets. San Mateo County condos are selling 15.15% faster than last year, Santa Cruz County condos are moving 37.84% faster, and North Bay condos in Sonoma, Solano, and Marin Counties are all selling considerably more quickly than they were a year ago. San Francisco condos are now selling in just 16 days, a 38.46% year-over-year decline. The notable exception is Napa County, where condos are spending 131.43% more time on the market at a median of 81 days.

Sellers continue to dominate the single-family market heading into summer

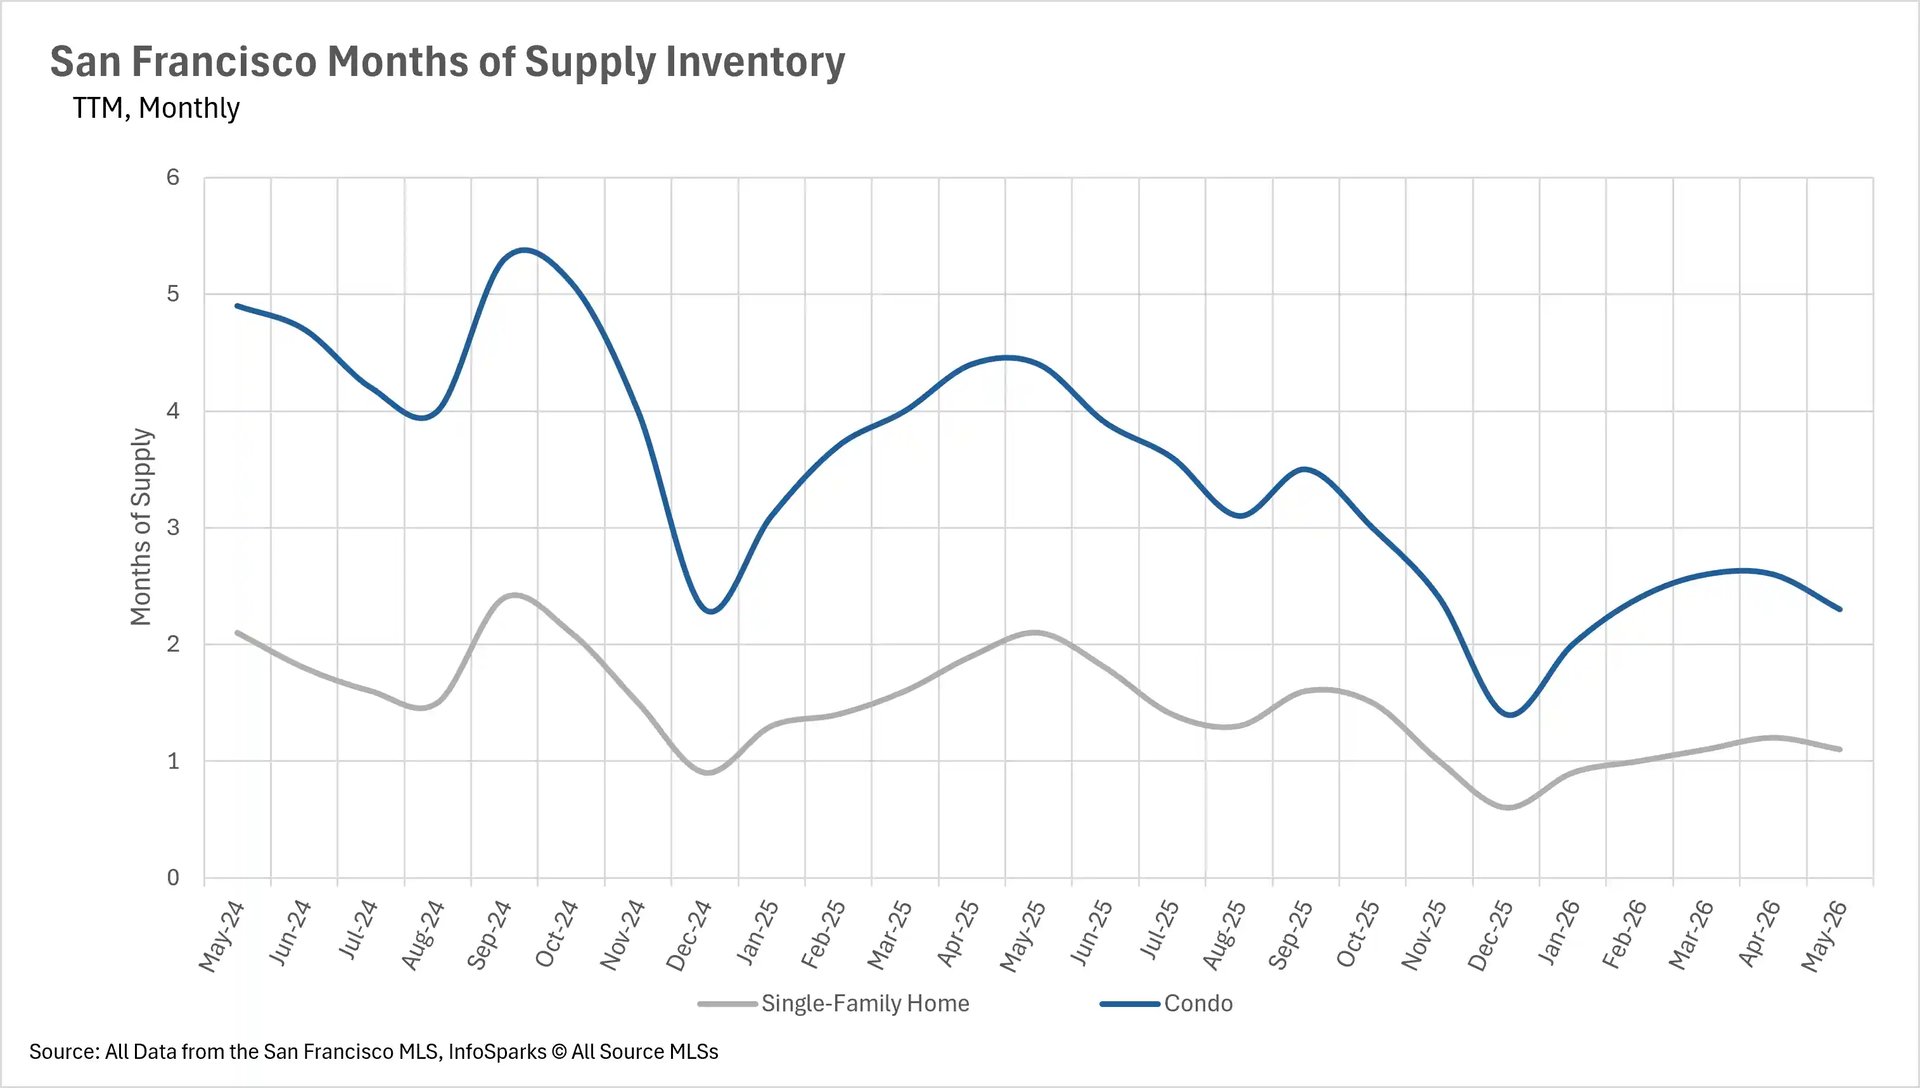
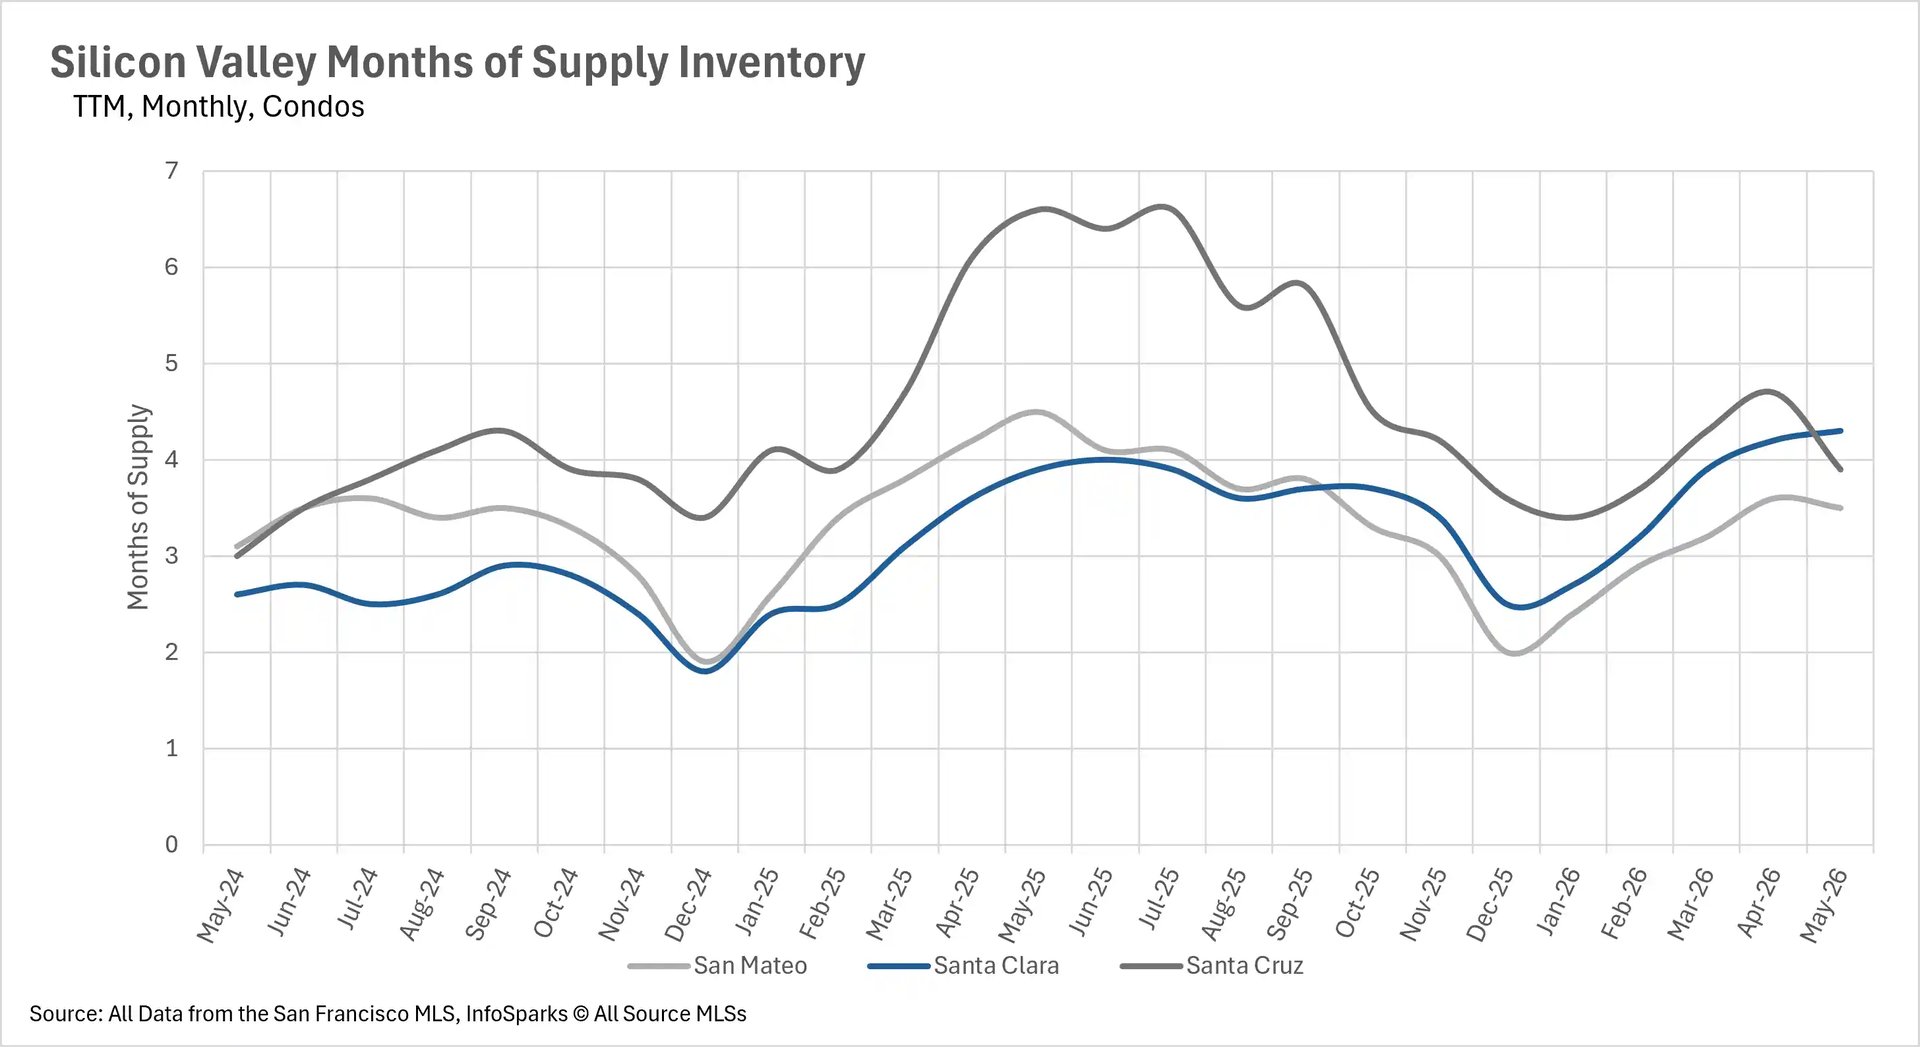
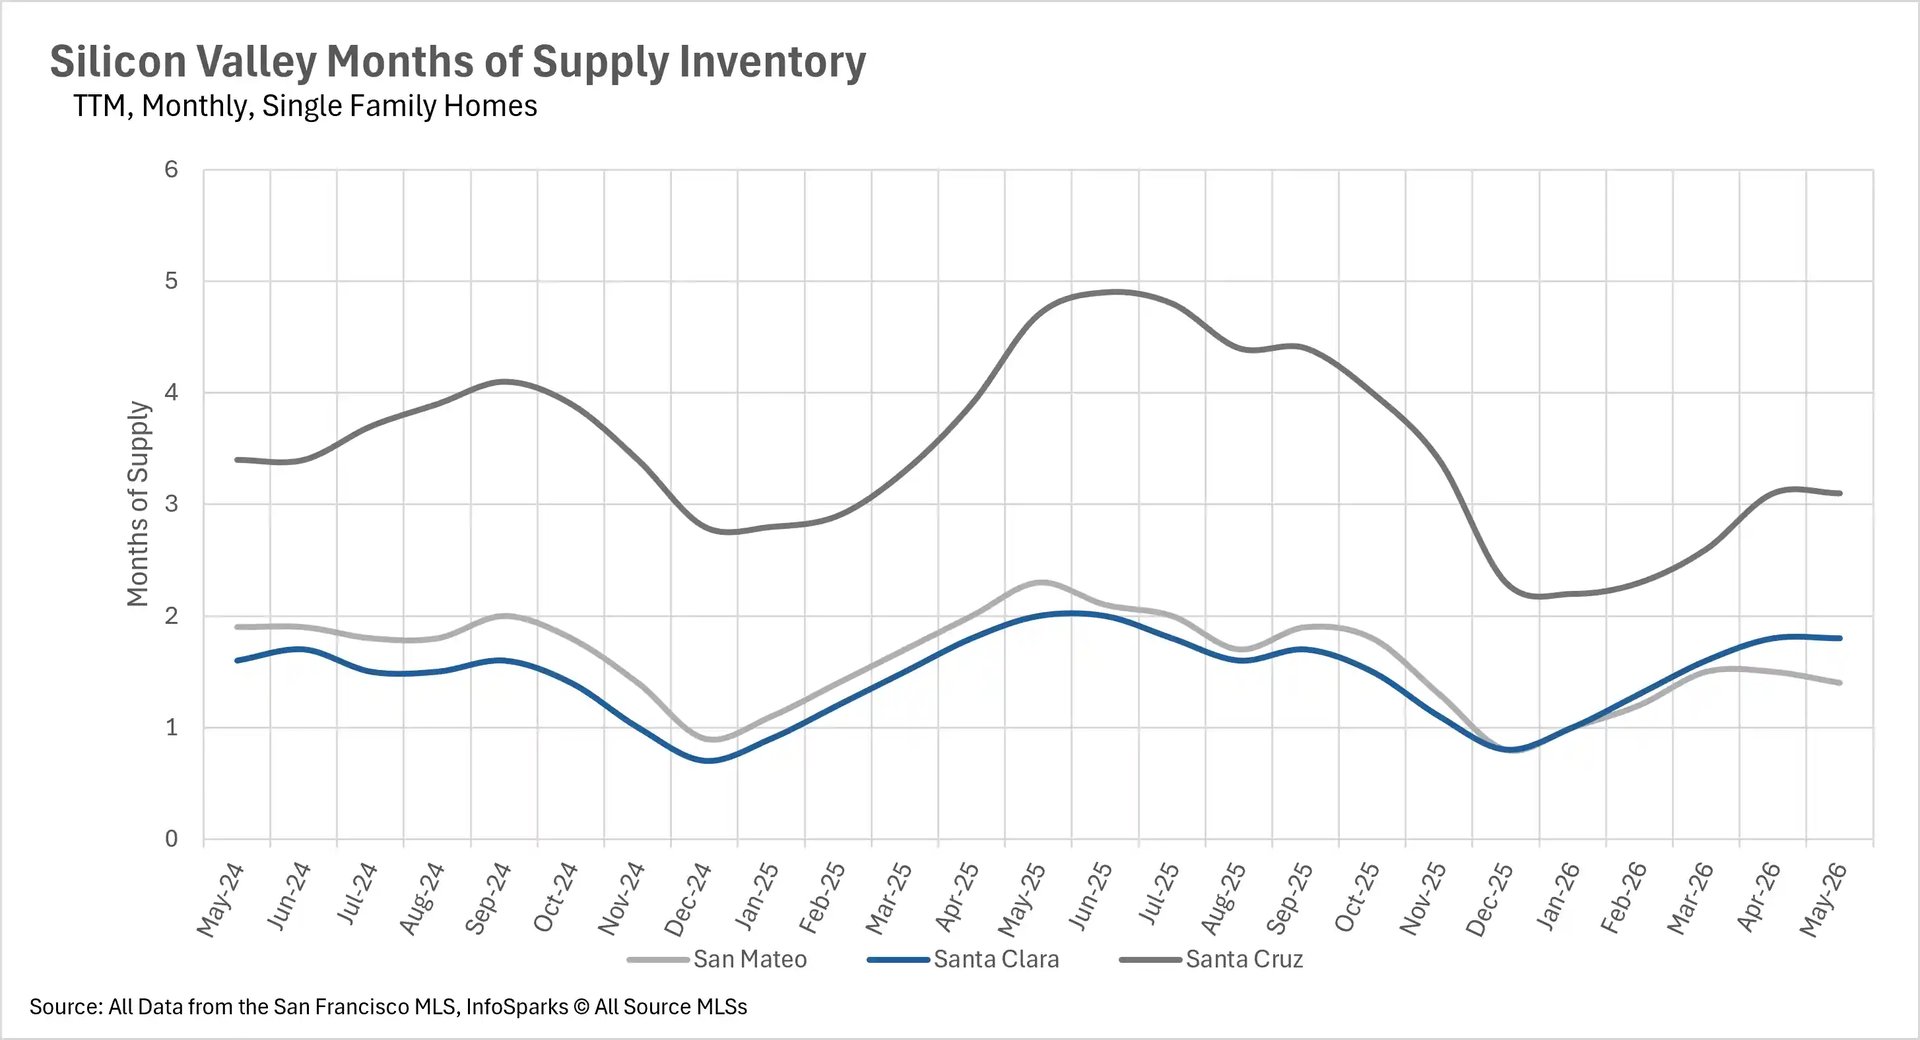
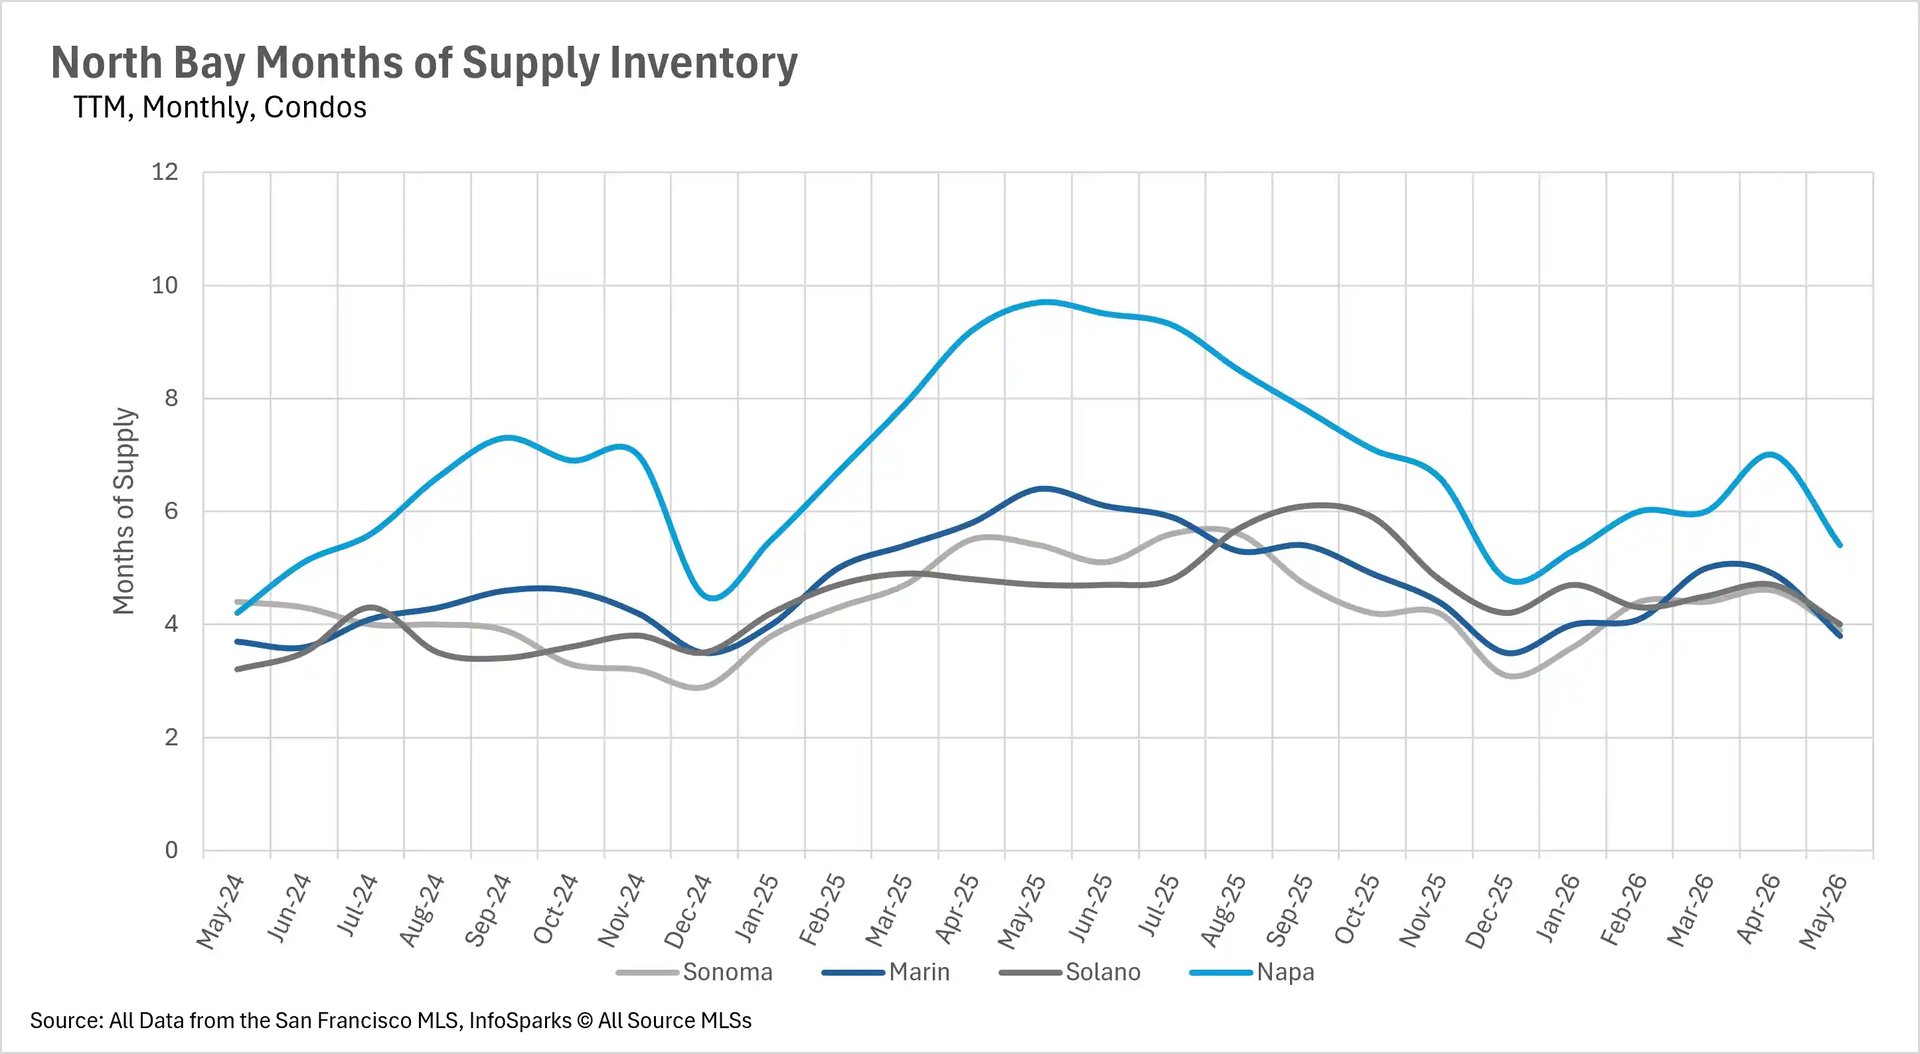
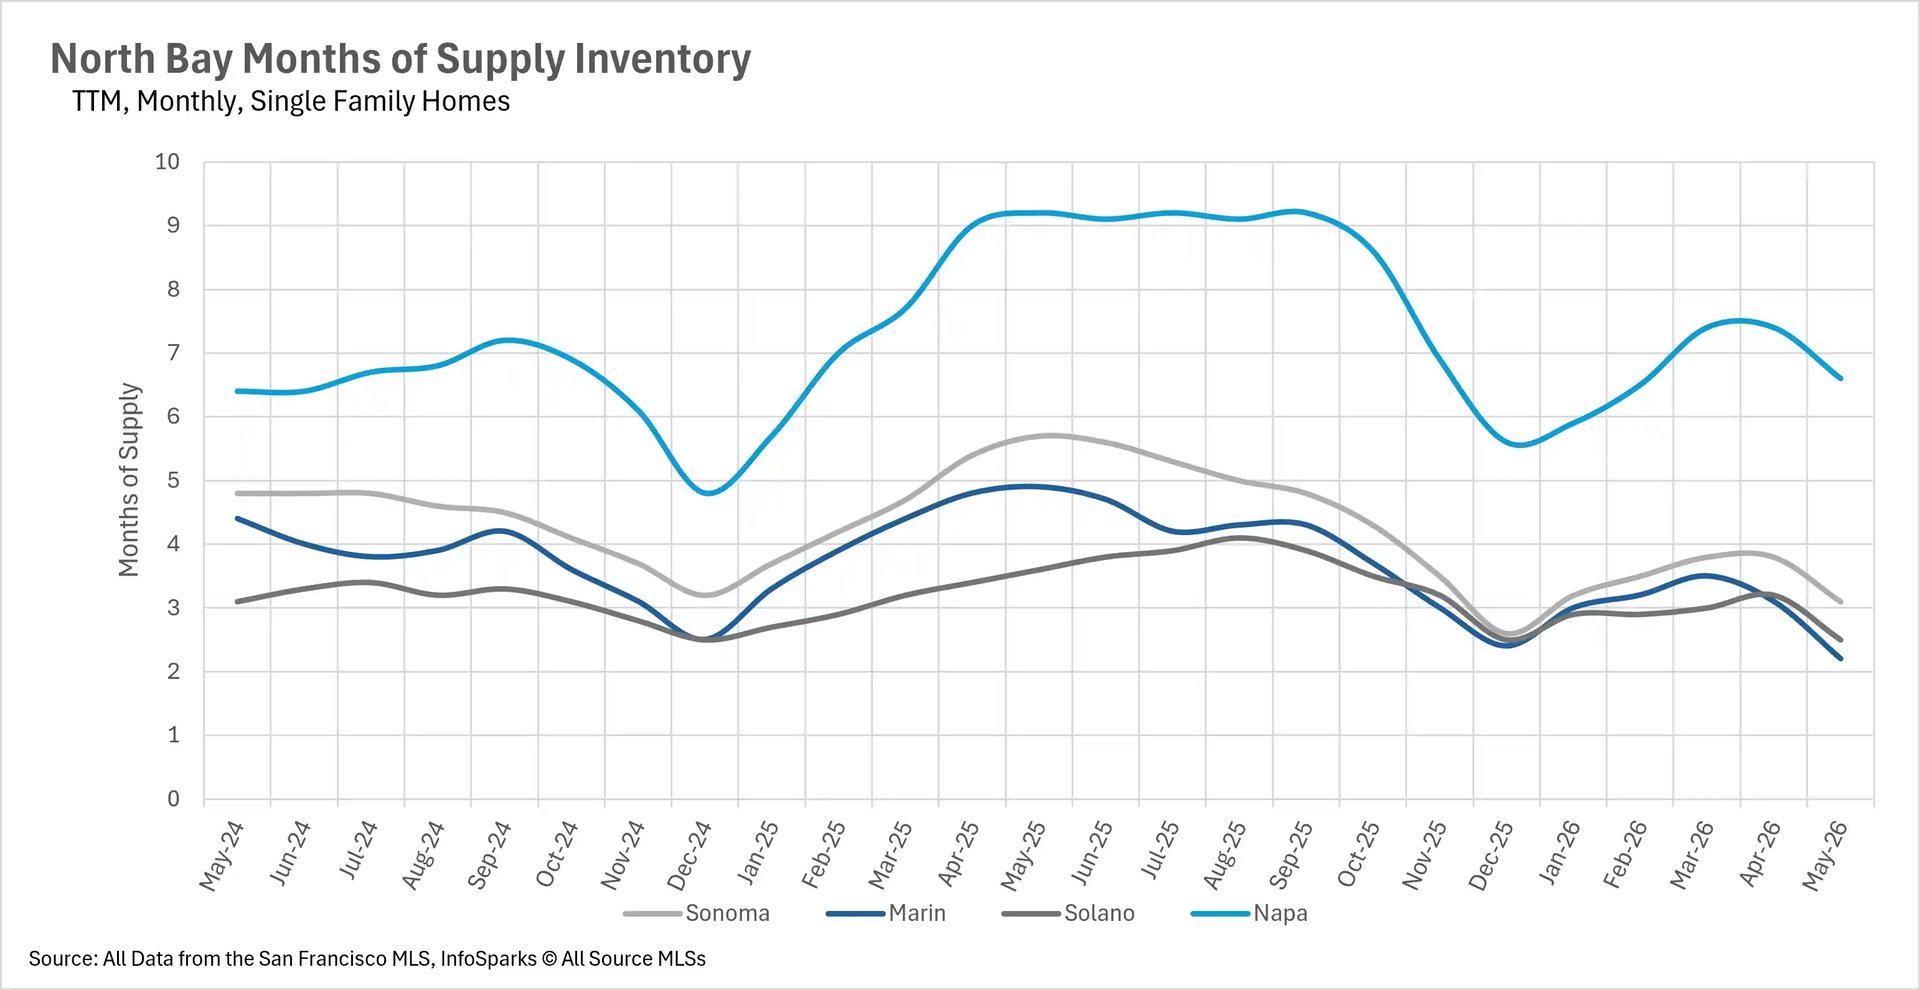
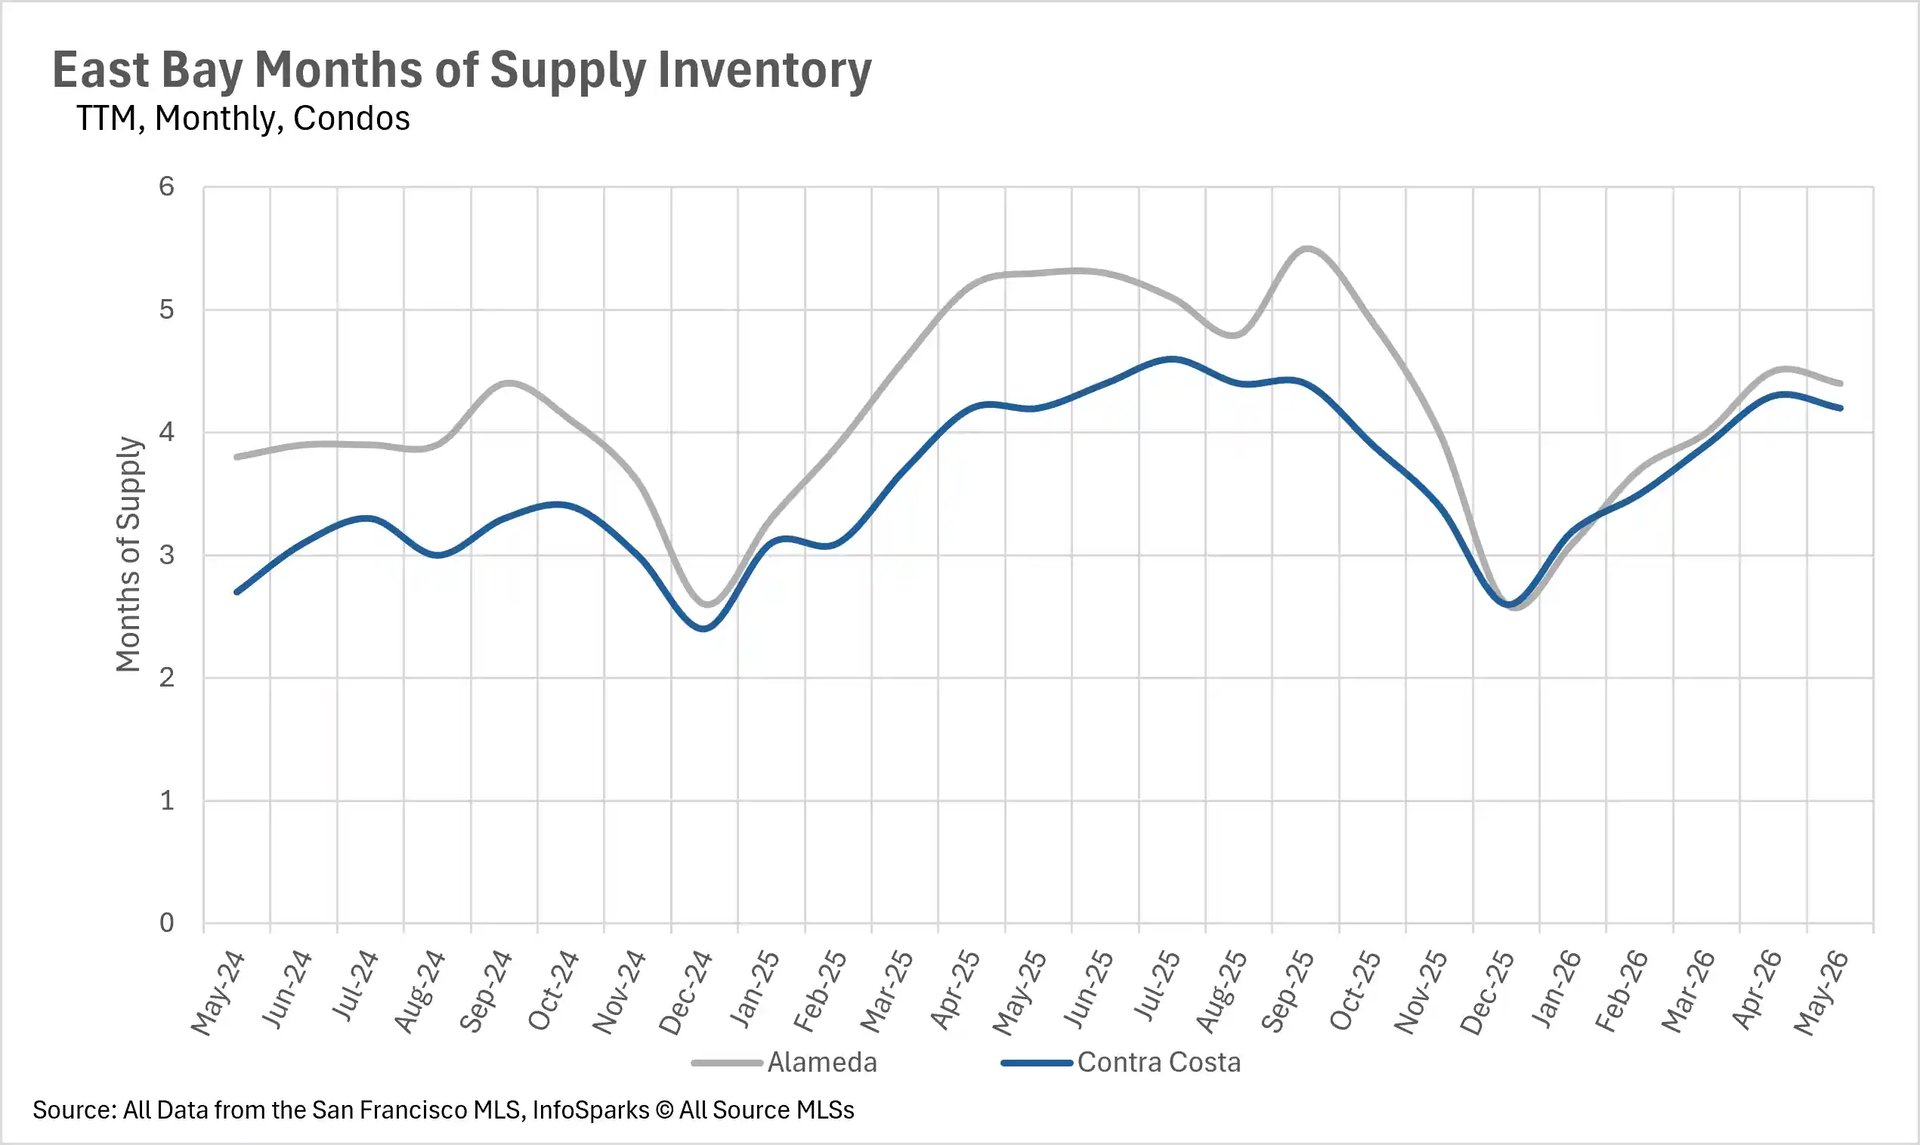
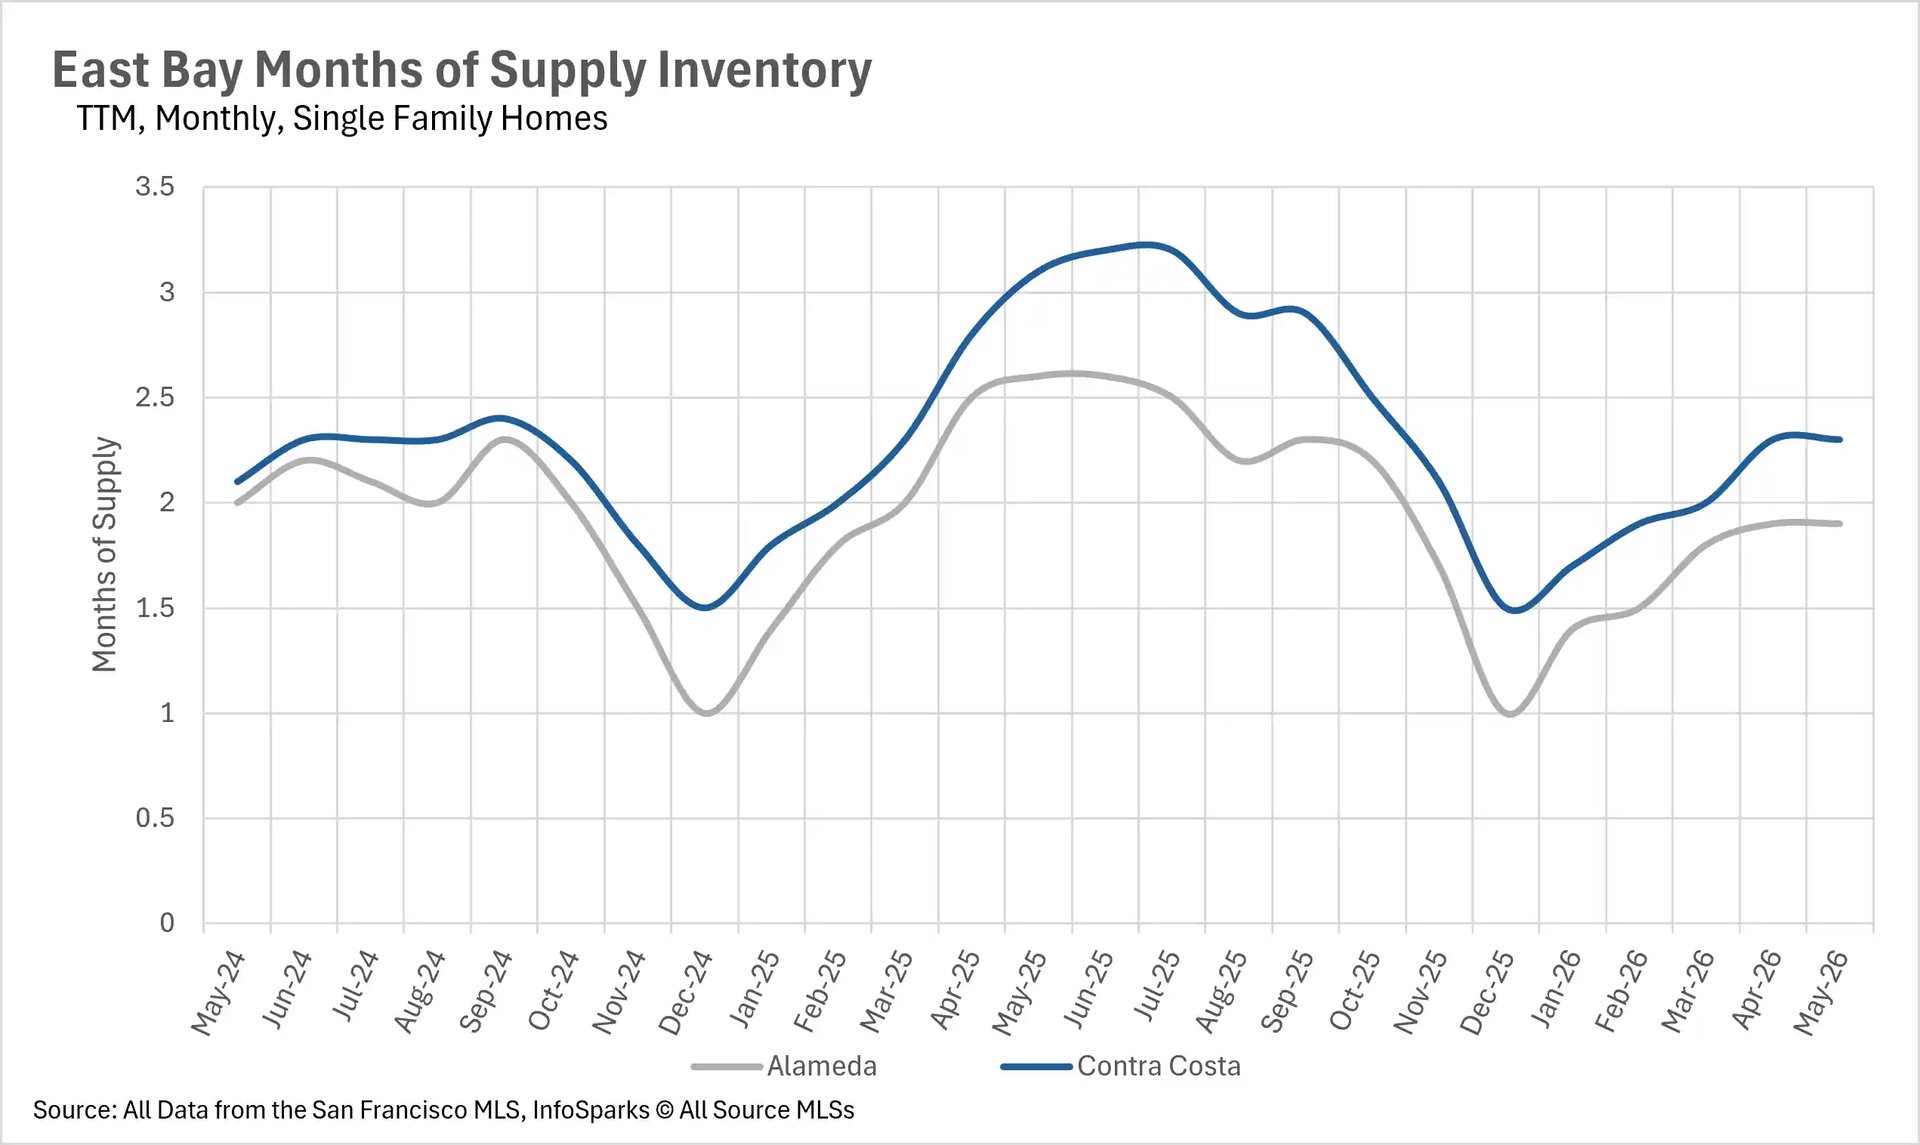
When determining whether a market is a buyers' market or a sellers' market, we look at the Months of Supply Inventory (MSI) metric. The state of California has historically averaged around three months of MSI, so any area with at or around three months of MSI is considered a balanced market. Any market that has less than three months of MSI is considered a seller's market, whereas markets with more than three months of MSI are considered a buyers' market.

The single-family home market is deeply entrenched in seller's territory across the Bay Area as we head into summer. San Francisco sits at just 1.1 months of supply, down nearly 48% year-over-year. San Mateo County has 1.4 months of supply, down a dramatic 39.13%, while Santa Clara County has 1.8 months, down 10%. Alameda County sits at 1.9 months, Marin County at 2.2 months, Contra Costa County at 2.3 months, Solano County at 2.5 months, Sonoma County at 3.1 months, and Santa Cruz County at 3.1 months. Napa County remains the lone buyer's market at 6.6 months, although even that figure is down 28.26% year-over-year.

The condo market continues to offer more balance for buyers. San Francisco's condo market has fully transformed from buyer's territory last year at 4.4 months to a strong seller's market at just 2.3 months. However, most other areas remain in buyer's or territory balanced, with Alameda County at 4.4 months, Contra Costa County at 4.2 months, Santa Clara County at 4.3 months, Napa County at 5.4 months, and Solano County at 4 months. As we head into the busiest season of the year, sellers in the single-family home market are positioned to enjoy significant leverage across nearly every corner of the Bay Area.

Local Lowdown Data

Line chart displaying San Francisco median real estate prices over a three-year monthly period up to May 2026, comparing market value trends between single-family homes and condos.

Bar chart illustrating San Francisco median real estate price changes year-over-year up to May 2026, showing monthly percentage fluctuations for both single-family homes and condos.

Line graph tracking the average percentage of the original list price received in San Francisco over a three-year period up to May 2026, comparing single-family homes and condos.

Combination chart tracking two-year monthly condo inventory in San Francisco up to May 2026, detailing the volume of new listings, sold listings, and total active units for sale.

Combination chart tracking two-year monthly single-family home inventory in San Francisco up to May 2026, highlighting the volume of new listings, sold units, and total active housing supply.

Line graph of San Francisco months of supply housing inventory up to May 2026, showing monthly market saturation trends for single-family homes versus condos.

Line graph tracking the average days on market in San Francisco up to May 2026, comparing sales cycle speed and buyer velocity between single-family homes and condos.

Line chart displaying Silicon Valley median condo prices over a three-year monthly period up to May 2026, comparing real estate trends in San Mateo, Santa Clara, and Santa Cruz counties.

Line chart showing Silicon Valley median single-family home prices over a three-year period up to May 2026, tracking values across San Mateo, Santa Clara, and Santa Cruz counties.

Bar chart illustrating year-over-year median condo price changes in Silicon Valley up to May 2026, comparing percentage fluctuations for the San Mateo, Santa Clara, and Santa Cruz markets.

Bar chart showing year-over-year median single-family home price percentage changes for Silicon Valley real estate markets up to May 2026 across San Mateo, Santa Clara, and Santa Cruz.

Combination chart tracking two-year monthly condo inventory in Silicon Valley up to May 2026, detailing the volume of new listings, sold listings, and total active homes for sale.

Combination chart tracking two-year monthly single-family home inventory in Silicon Valley up to May 2026, highlighting the volume of new listings, sold units, and total active housing supply.

Line graph depicting months of supply inventory for Silicon Valley condos up to May 2026, comparing market saturation and supply levels in San Mateo, Santa Clara, and Santa Cruz.

Line graph showing months of supply housing inventory for Silicon Valley single-family homes up to May 2026, tracking market balance across San Mateo, Santa Clara, and Santa Cruz.

Line graph tracking the average days on market for condos in Silicon Valley up to May 2026, comparing the speed of real estate sales in San Mateo, Santa Clara, and Santa Cruz.

Line graph tracking the average days on market for single-family homes in Silicon Valley up to May 2026, comparing sales cycles and buyer velocity for San Mateo, Santa Clara, and Santa Cruz counties.

Line chart displaying North Bay median condo prices over a three-year monthly period up to May 2026, comparing real estate trends in Sonoma, Marin, Solano, and Napa counties.

Line chart showing North Bay median single-family home prices over a three-year period up to May 2026, tracking values across Sonoma, Marin, Solano, and Napa counties.

Bar chart illustrating year-over-year median condo price changes in the North Bay up to May 2026, comparing percentage fluctuations for the Sonoma, Marin, Solano, and Napa markets.

Bar chart showing year-over-year median single-family home price percentage changes for North Bay real estate markets up to May 2026 across Sonoma, Marin, Solano, and Napa.

Combination chart tracking two-year monthly condo inventory in the North Bay up to May 2026, detailing the volume of new listings, sold listings, and total active homes for sale.

Combination chart tracking two-year monthly single-family home inventory in the North Bay up to May 2026, highlighting the volume of new listings, sold units, and total active housing supply.

Line graph depicting months of supply inventory for North Bay condos up to May 2026, comparing market saturation and supply levels in Sonoma, Marin, Solano, and Napa counties.

Line graph showing months of supply housing inventory for North Bay single-family homes up to May 2026, tracking market balance across Sonoma, Marin, Solano, and Napa counties.

Line graph tracking the average days on market for condos in the North Bay up to May 2026, comparing the speed of real estate sales in Sonoma, Marin, Solano, and Napa counties.

Line graph tracking the average days on market for single-family homes in the North Bay up to May 2026, comparing sales cycles and buyer velocity for Sonoma, Marin, Solano, and Napa counties.

Line chart displaying East Bay median condo prices over a three-year monthly period up to May 2026, comparing real estate trends in Alameda and Contra Costa counties.

Line chart showing East Bay median single-family home prices over a three-year period up to May 2026, tracking values across Alameda and Contra Costa counties.

Bar chart illustrating year-over-year median condo price changes in the East Bay up to May 2026, comparing percentage fluctuations for the Alameda and Contra Costa real estate markets.

Bar chart showing year-over-year median single-family home price percentage changes for East Bay real estate markets up to May 2026 across Alameda and Contra Costa counties.

Combination chart tracking two-year monthly condo inventory in the East Bay up to May 2026, detailing the volume of new listings, sold listings, and total active homes for sale.

Combination chart tracking two-year monthly single-family home inventory in the East Bay up to May 2026, highlighting the volume of new listings, sold units, and total active housing supply.

Line graph depicting months of supply inventory for East Bay condos up to May 2026, comparing market saturation and supply levels in Alameda and Contra Costa counties.

Line graph showing months of supply housing inventory for East Bay single-family homes up to May 2026, tracking market balance across Alameda and Contra Costa counties.

Line graph tracking the average days on market for condos in the East Bay up to May 2026, comparing the speed of real estate sales in Alameda and Contra Costa counties.

Line graph tracking the average days on market for single-family homes in the East Bay up to May 2026, comparing sales cycles and buyer velocity for Alameda and Contra Costa counties.

Let’s Talk

You’ve got questions and we can’t wait to answer them.

Follow Us on Instagram