An aerial view of a large, luxurious house with a complex brown tile roof

Bay Area Real Estate - July 2026 Market Report

The Local Lowdown

Quick Take:

  • San Francisco single-family home prices posted their strongest year-over-year gain of 2026, surging more than 26%, while the East Bay's condo market roared back to life with its best performance in years.

  • Inventory levels have reached crisis levels in several markets, with San Francisco single-family home listings down nearly 60% year-over-year and Silicon Valley down more than 26%.

  • Single-family homes are selling in two weeks or less across the region, with buyers acting decisively in the face of extremely limited supply.

  • The Bay Area is overwhelmingly a seller's market for single-family homes, with San Francisco sitting at just 0.7 months of supply, while the condo market continues to offer buyers more leverage in several counties.

Note: You can find the charts/graphs for the Local Lowdown at the end of this section.

Prices are climbing across most of the Bay Area, with San Francisco leading the charge

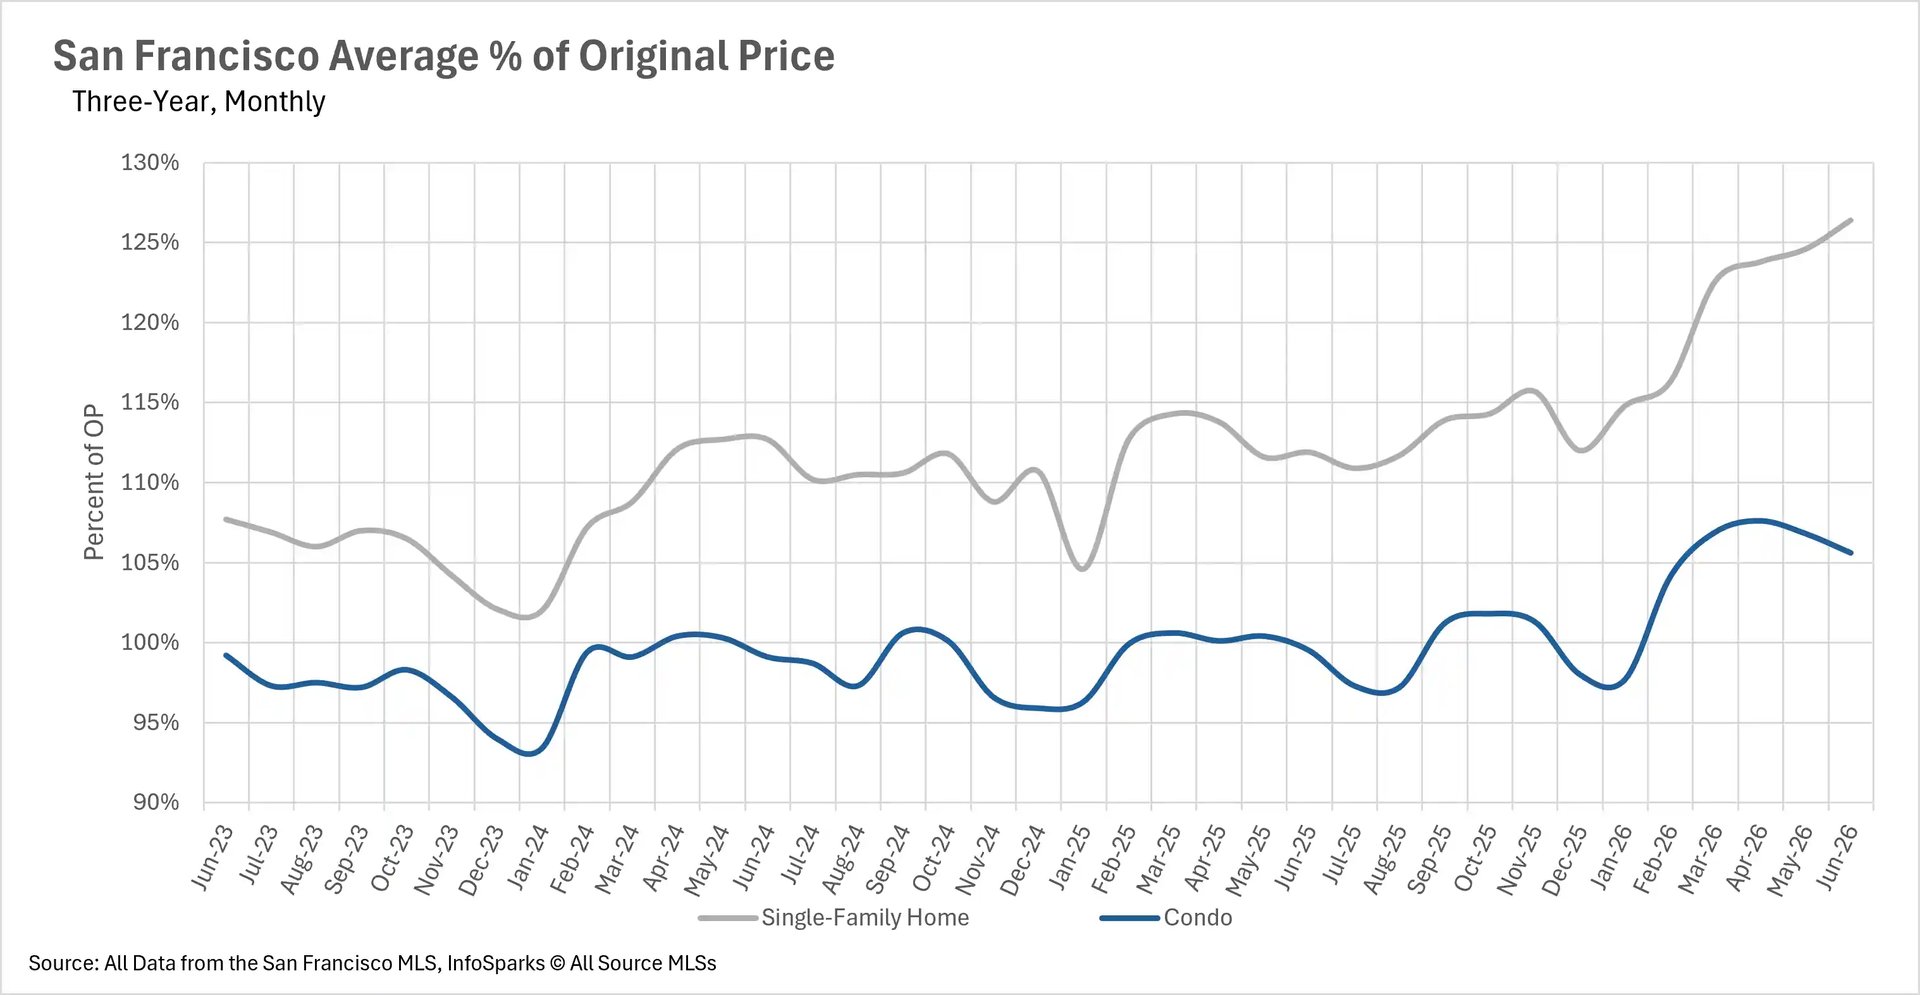
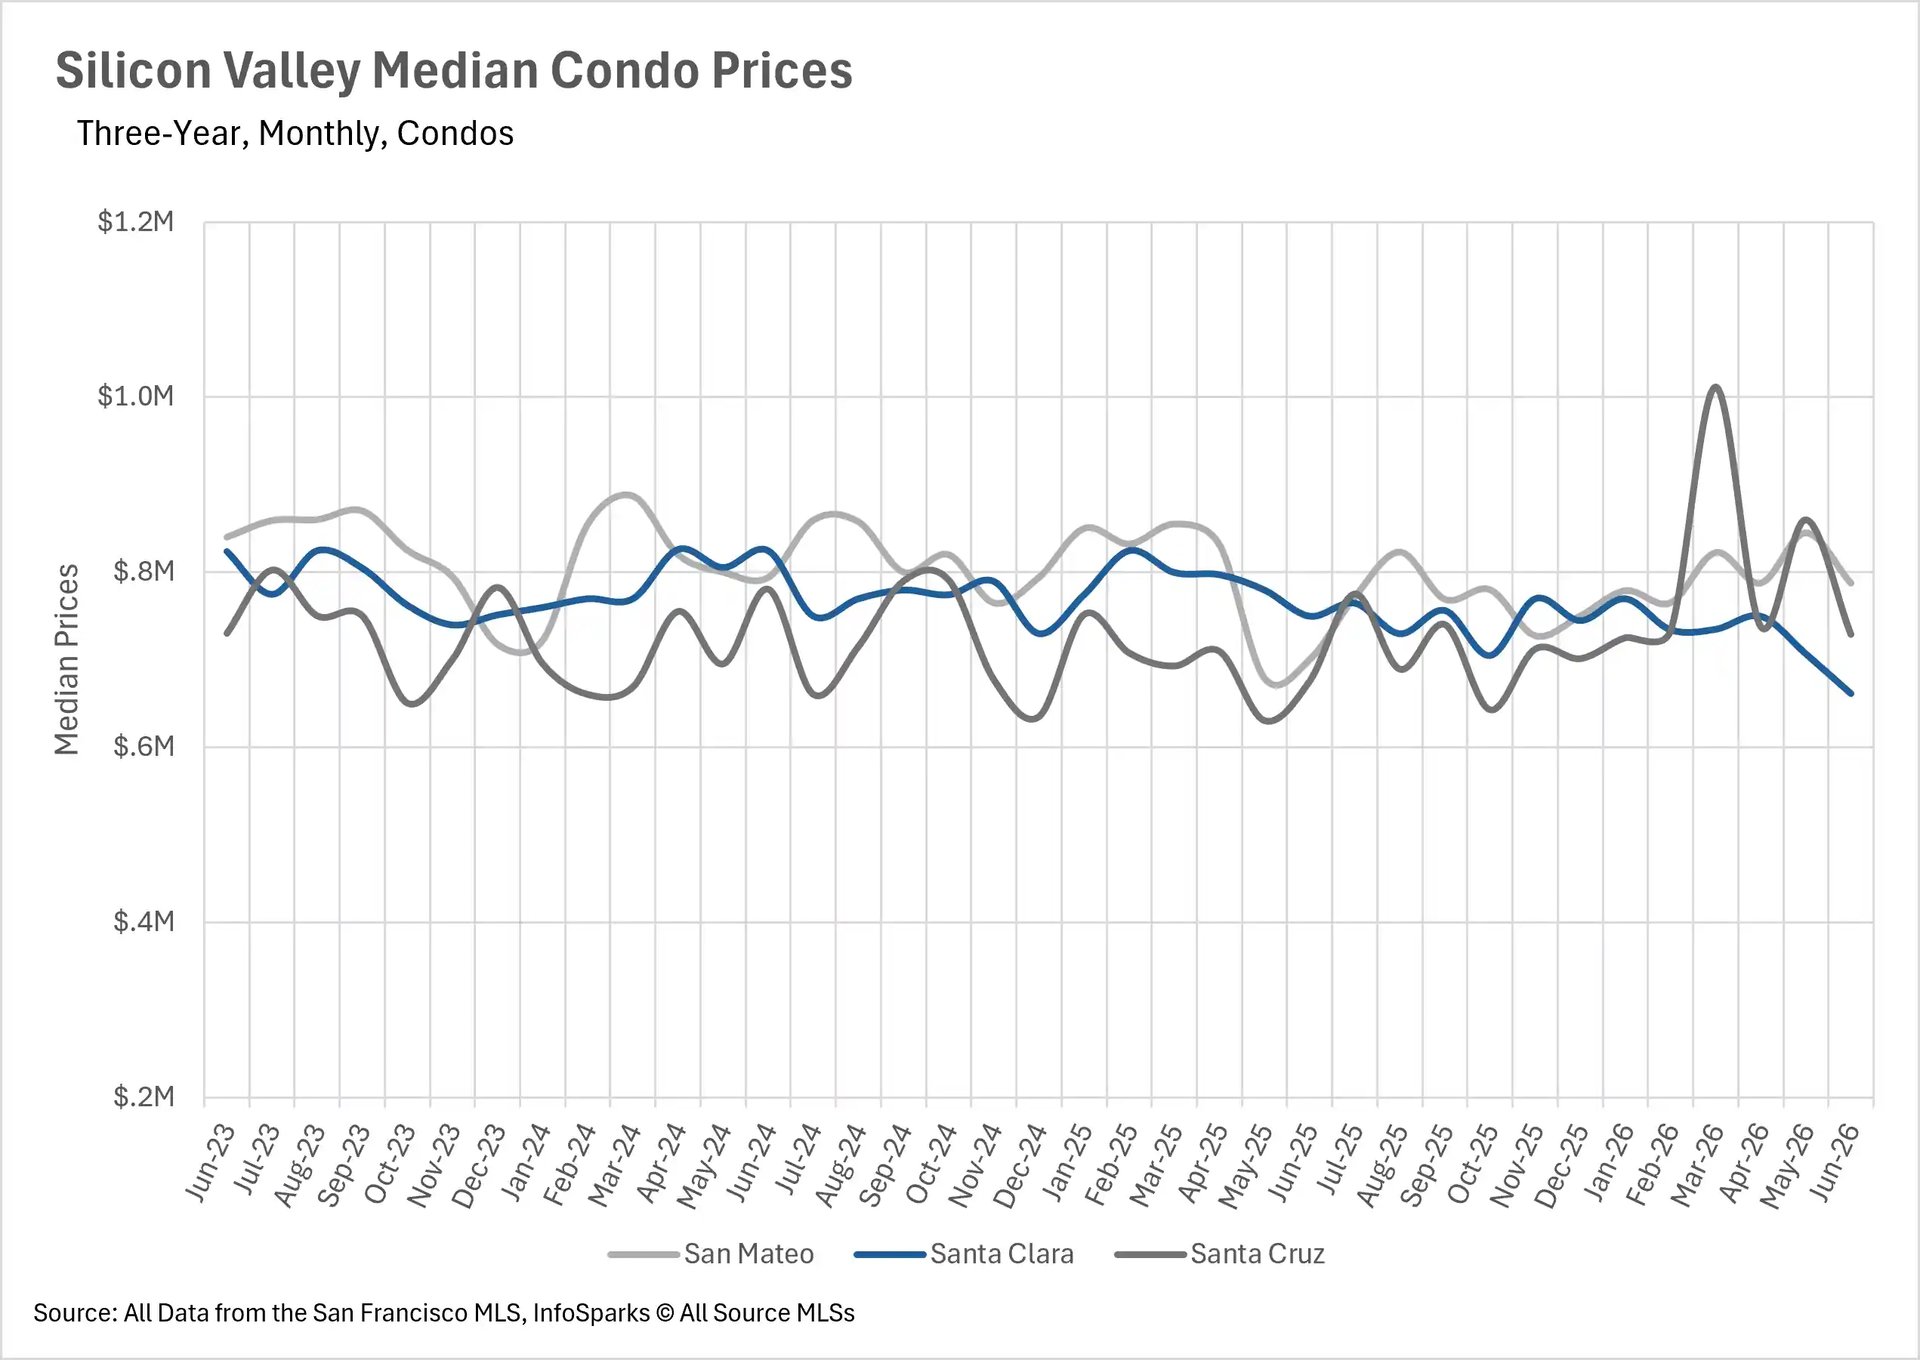
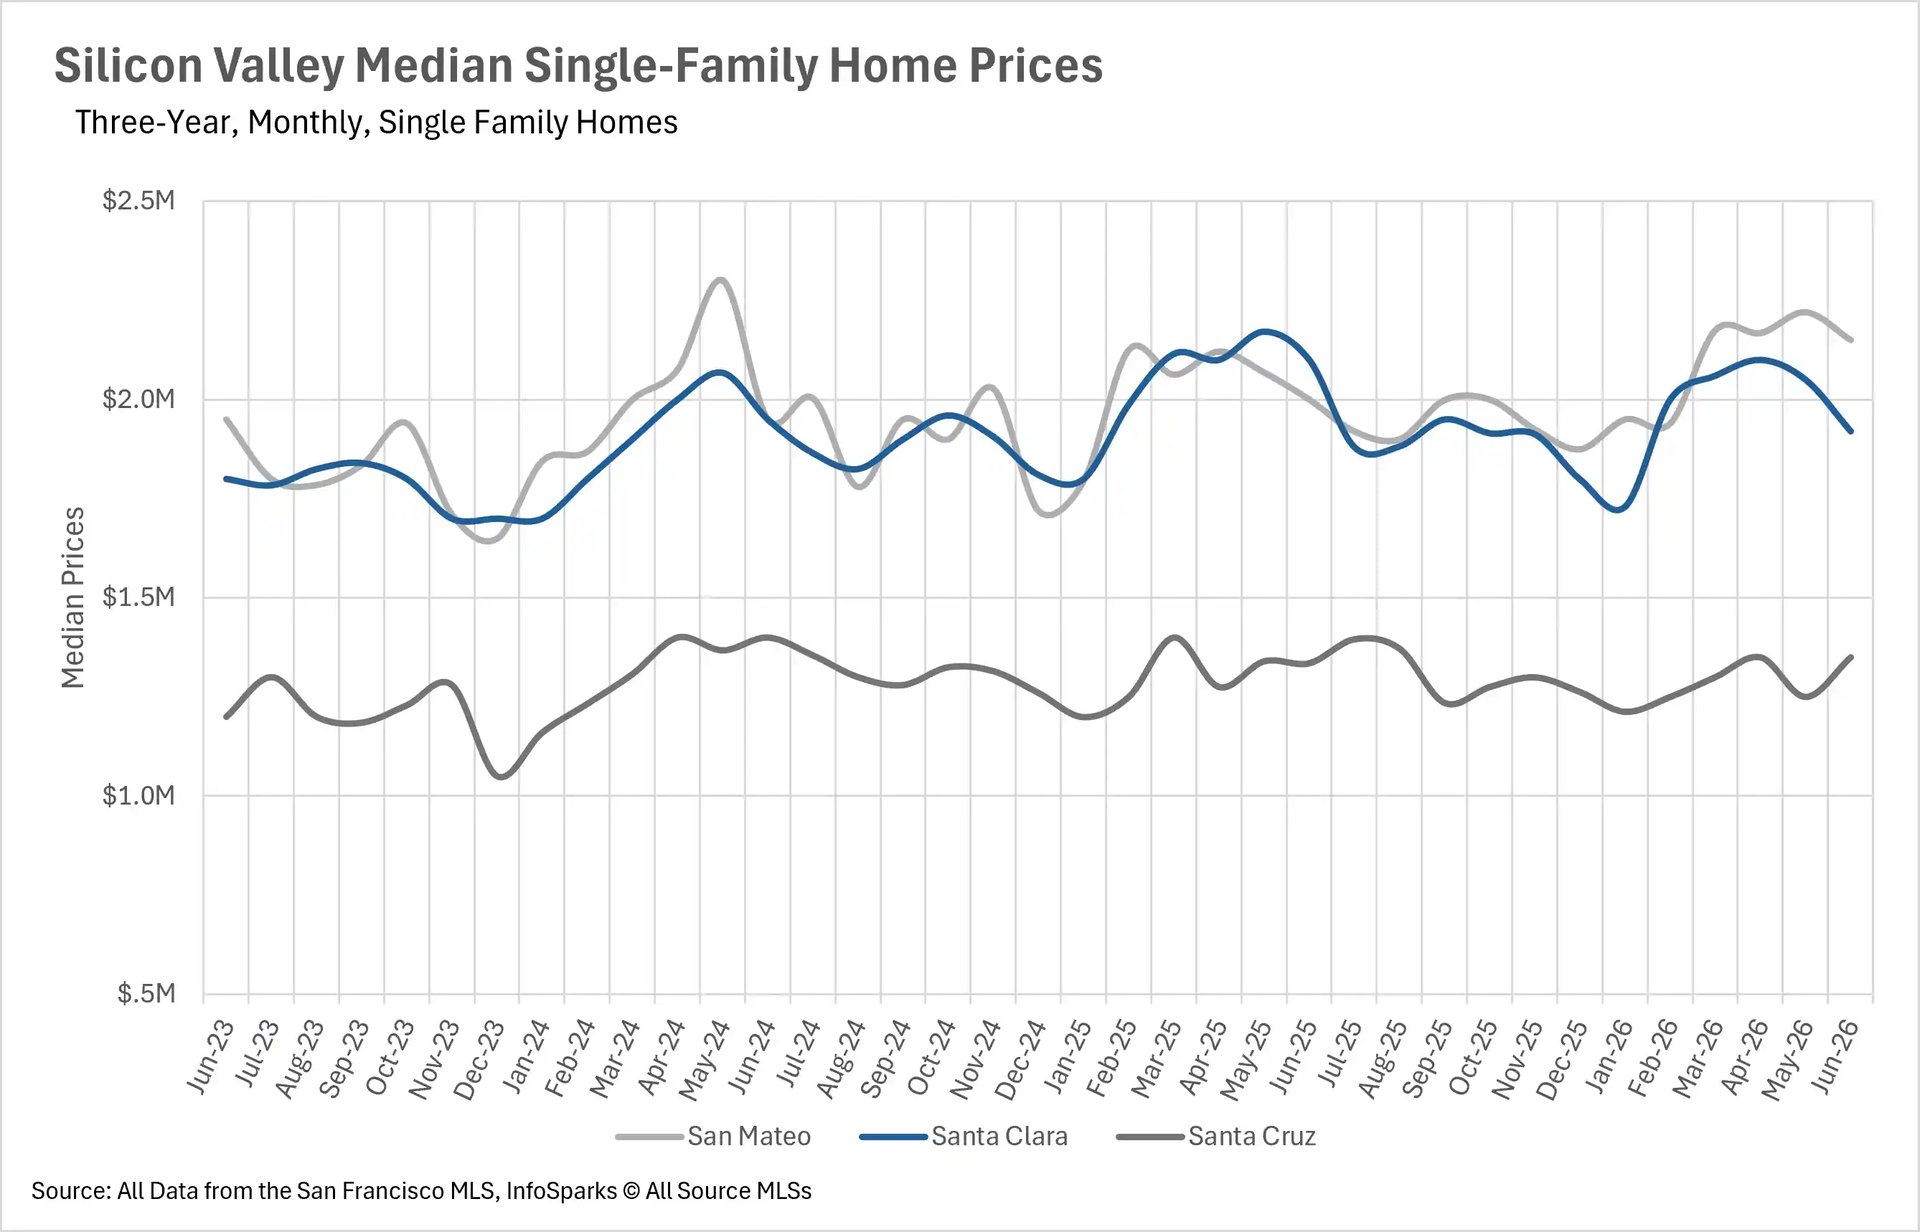
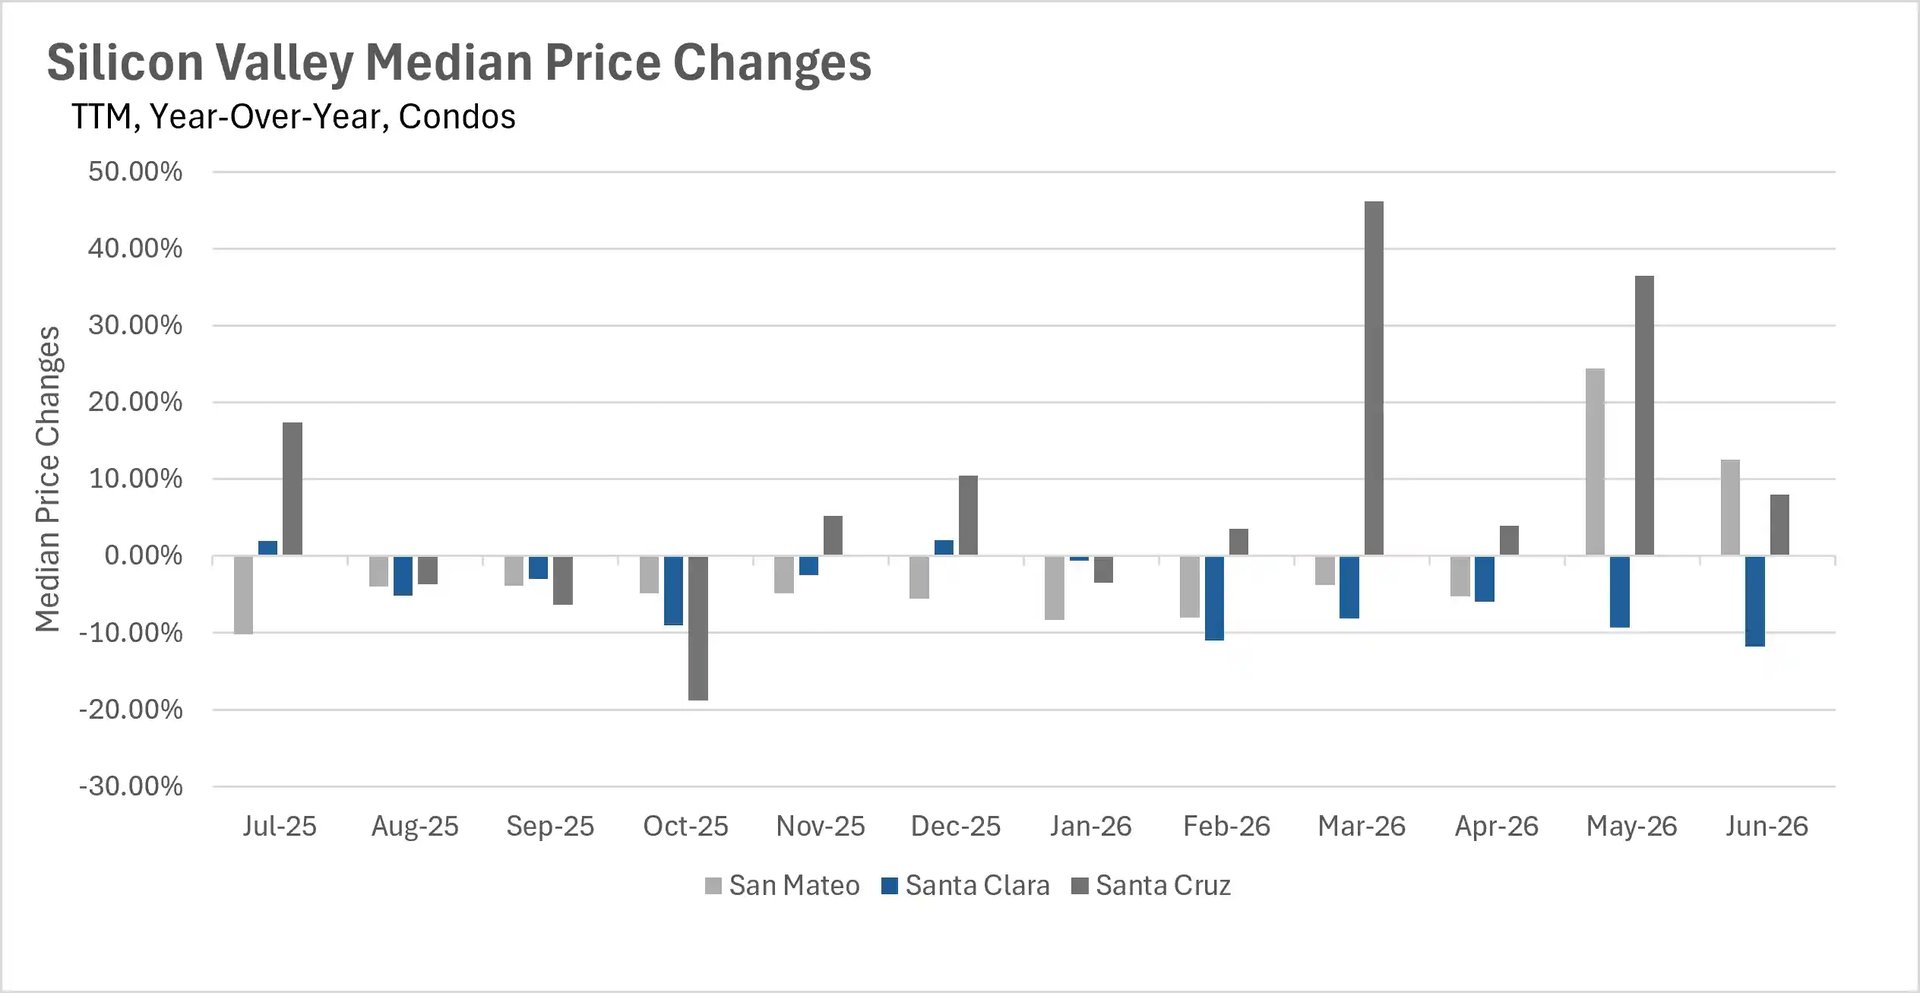
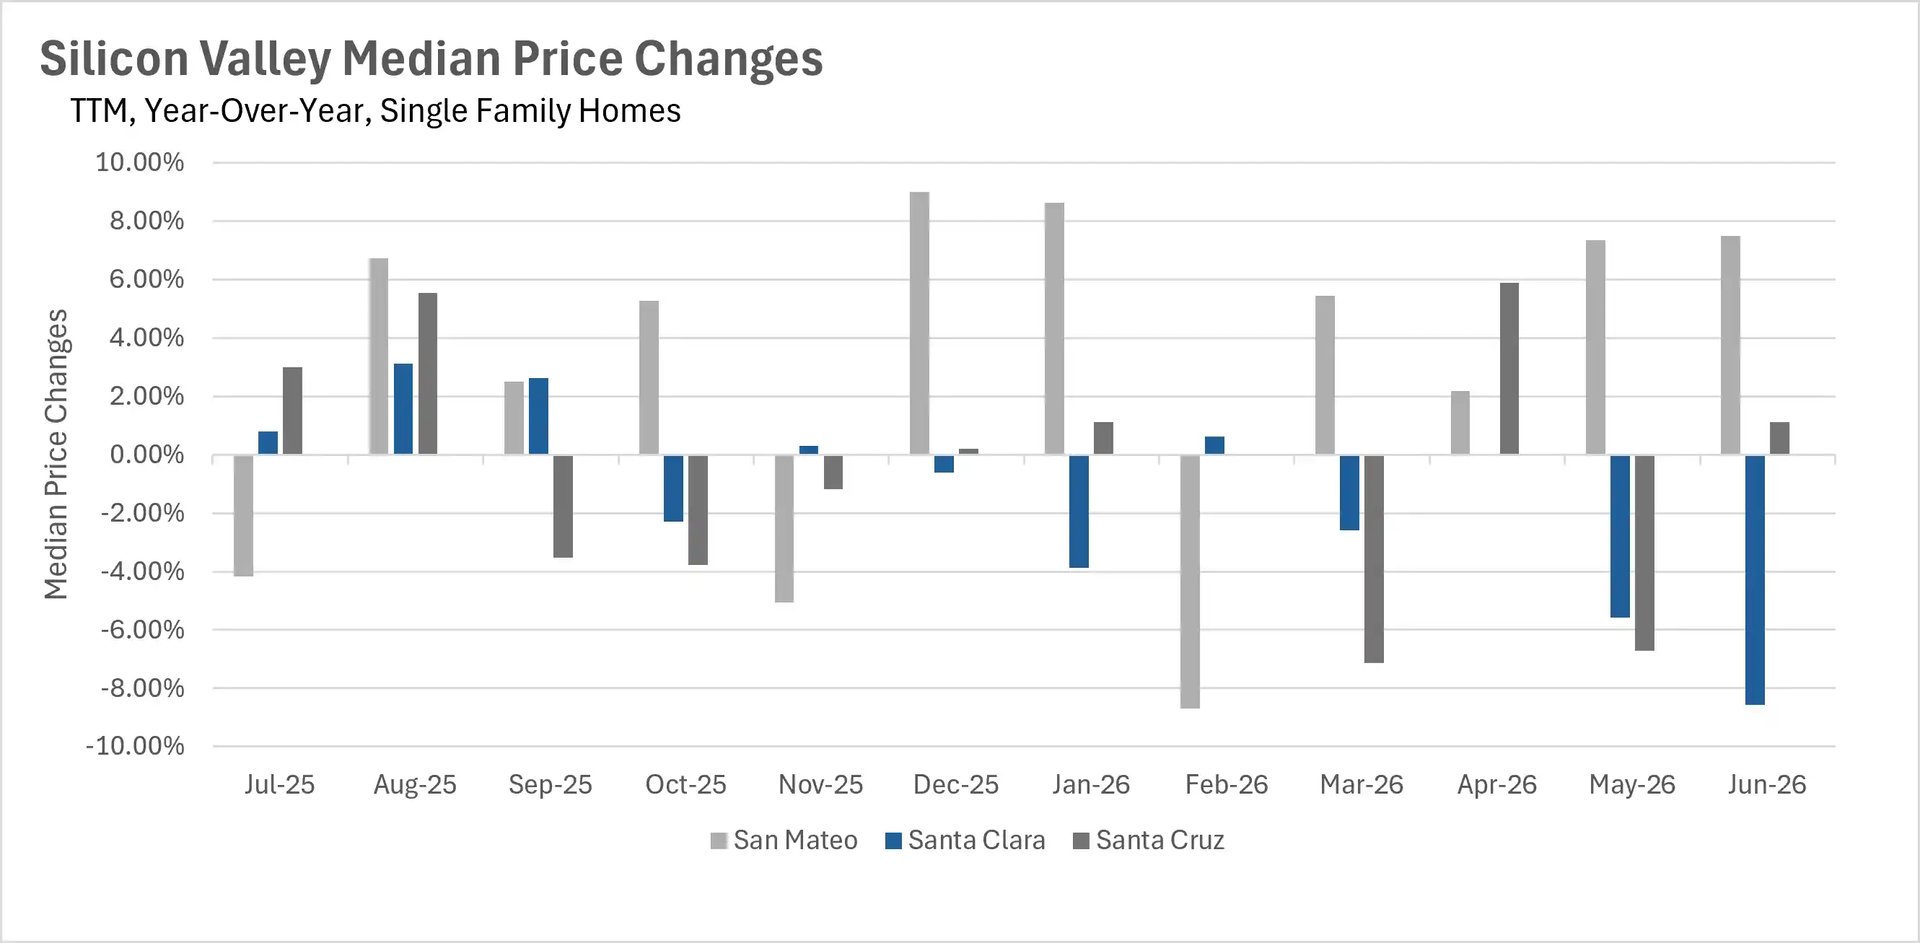
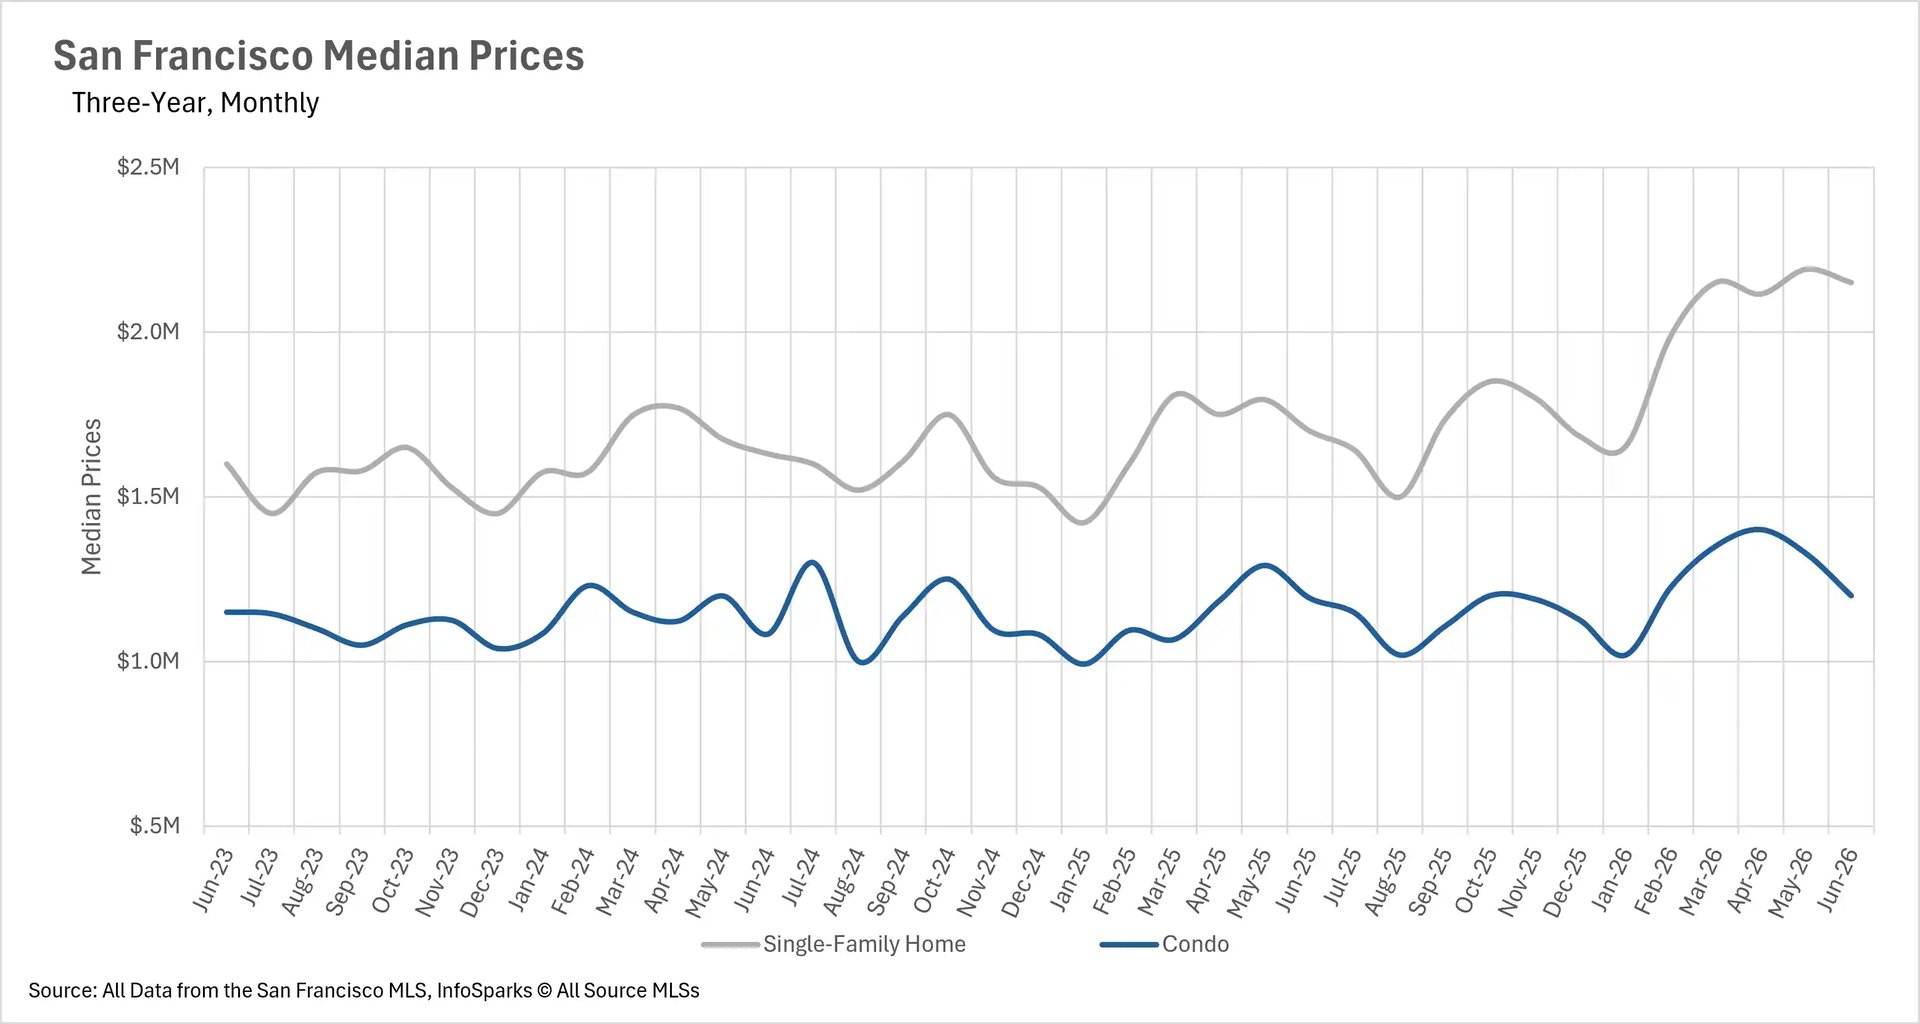
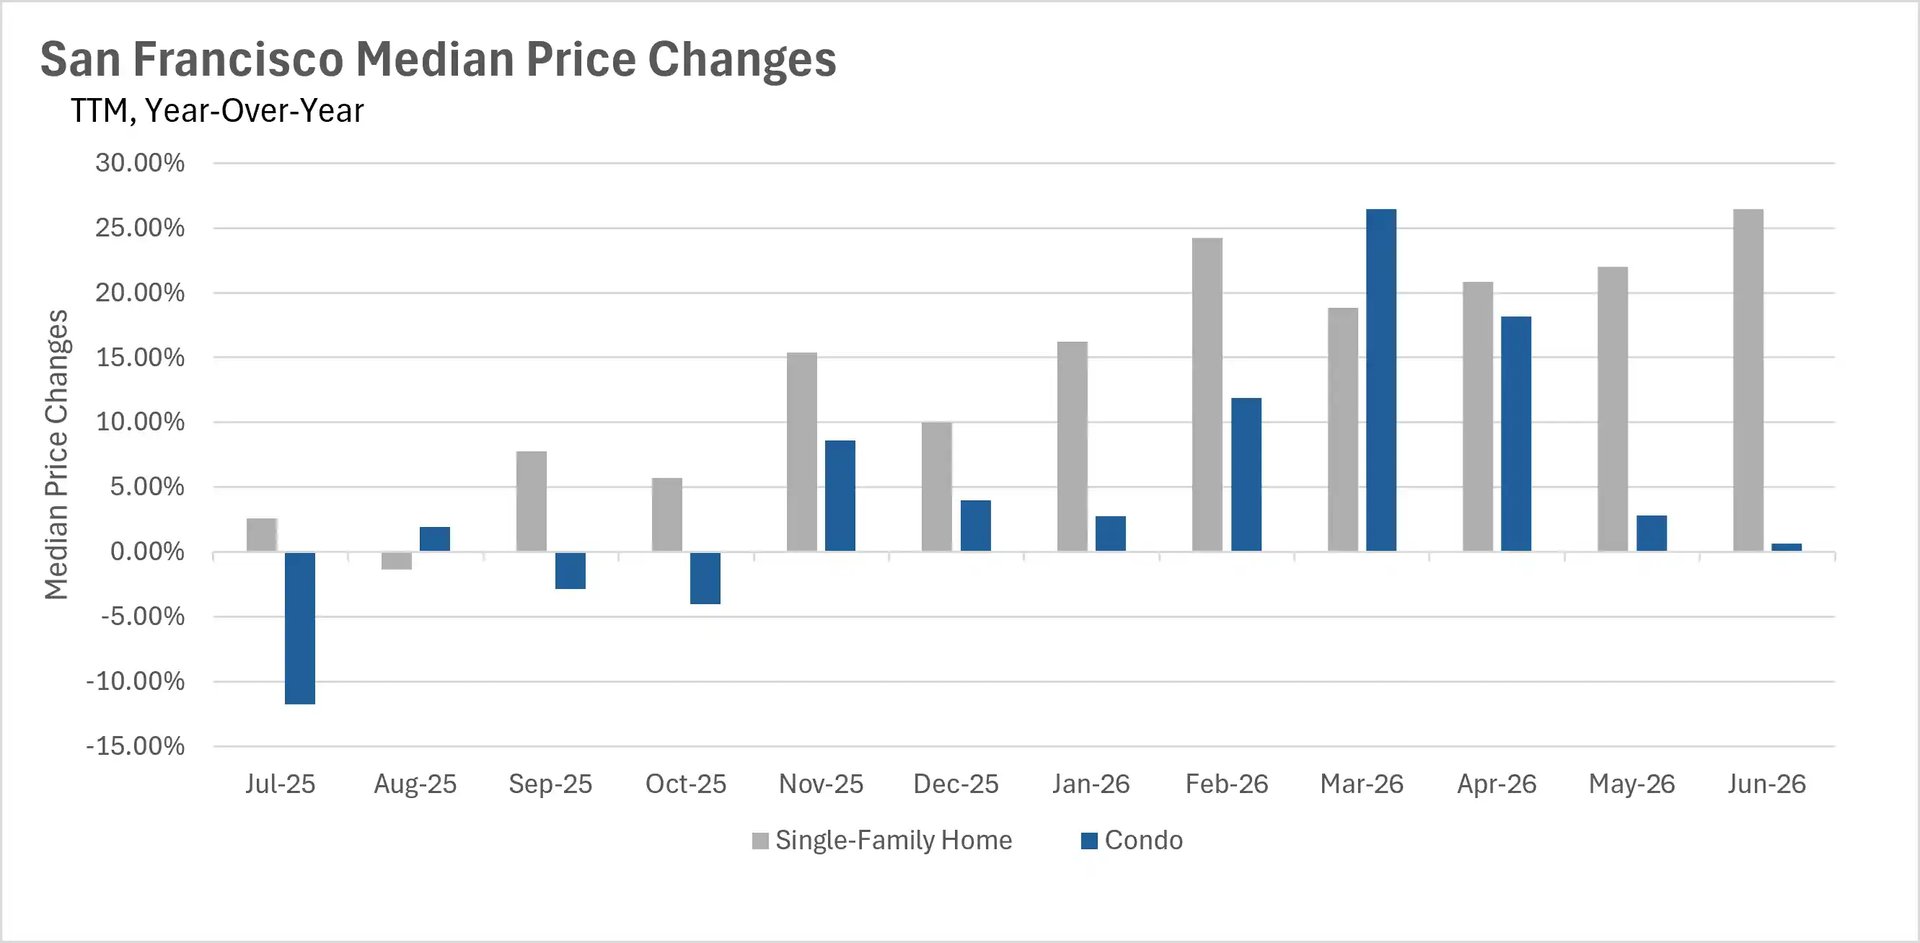
June brought broad-based price appreciation to much of the Bay Area, headlined by San Francisco's extraordinary 26.47% year-over-year surge in single-family home median sale price to $2,150,000. Competition in San Francisco has reached unprecedented levels, with the average single-family home selling for more than 26% over the original asking price. In Silicon Valley, San Mateo County posted an impressive 7.50% gain to $2,150,000, and Santa Cruz County ticked up 1.12% to $1,350,000, though Santa Clara County declined 8.57% to $1,920,000.

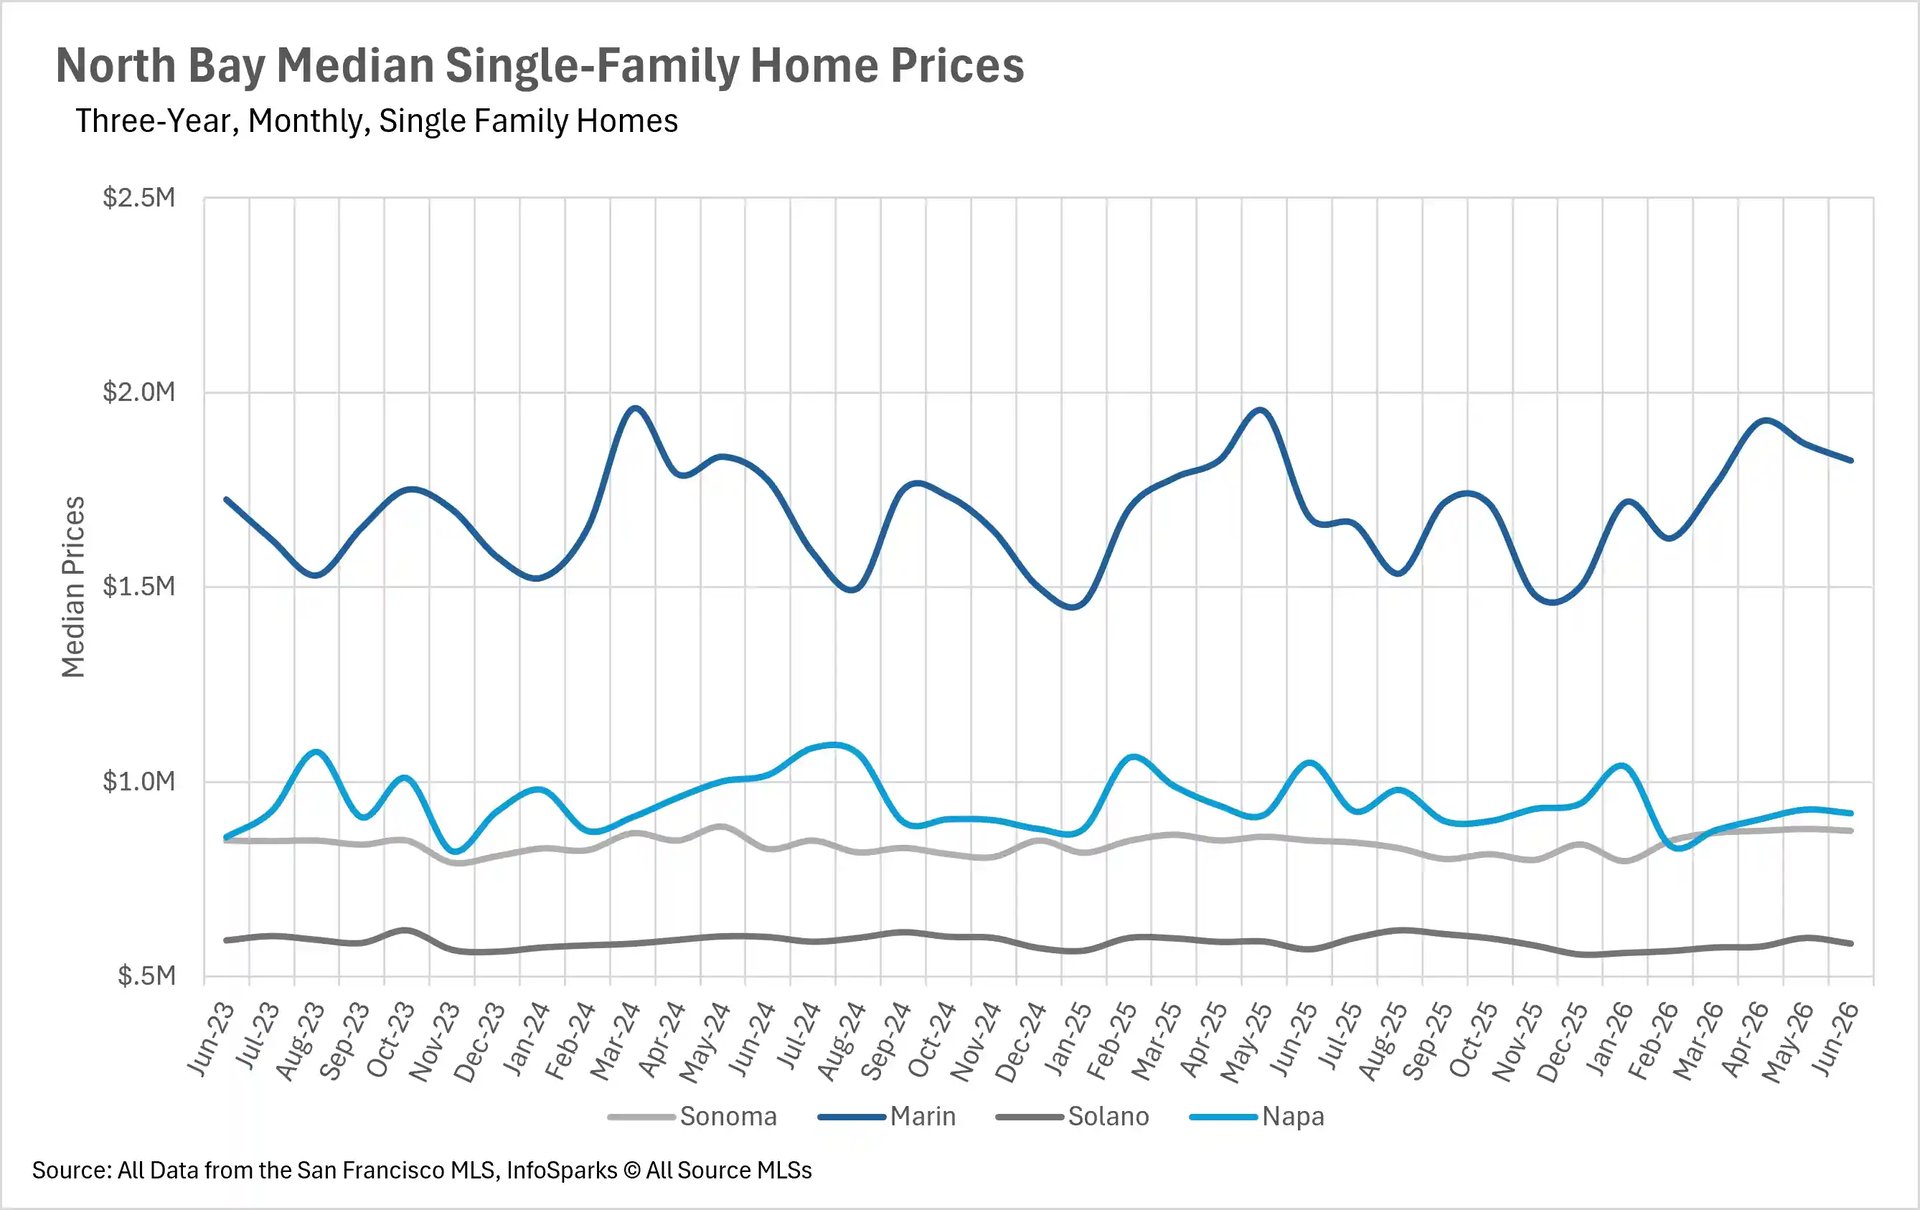
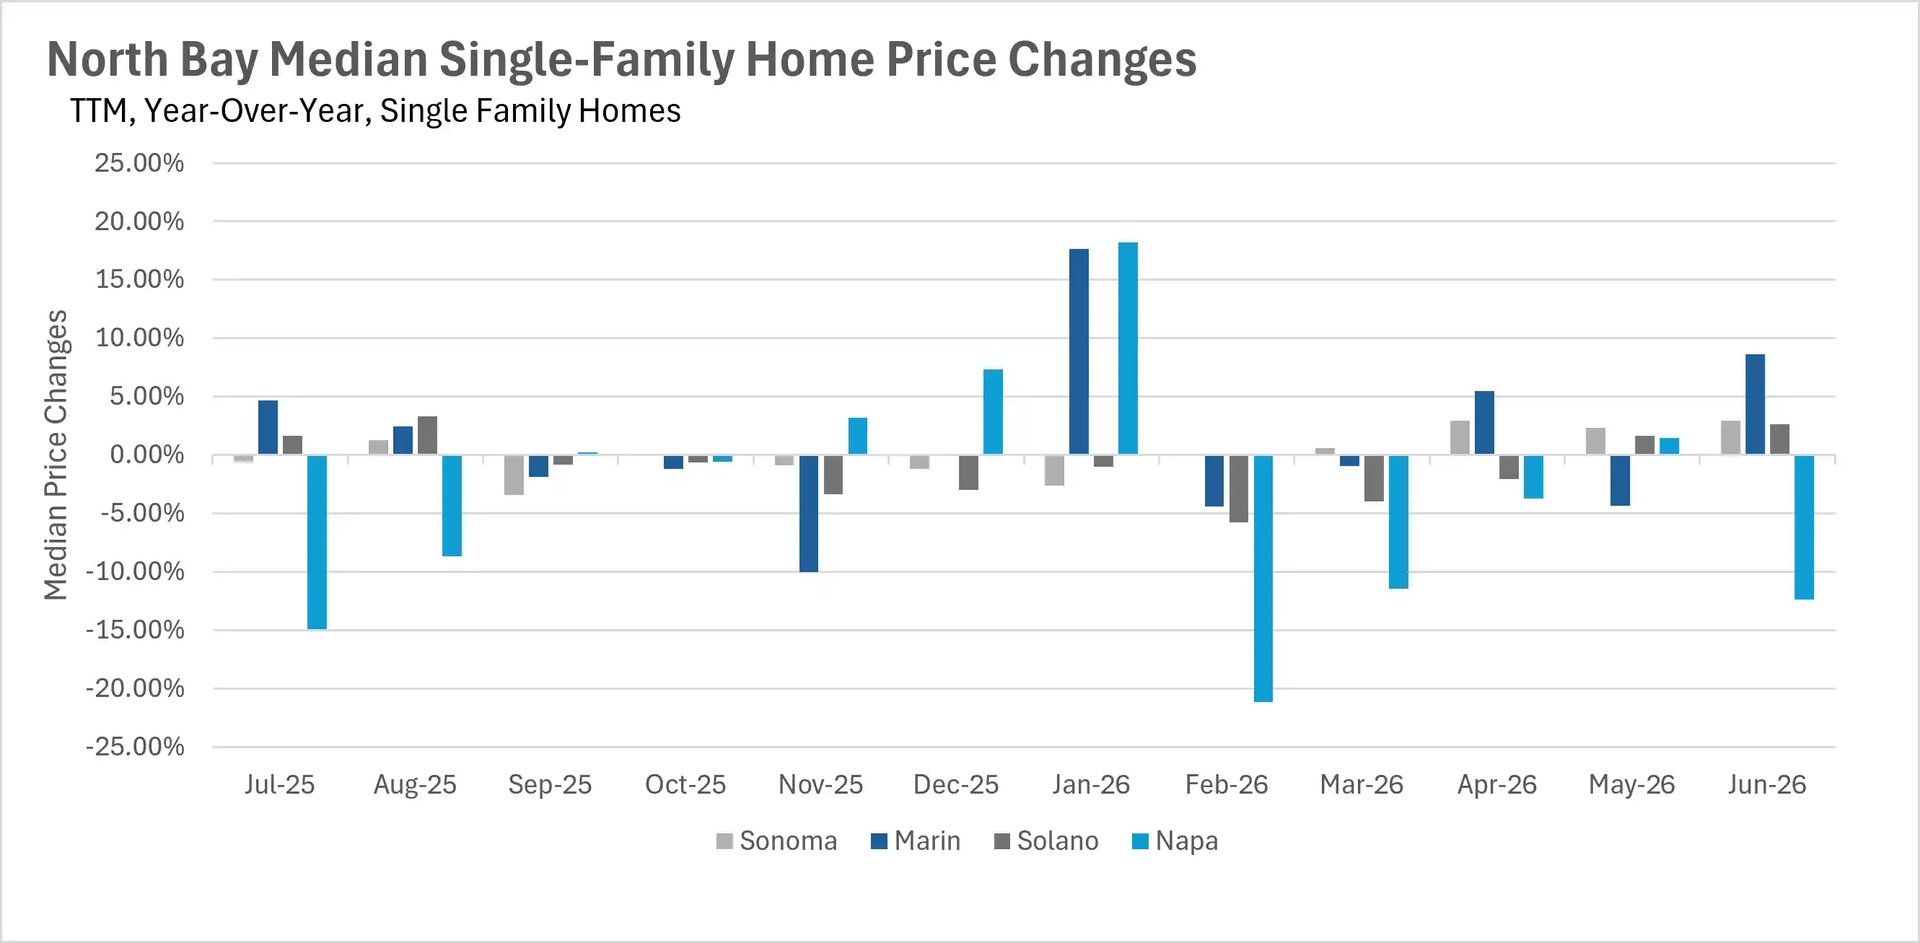
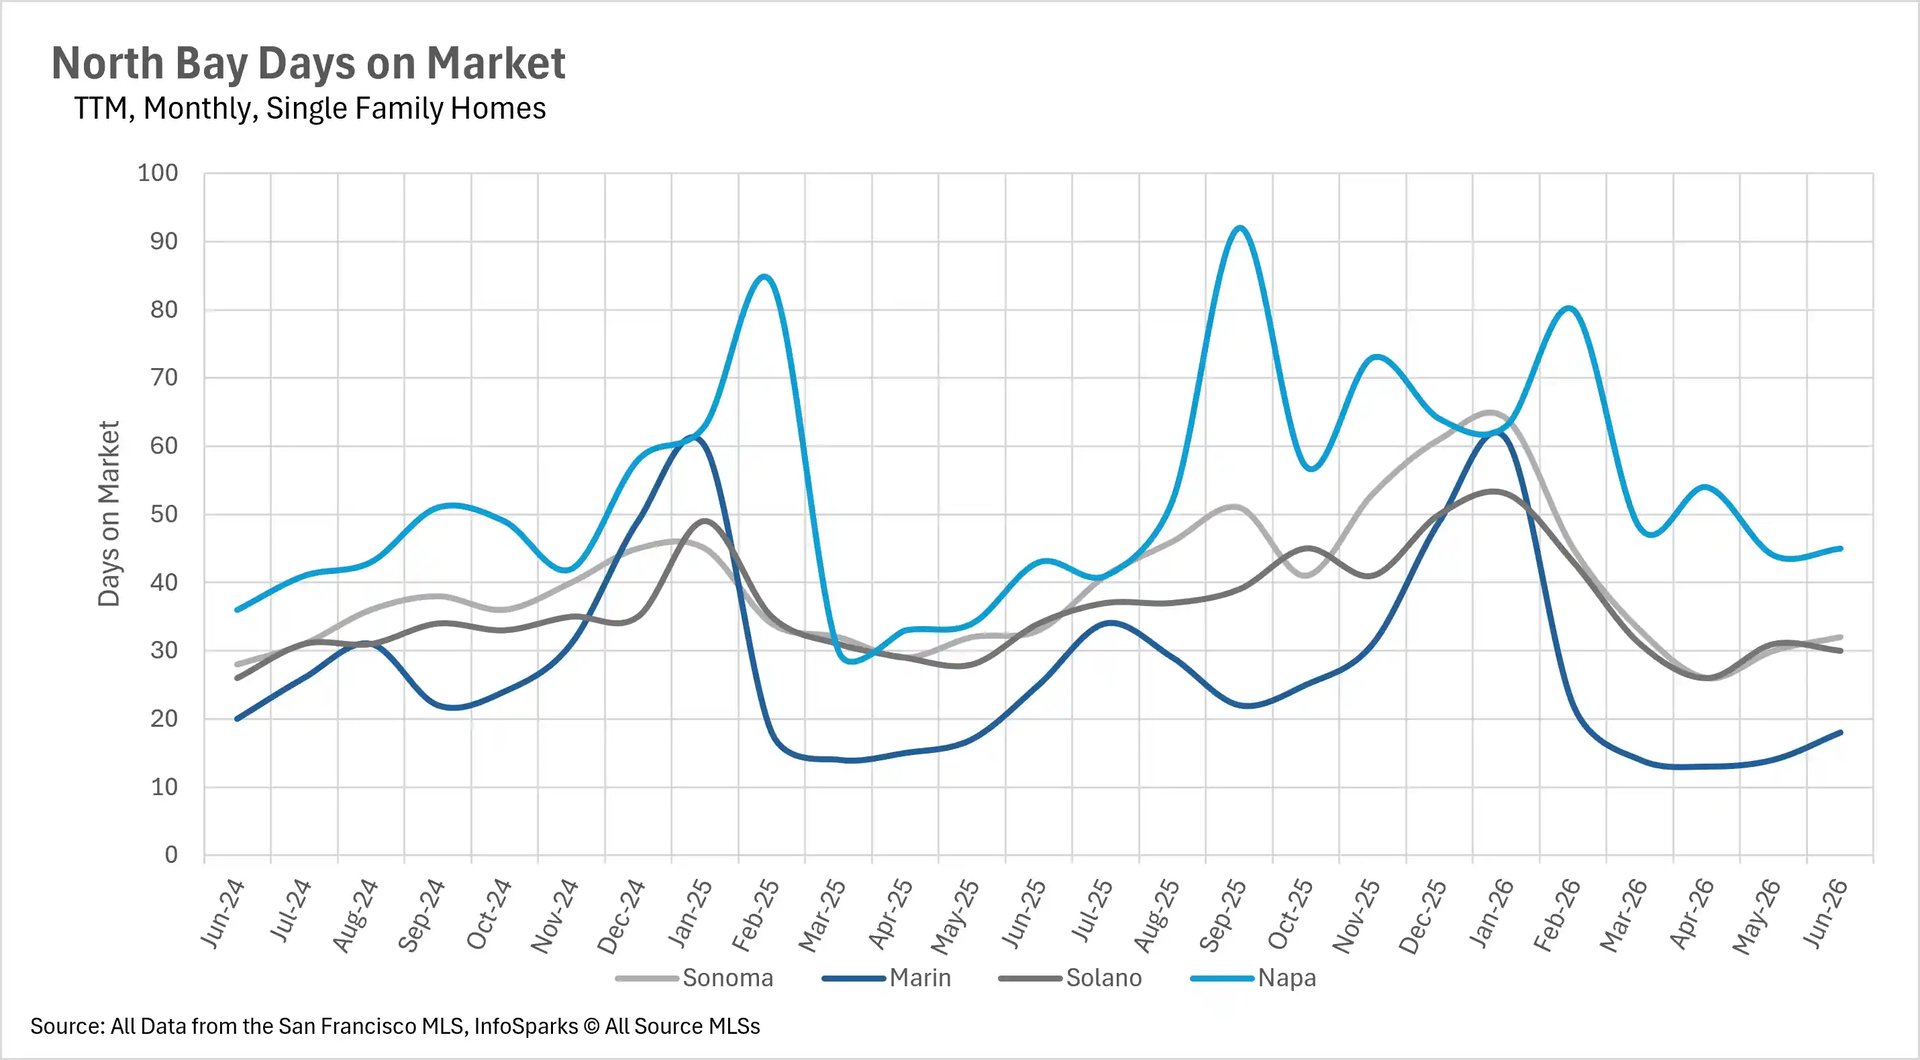
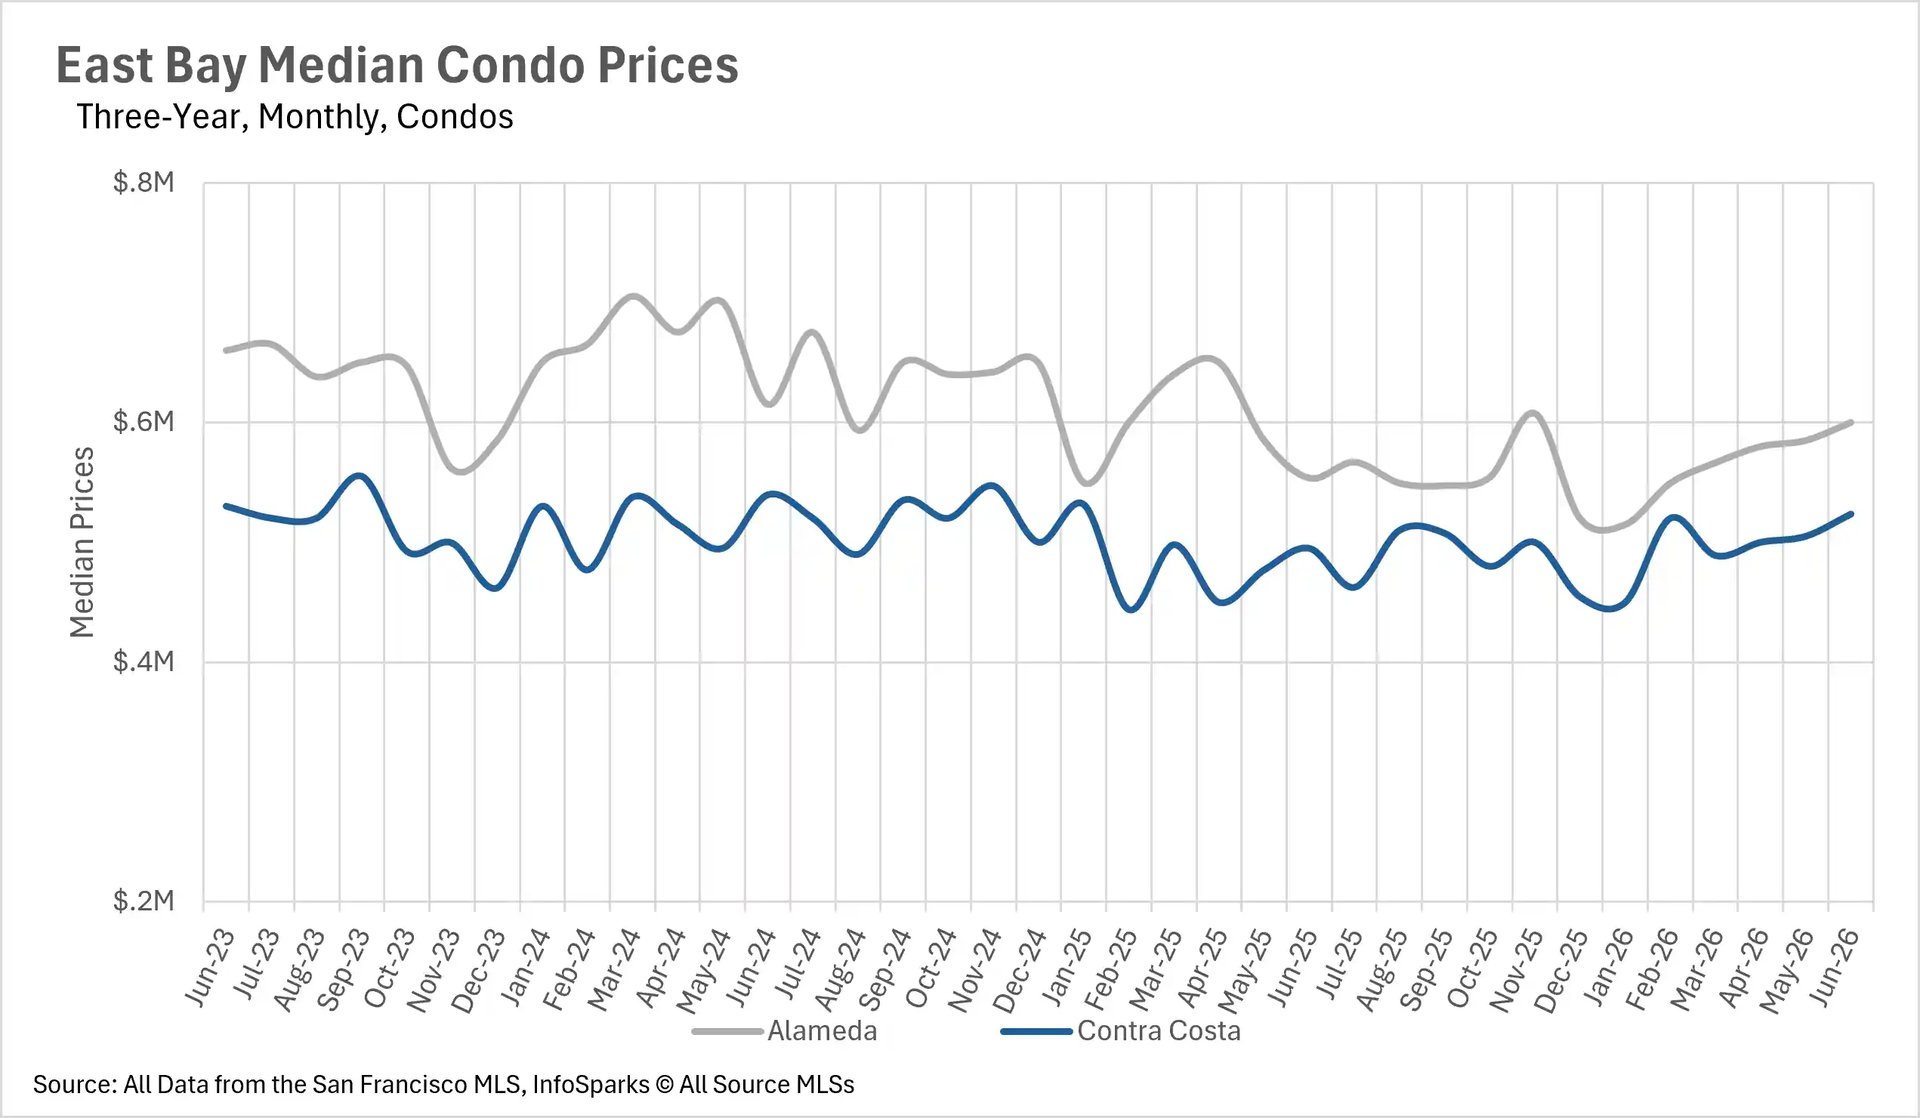
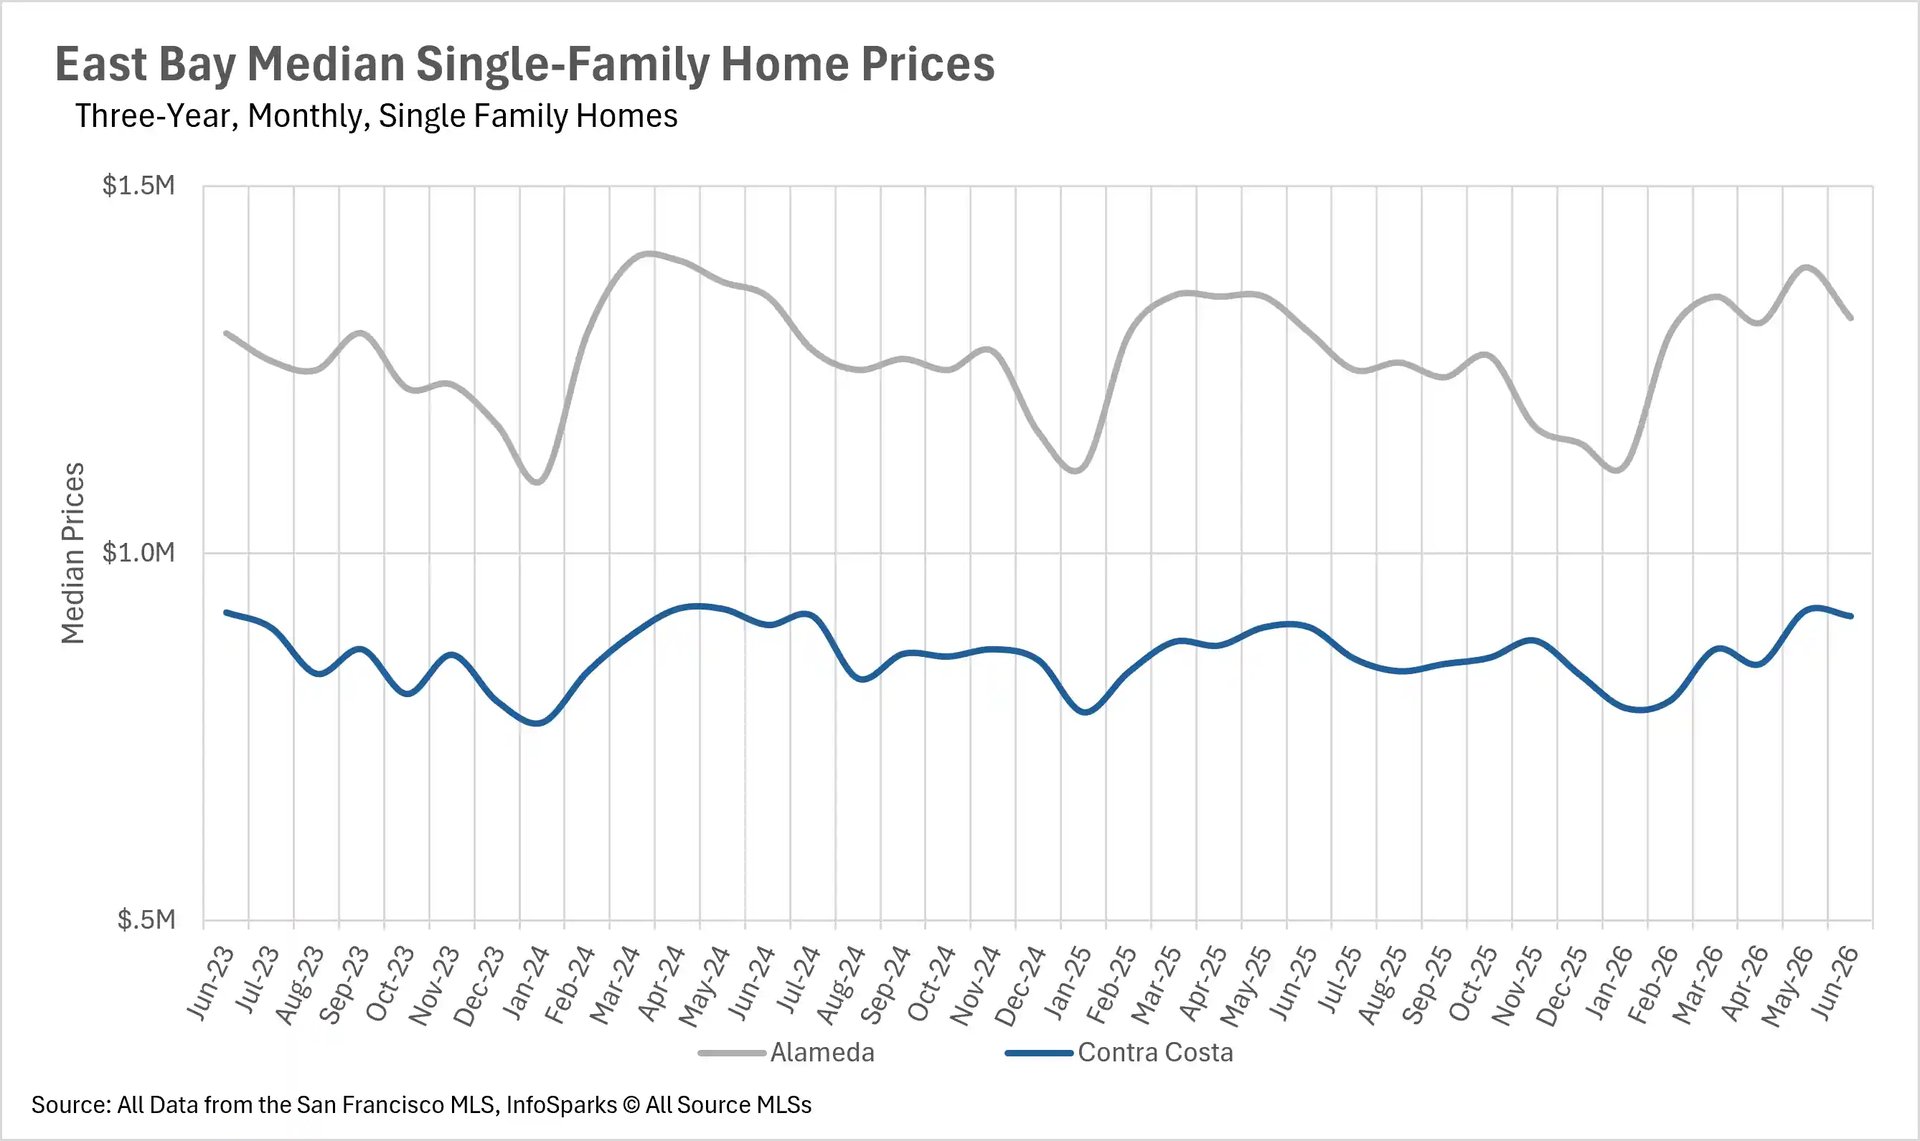
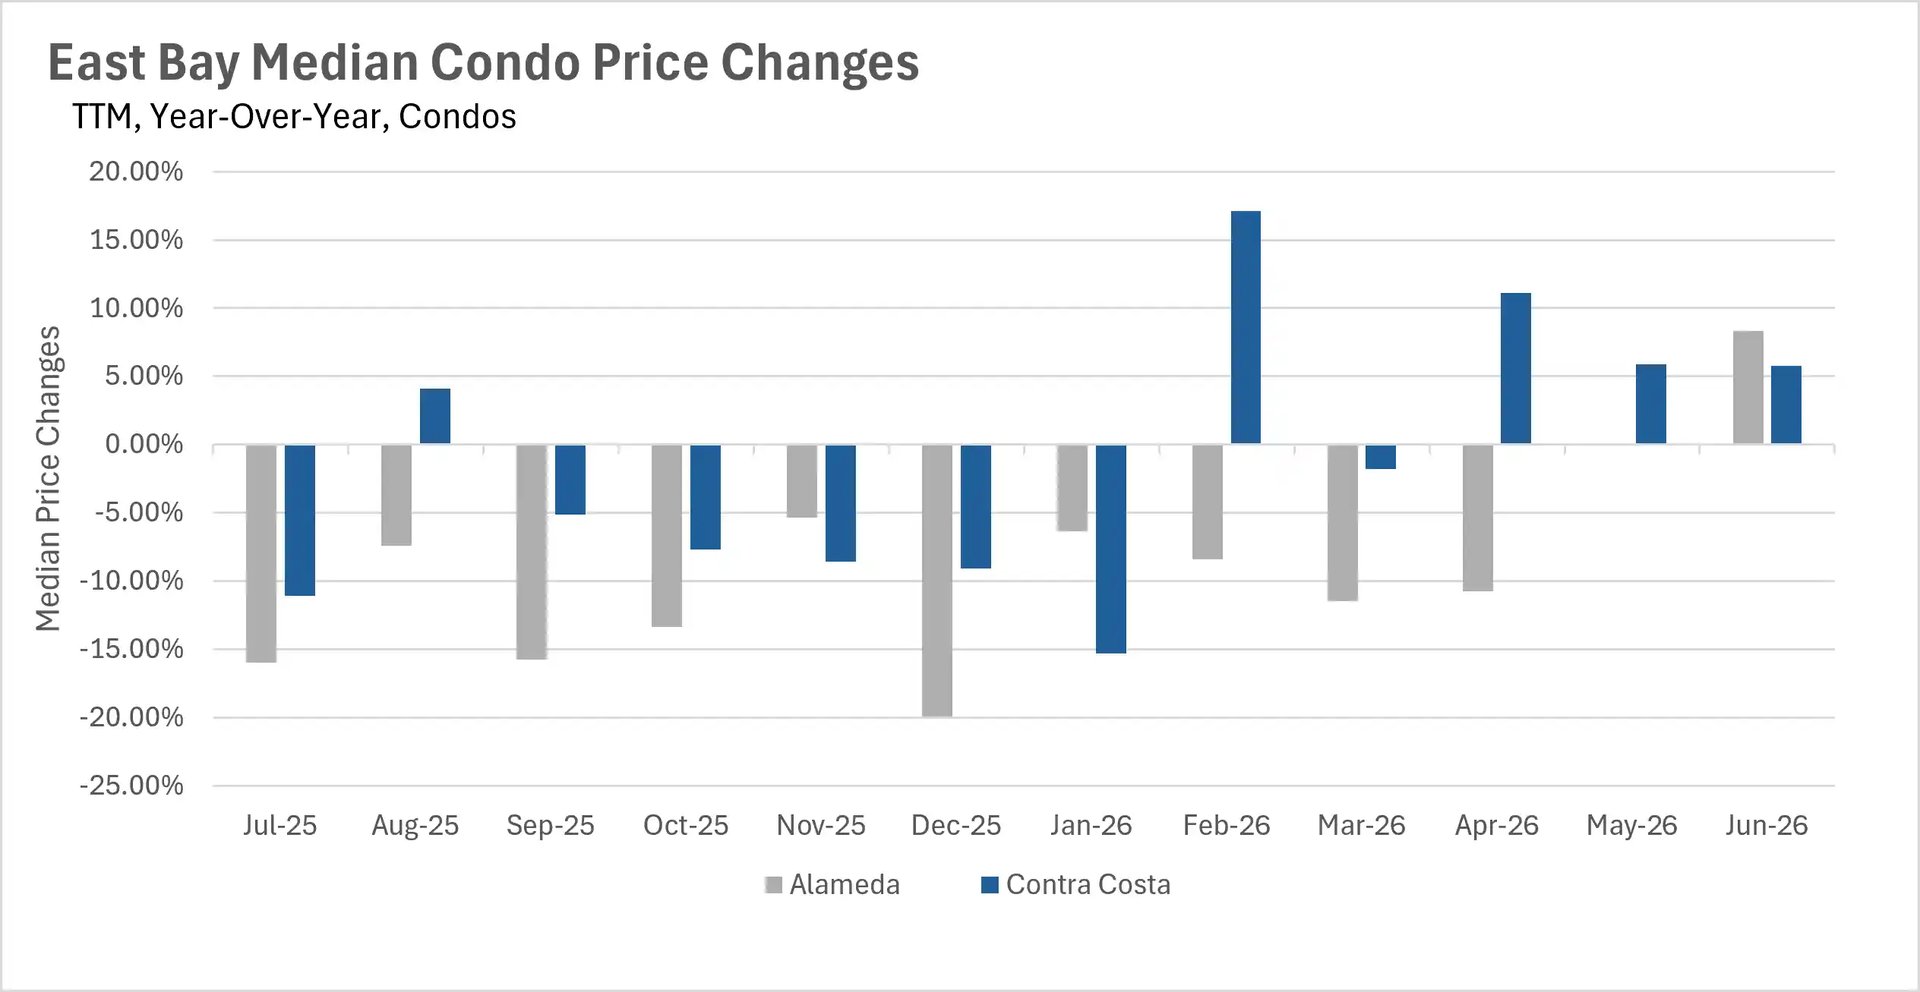
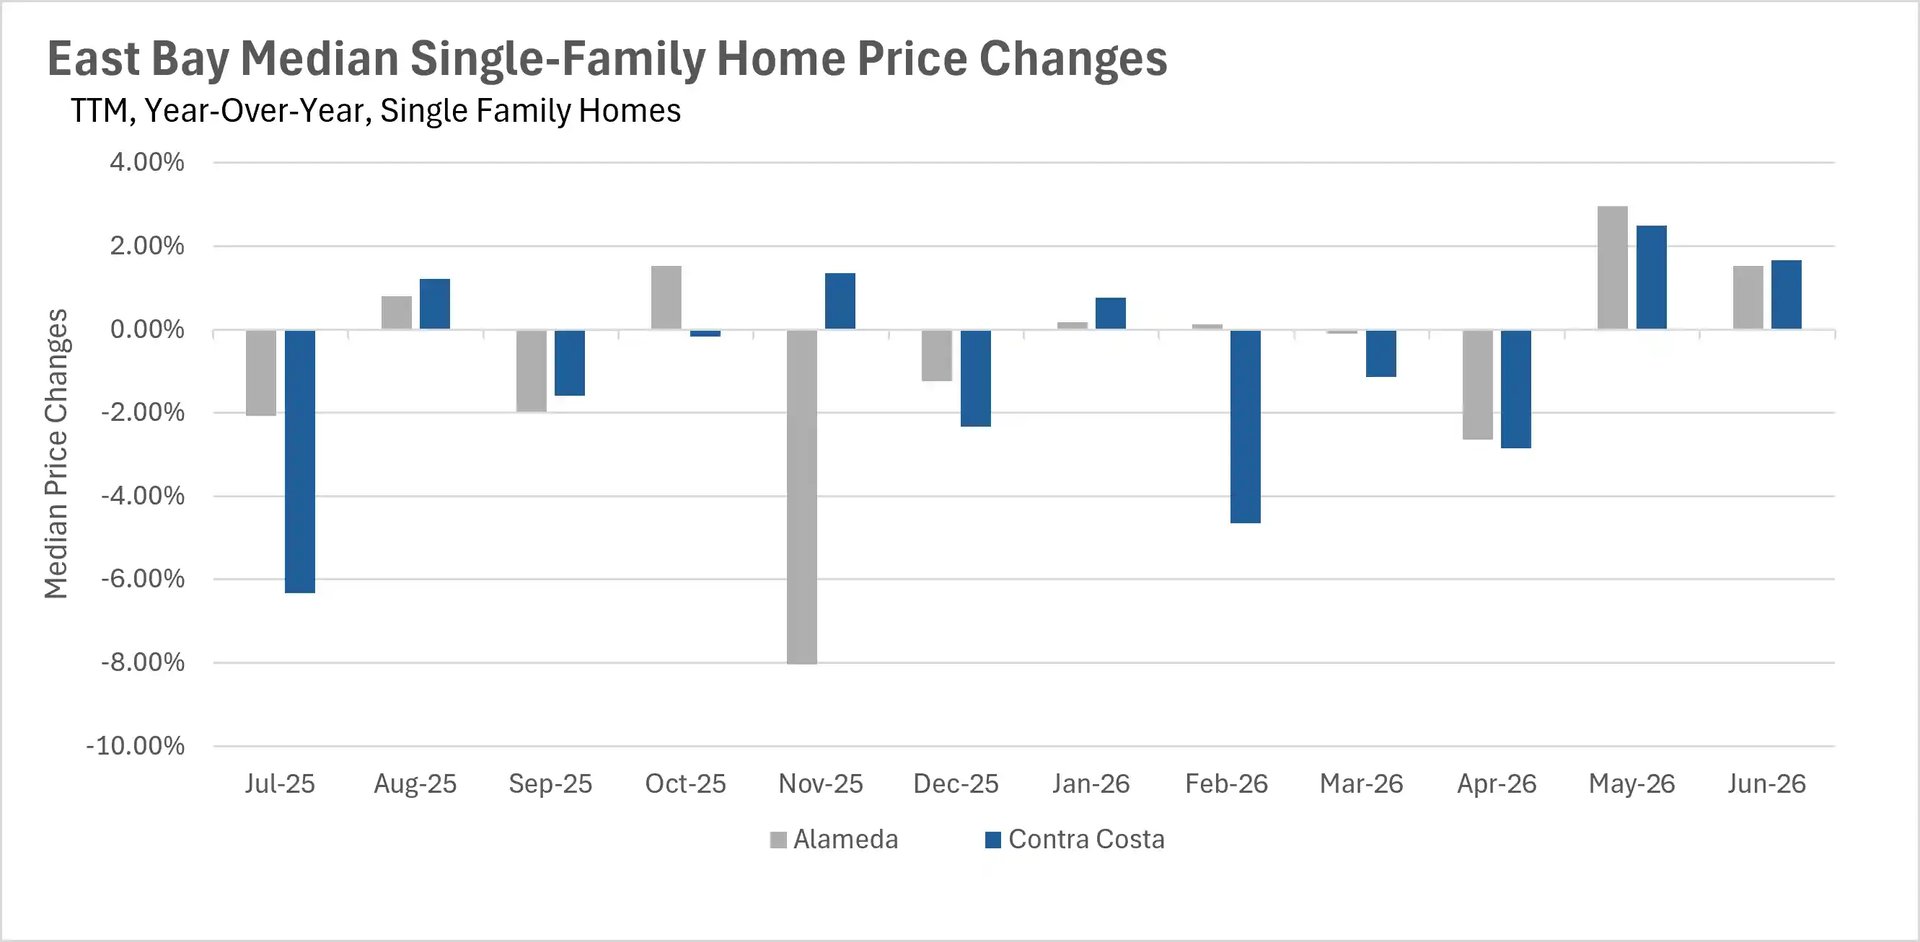
The North Bay saw strong gains in three of four counties, with Marin County climbing 8.63% to $1,825,000, Sonoma County up 2.94% to $875,000, and Solano County gaining 2.63% to $585,000, while Napa County continued to struggle with a 12.38% decline. The East Bay delivered continued good news, with Alameda and Contra Costa County single-family homes up 1.52% and 1.67%, respectively. Perhaps the most notable development this month is the remarkable turnaround in the East Bay condo market, where Alameda County condos surged 8.35% year-over-year and Contra Costa County condos gained 5.76%, a dramatic reversal from the double-digit declines we were seeing just a few months ago.

The Bay Area's inventory crisis has reached its most severe point yet

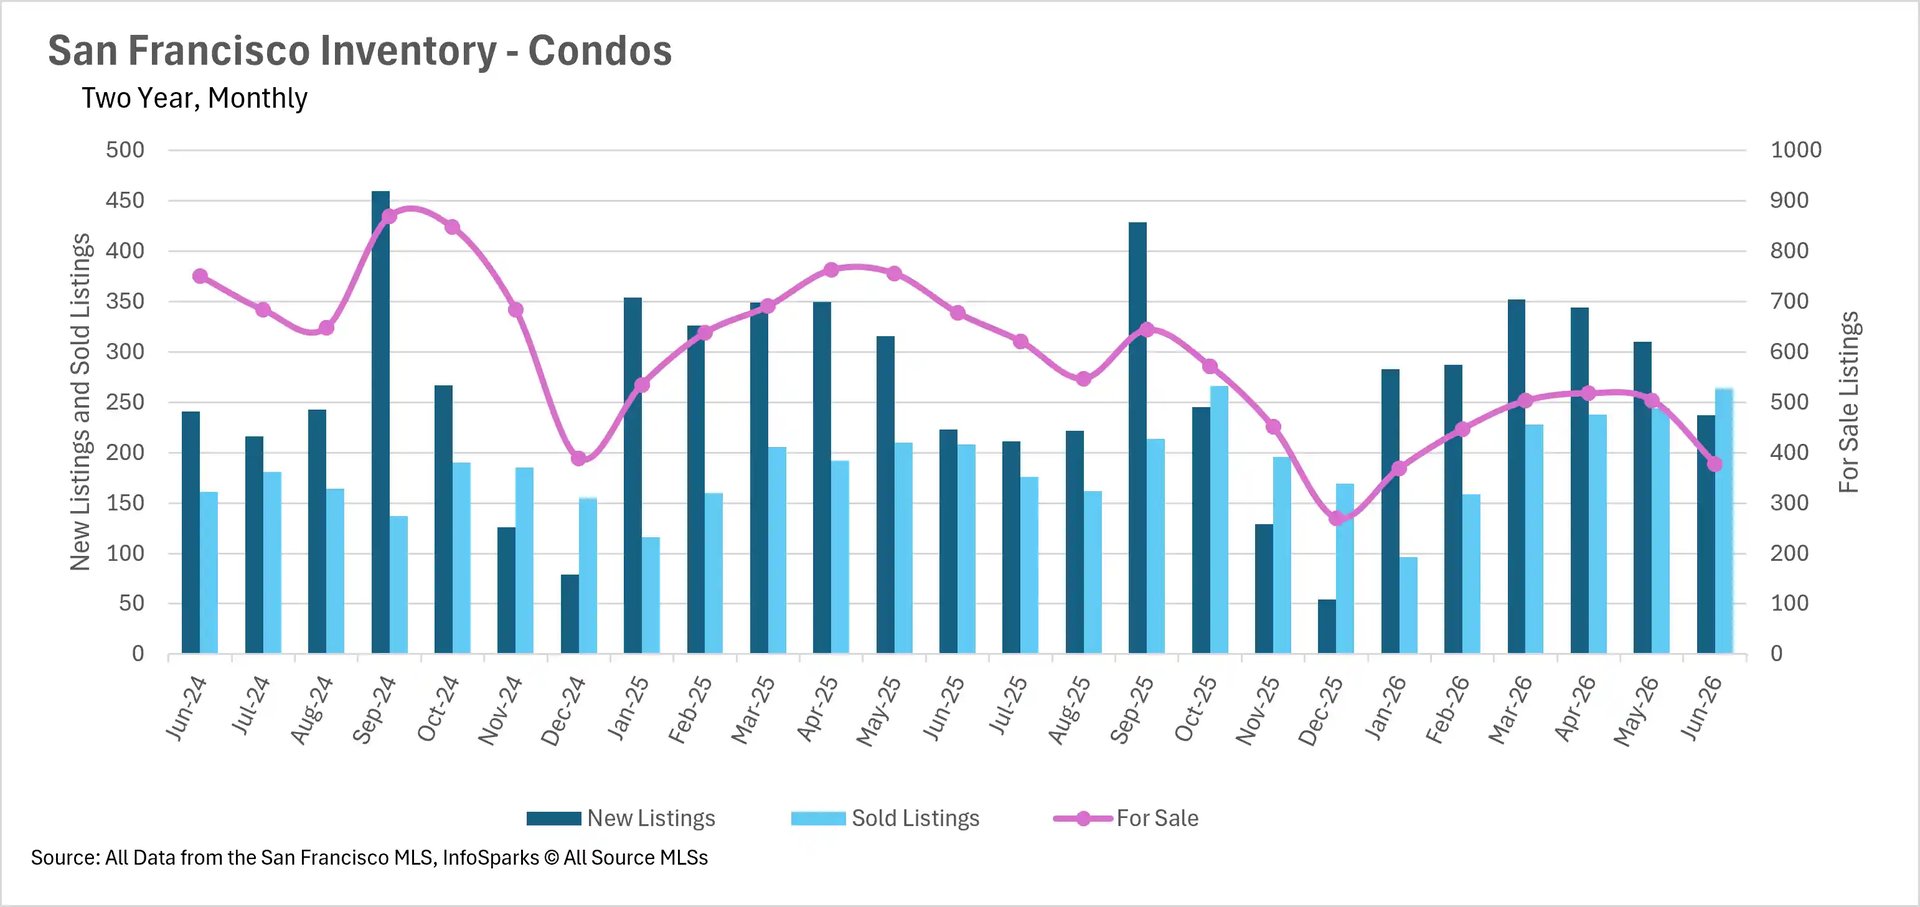
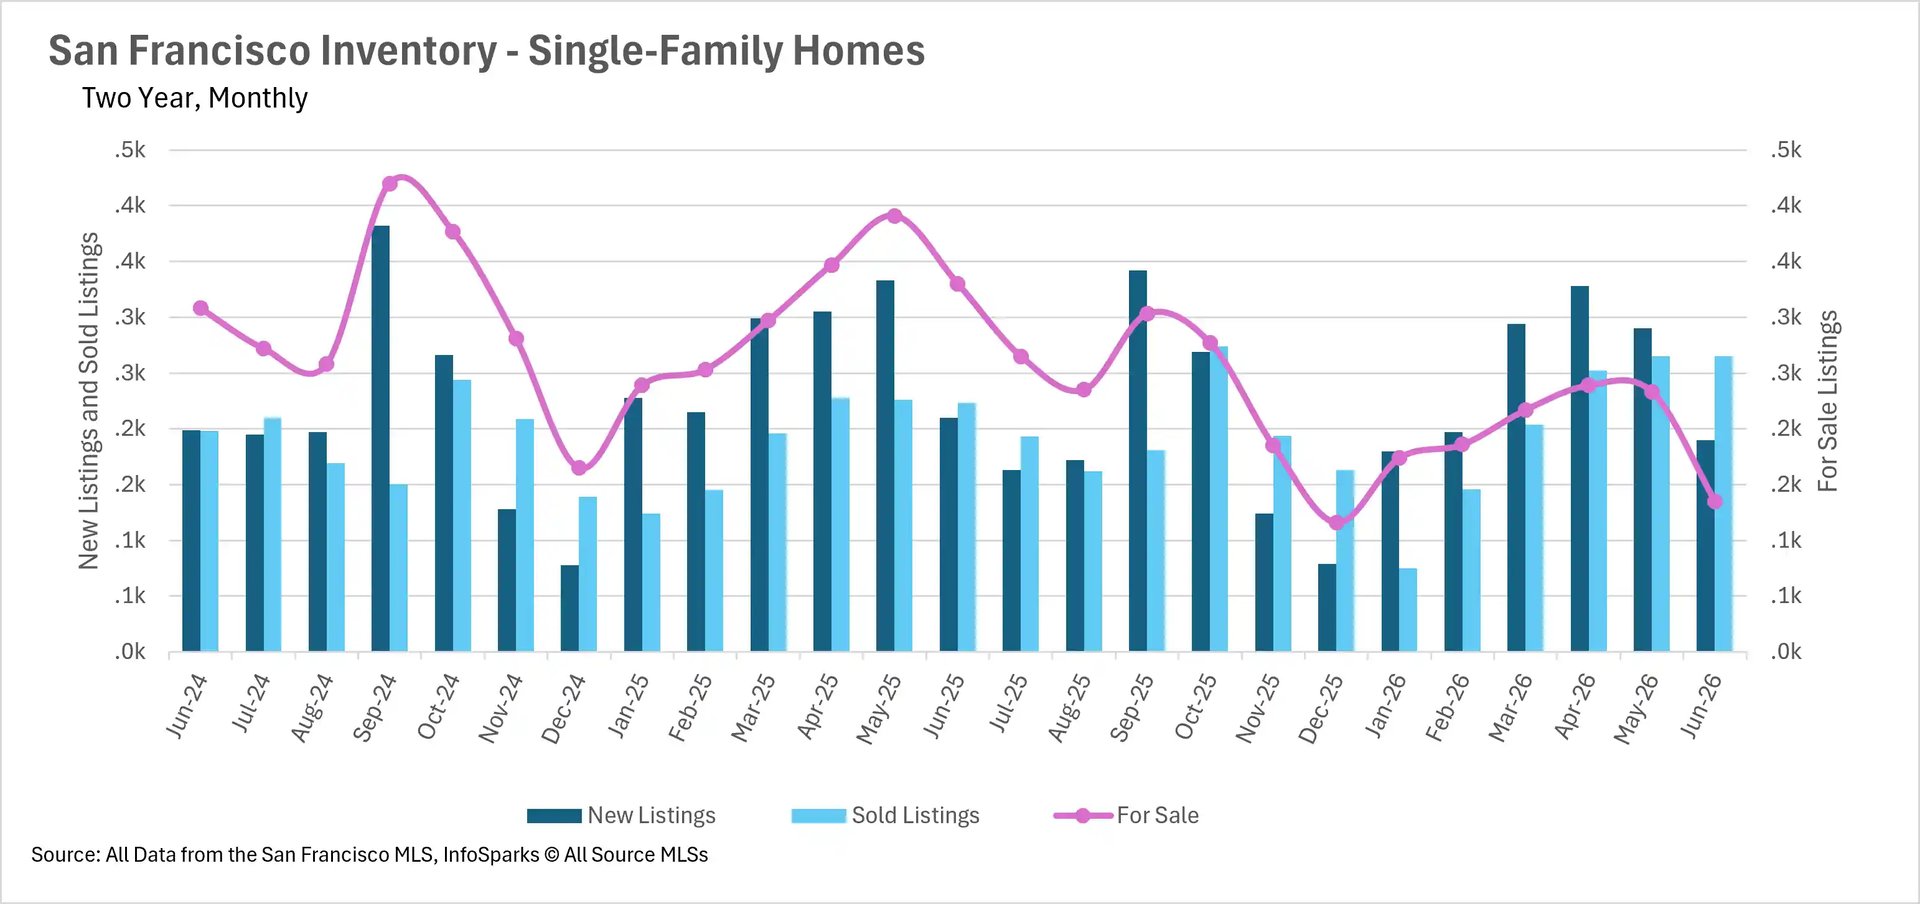
Inventory levels across the Bay Area have dropped to some of the lowest levels we've seen in recent memory. San Francisco is experiencing the most extreme shortage, with single-family inventory down a staggering 59.09% year-over-year, leaving just 135 single-family homes available for sale in the entire city. Condo inventory in San Francisco has also been cut dramatically, down 44.25% to just 378 units, meaning there are barely 500 total homes on the market citywide.

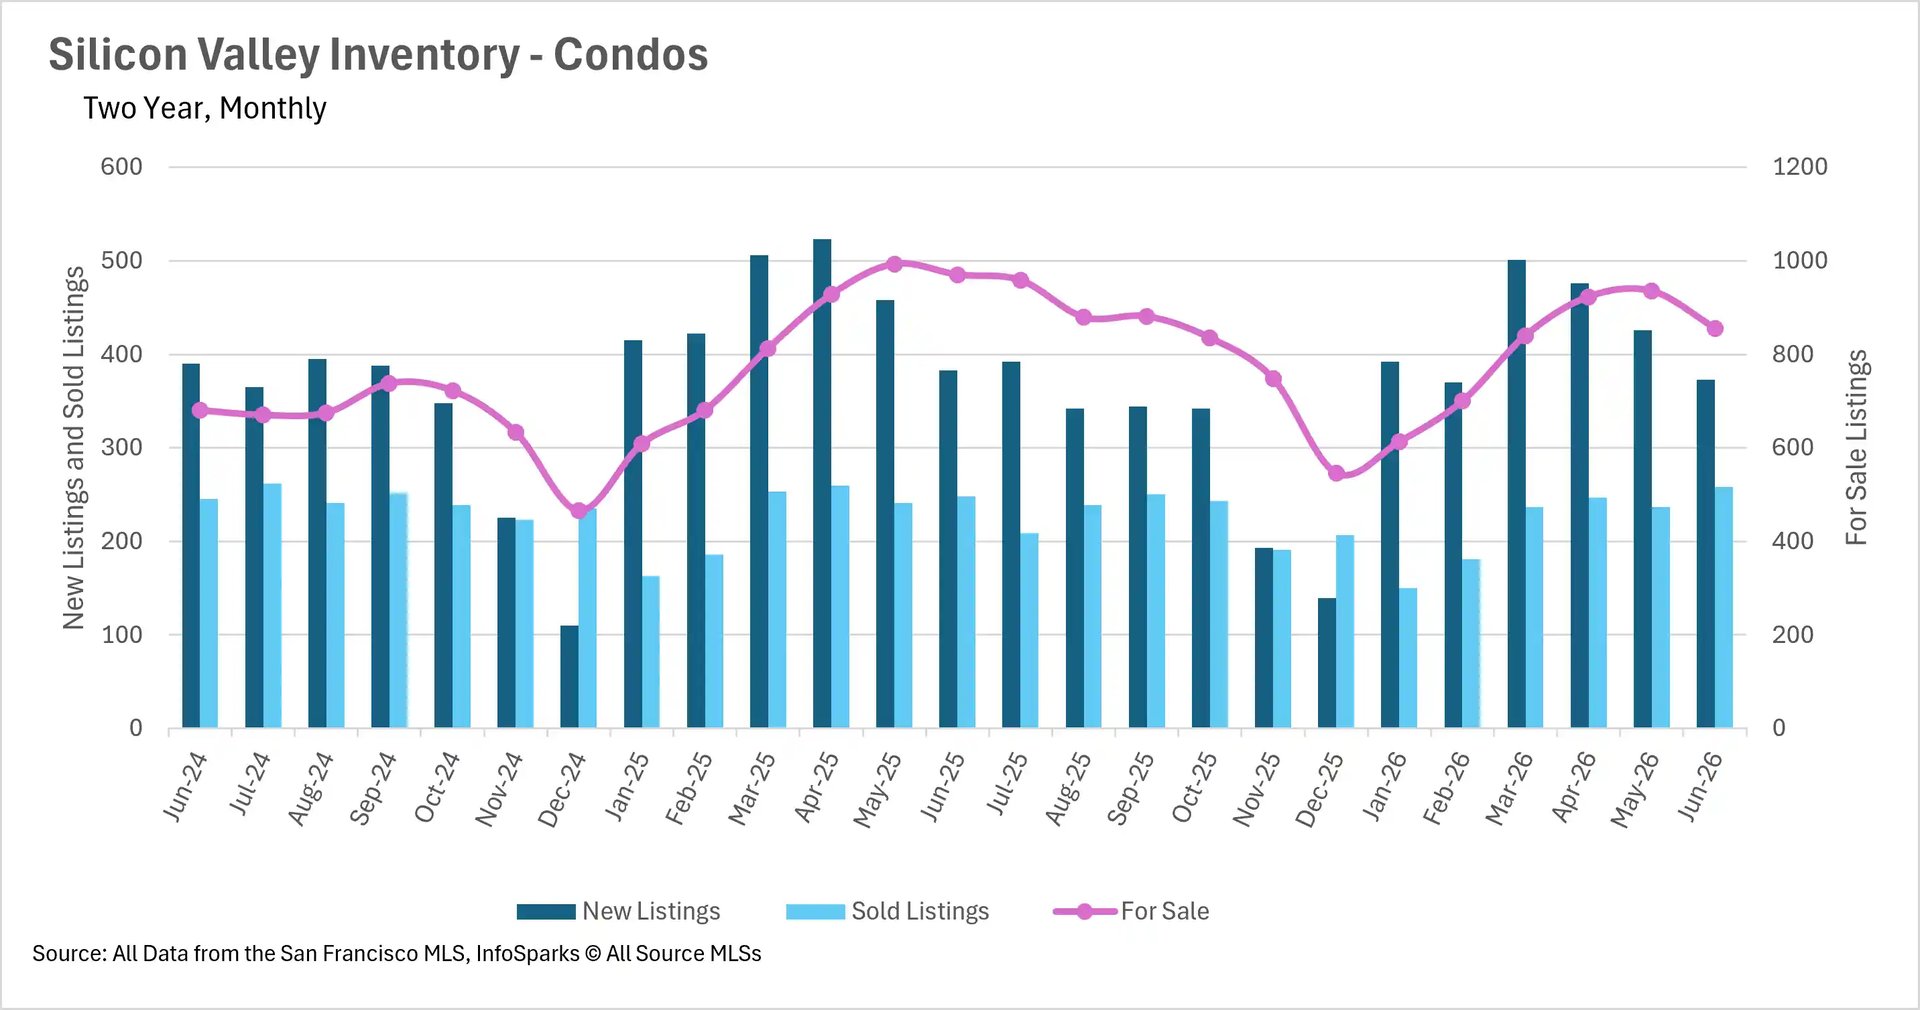
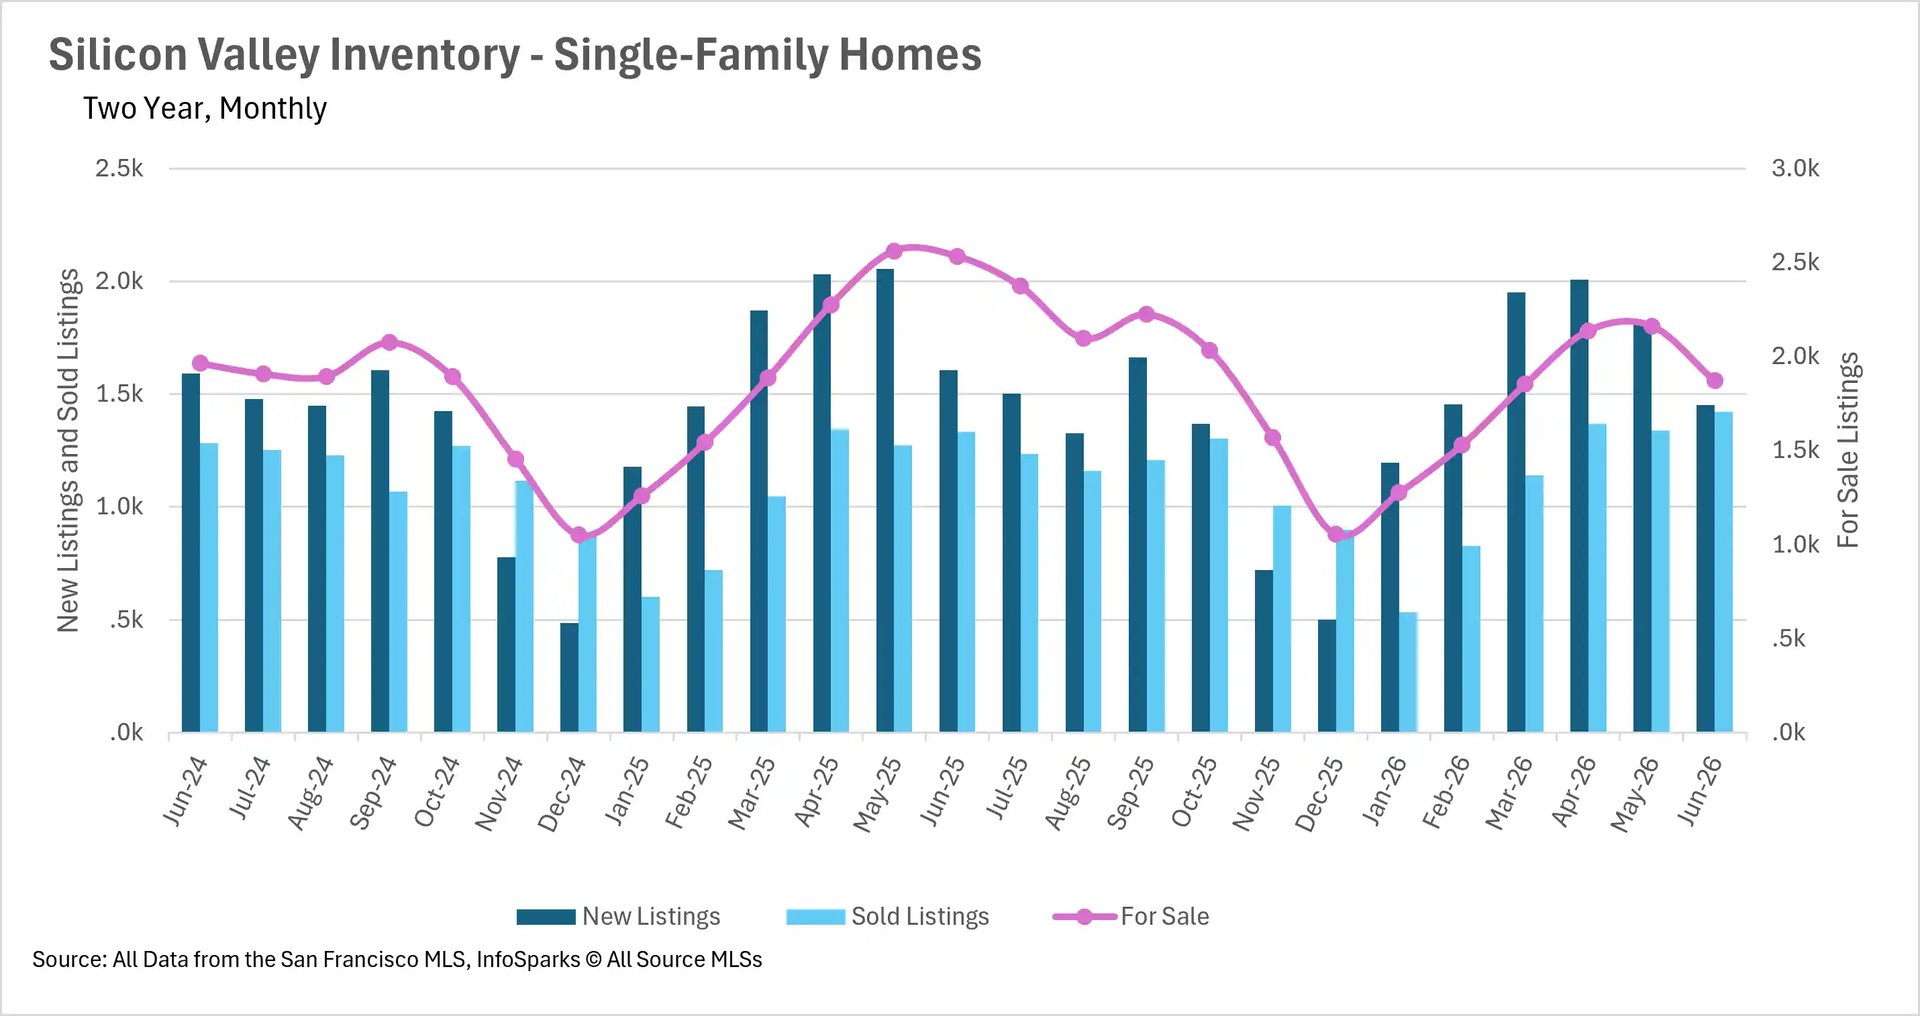
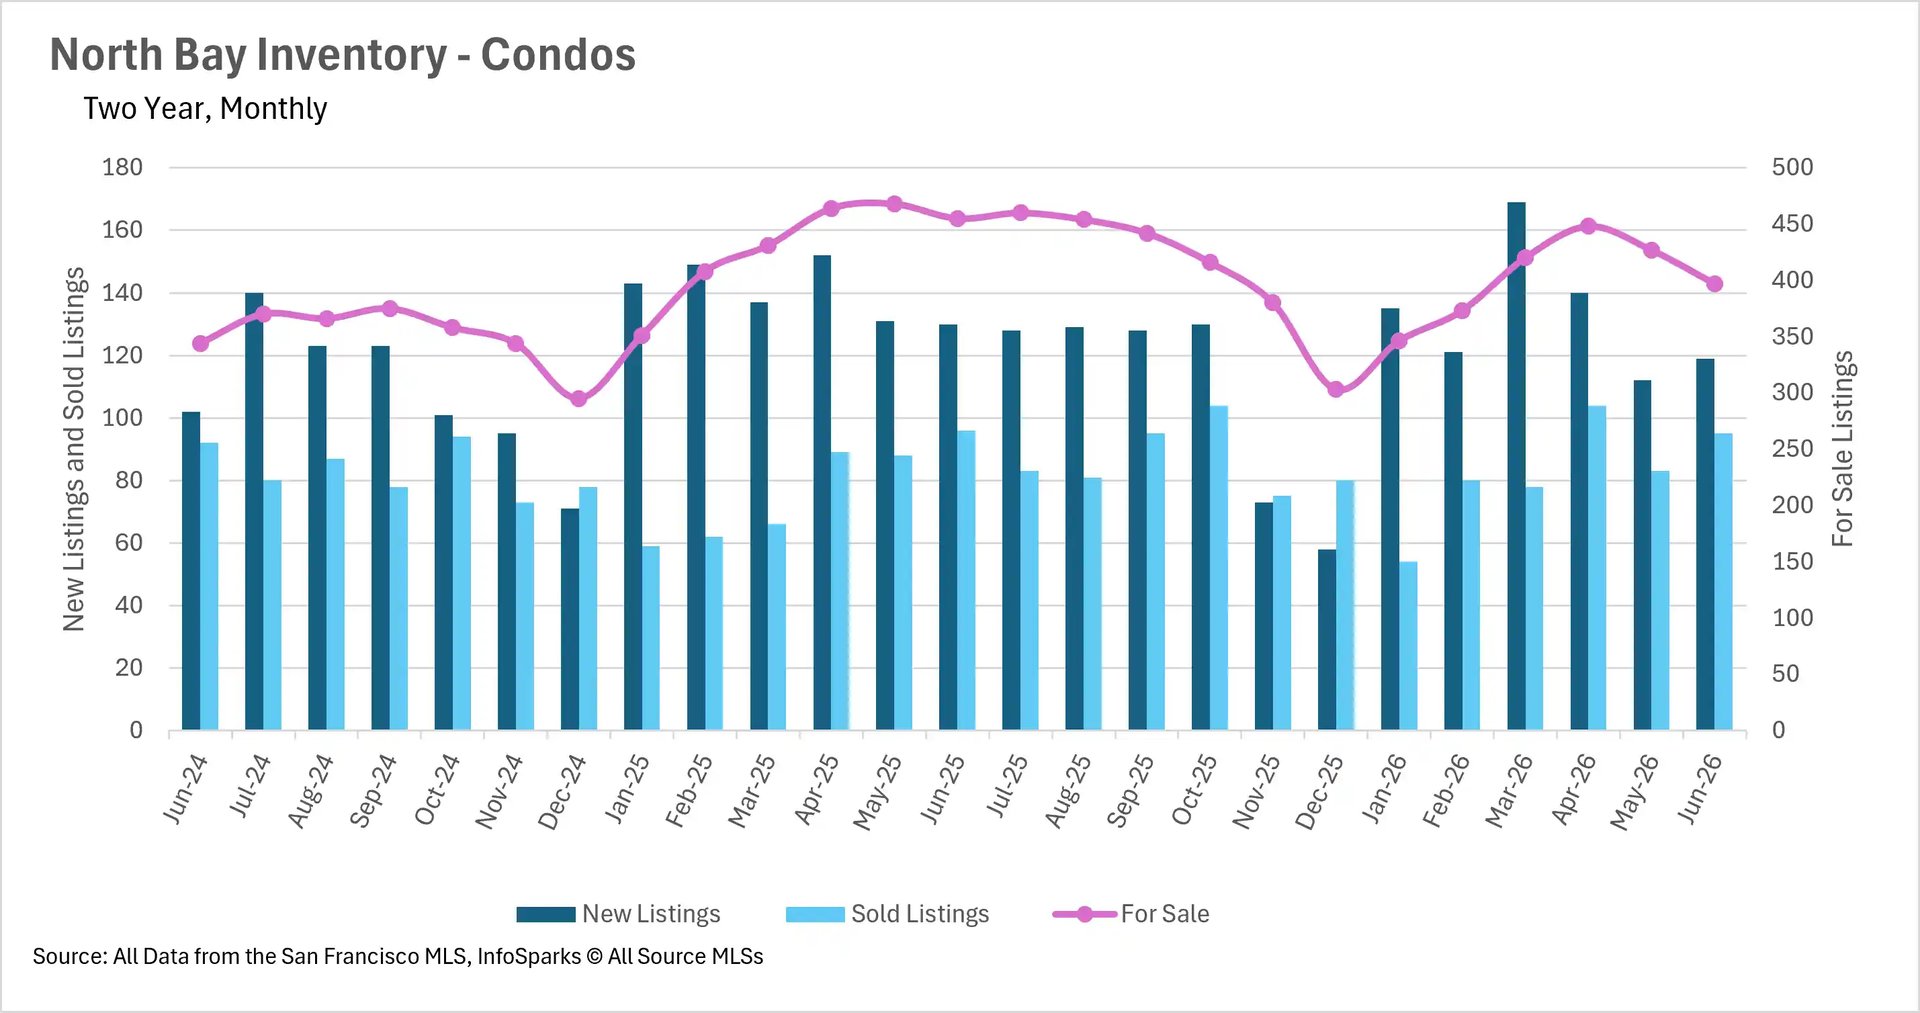
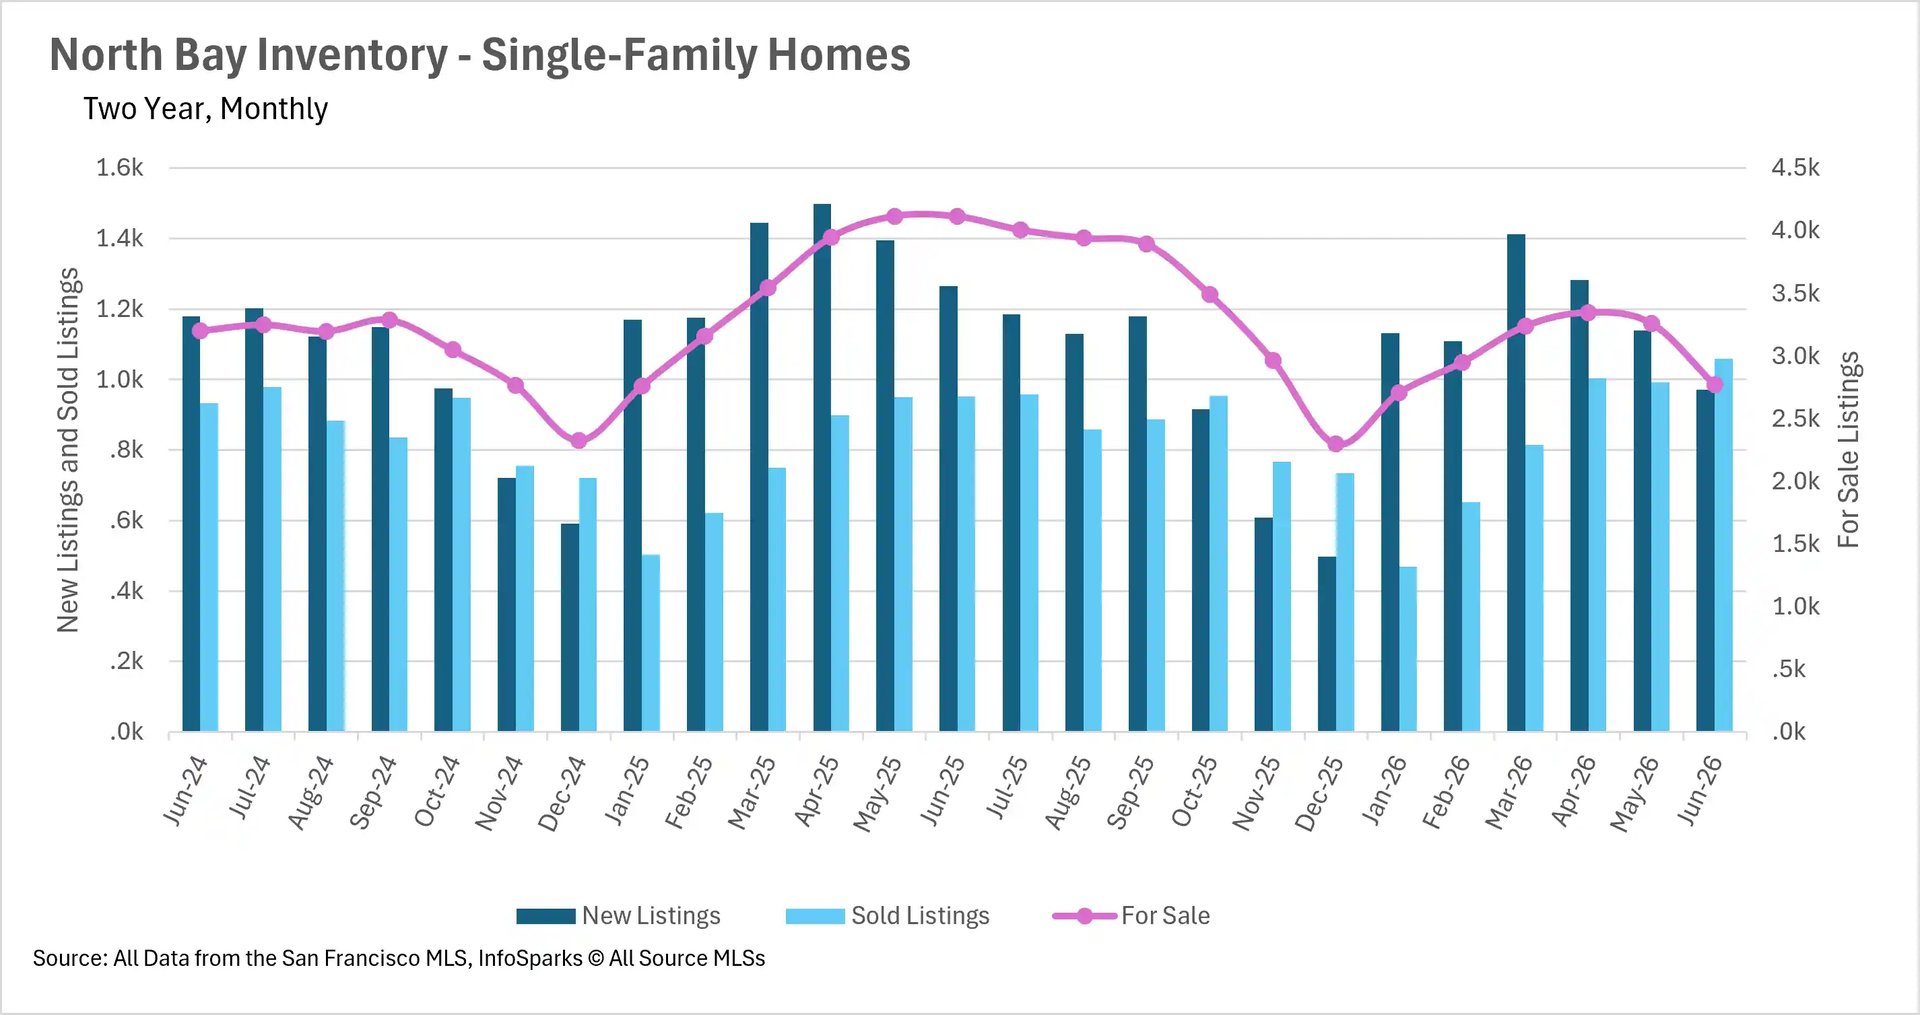
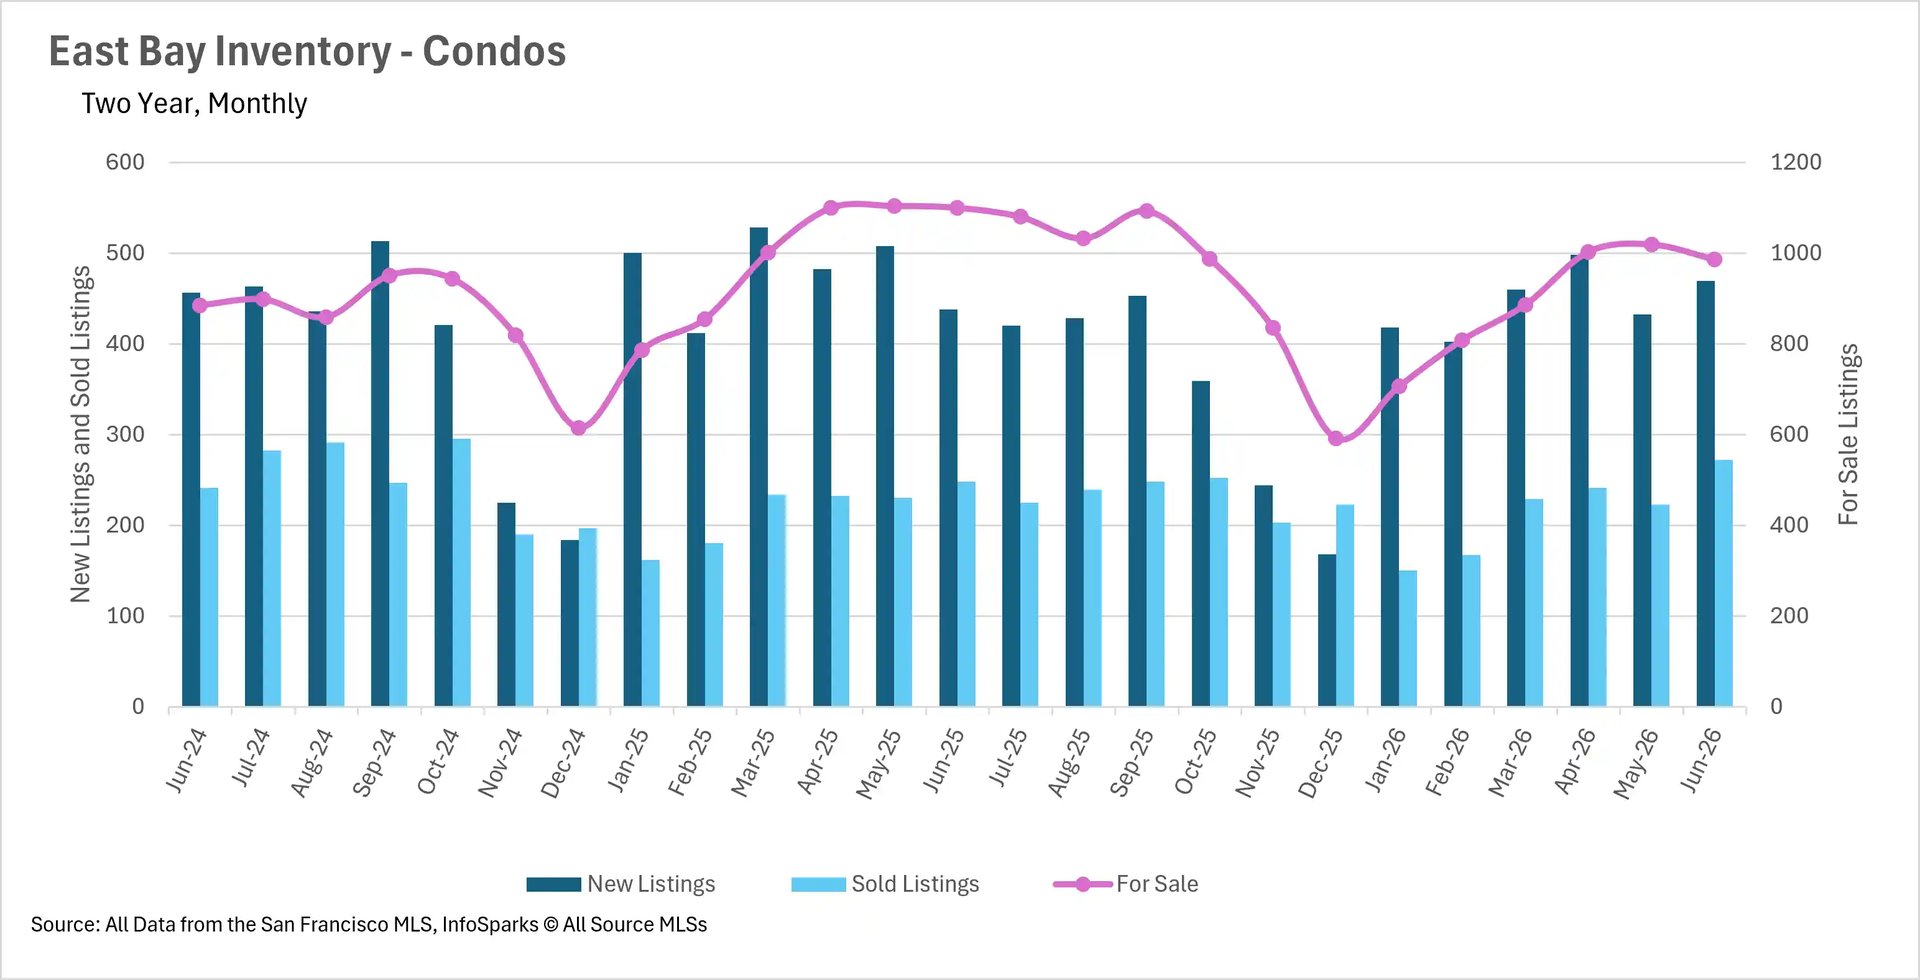
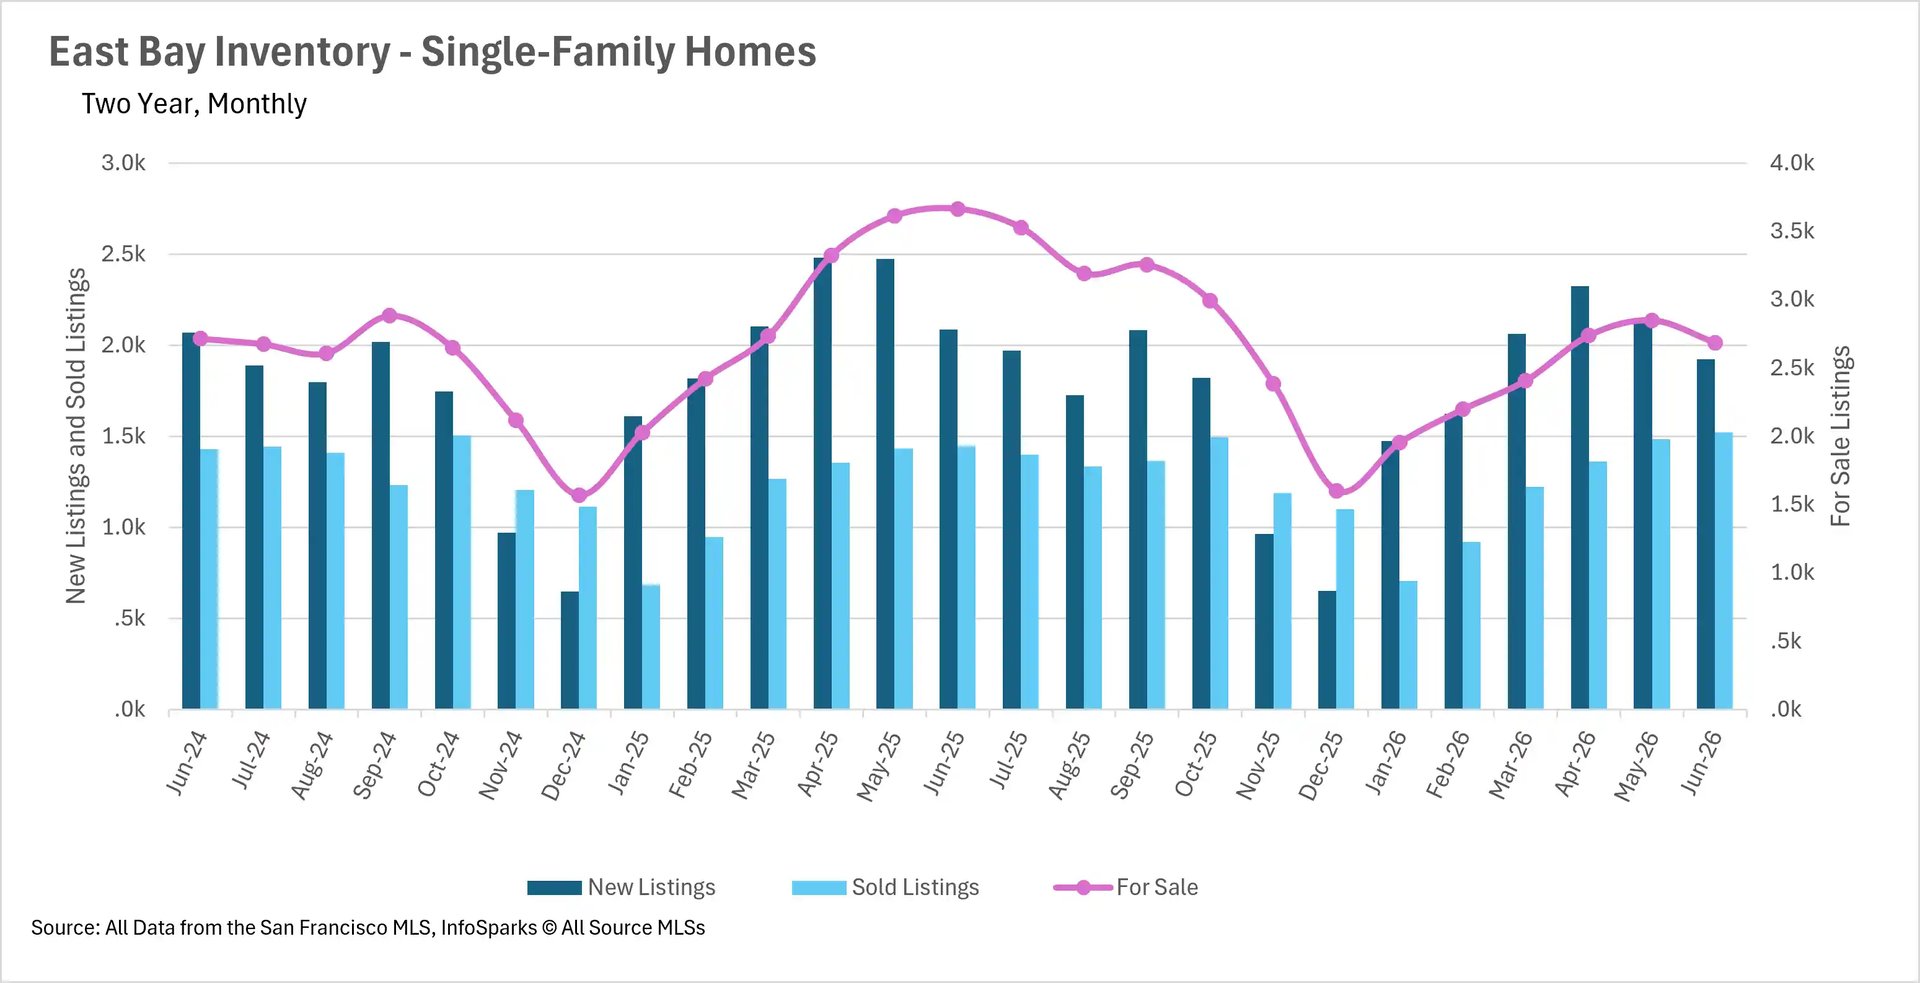
Silicon Valley's inventory has also plummeted, with single-family homes down 26.15% and condos down 11.75%. The North Bay is down 32.66% for single-family homes and 12.75% for condos, while the East Bay has seen single-family inventory decline by 26.79% and condo inventory drop by 10.36%. New listings remain well below last year's pace in most markets, with the North Bay down 23.22% and Silicon Valley down 9.59%. However, sales activity has emerged in several areas, with North Bay single-family sales jumping 11.34% year-over-year and Silicon Valley sold listings up 6.91%, demonstrating that demand continues to absorb whatever supply enters the market.

Single-family homes are selling faster than ever, and the condo market is picking up steam

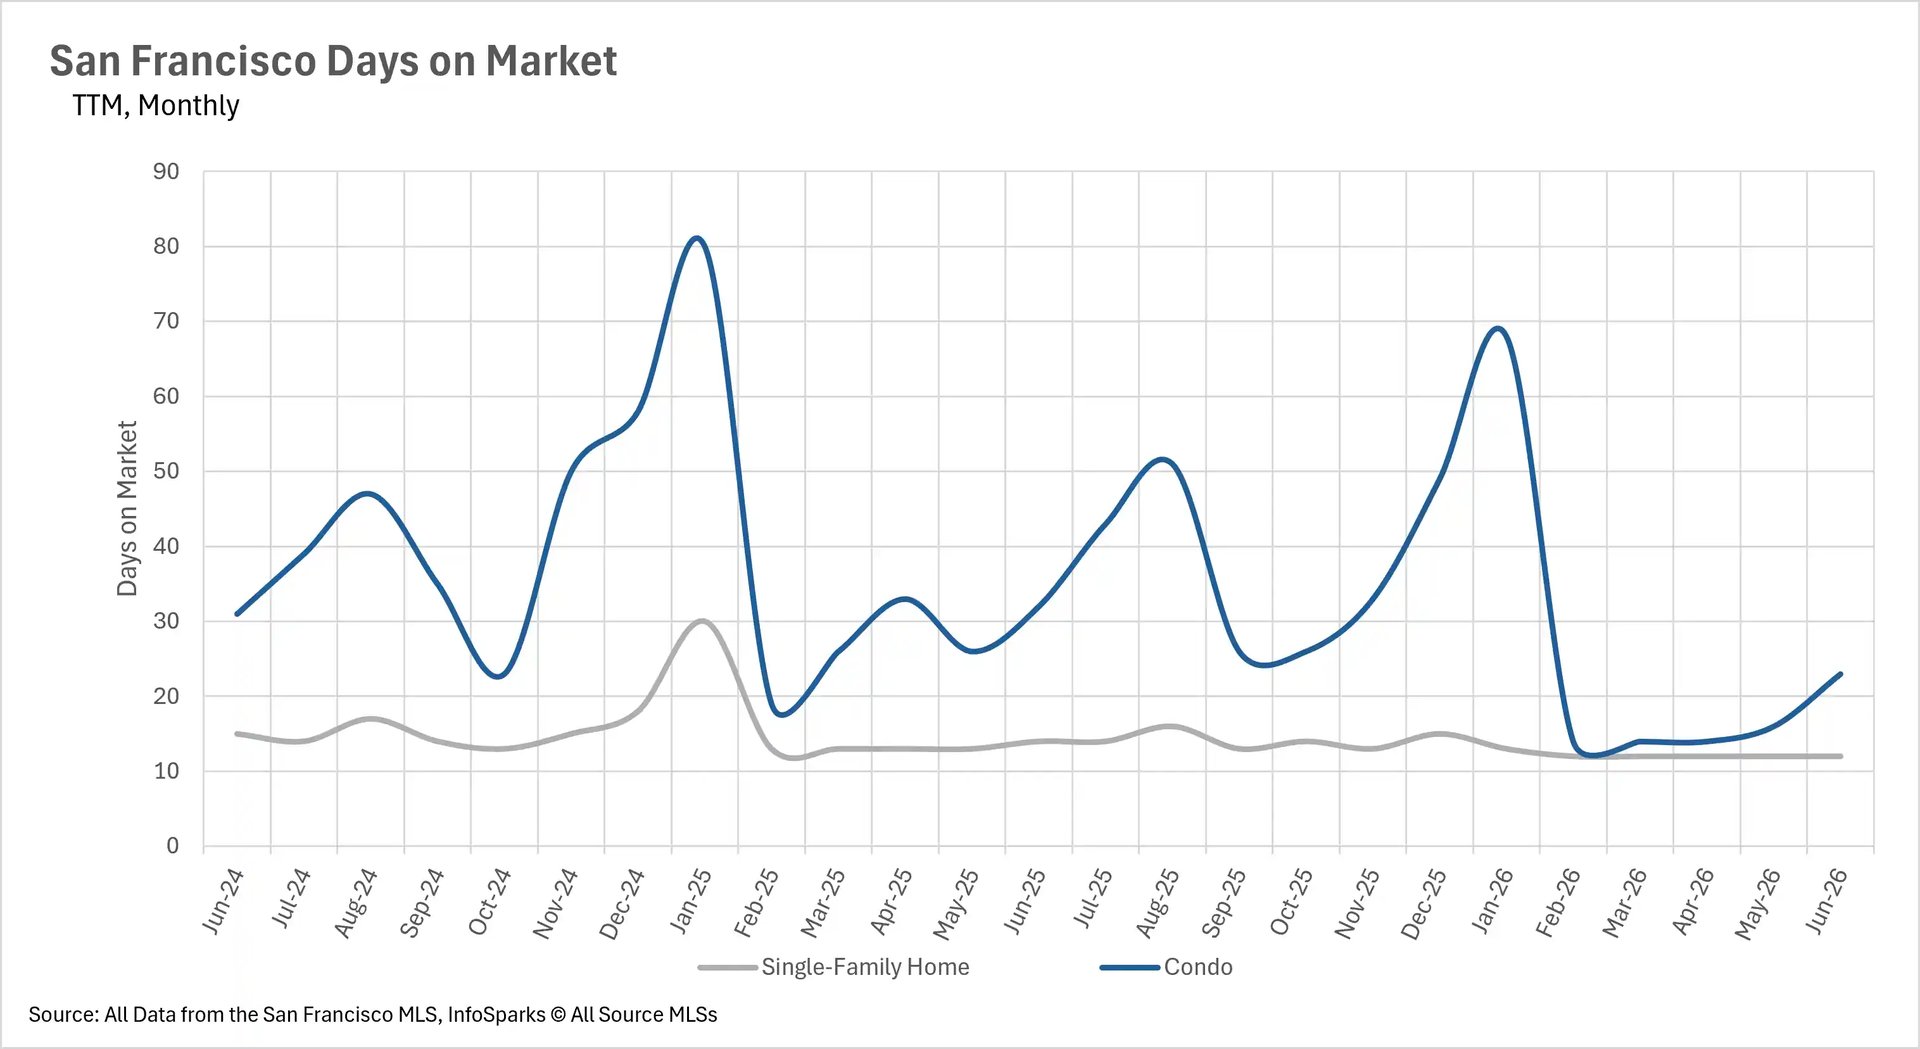
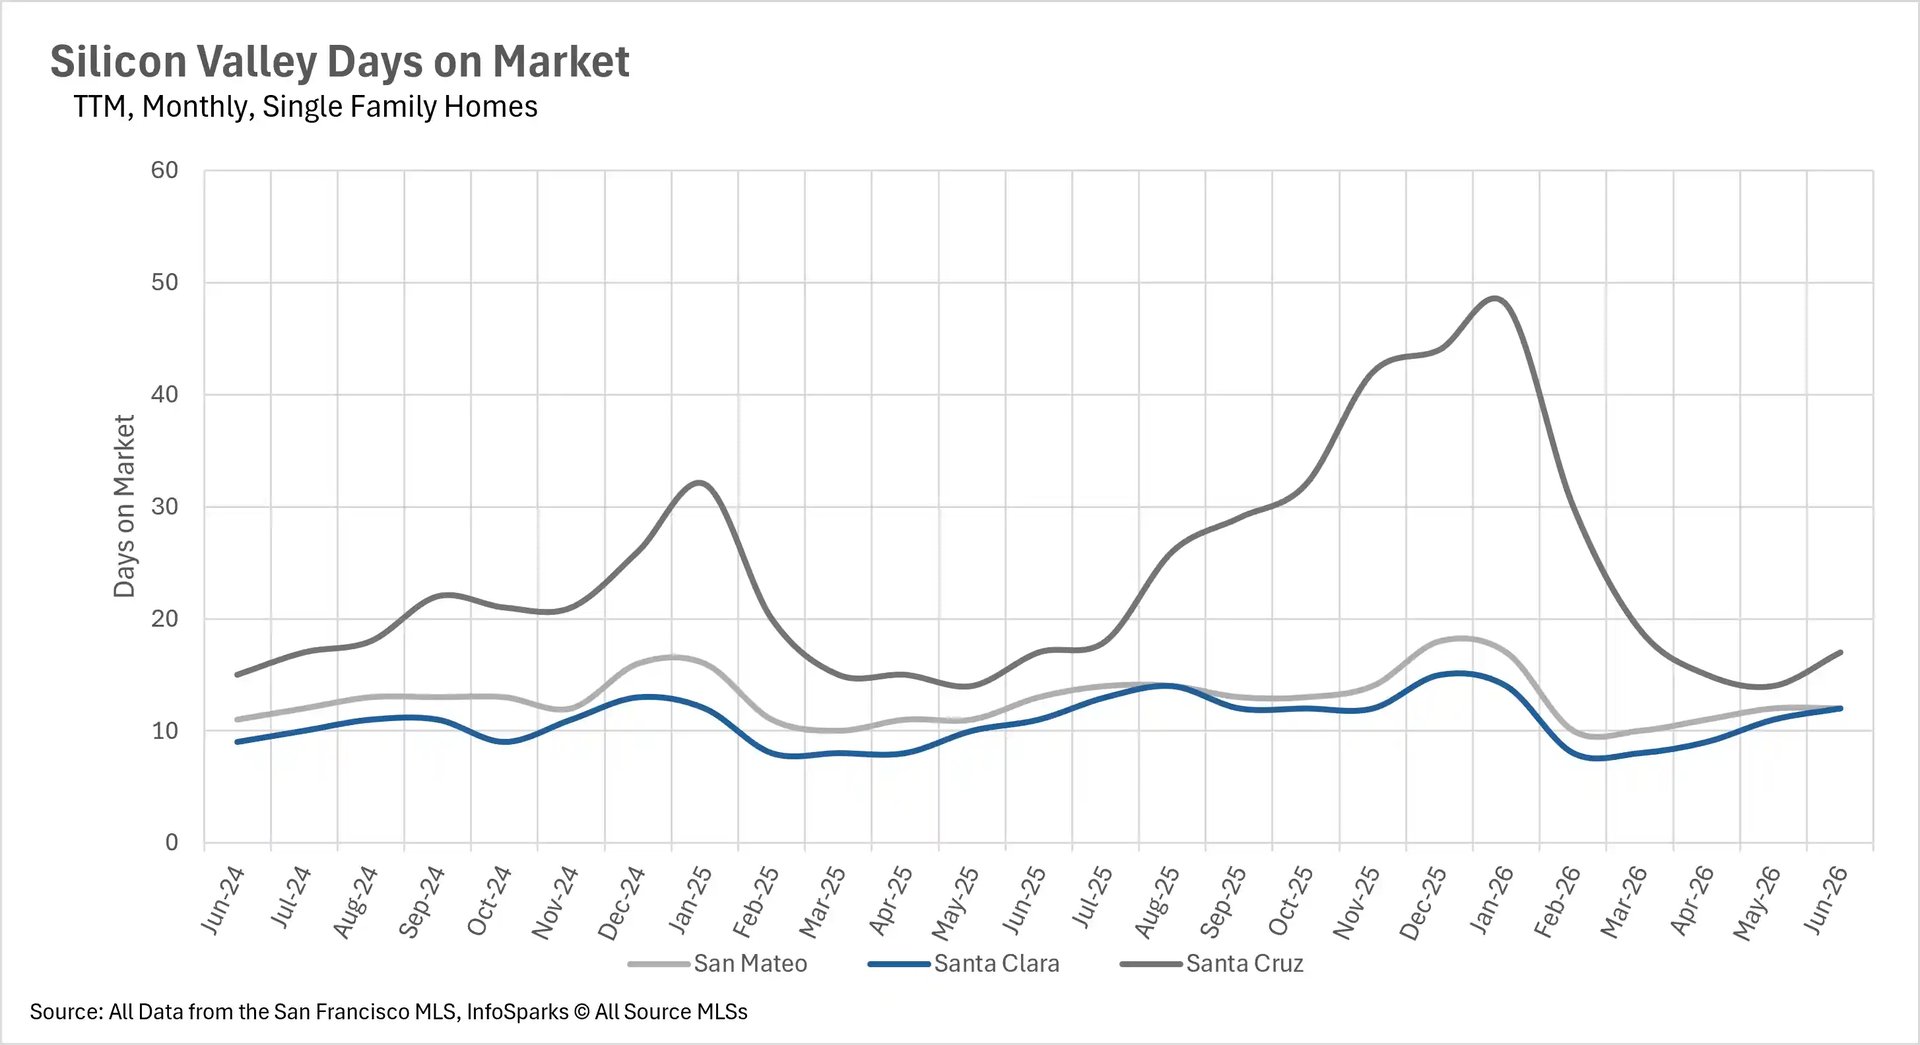
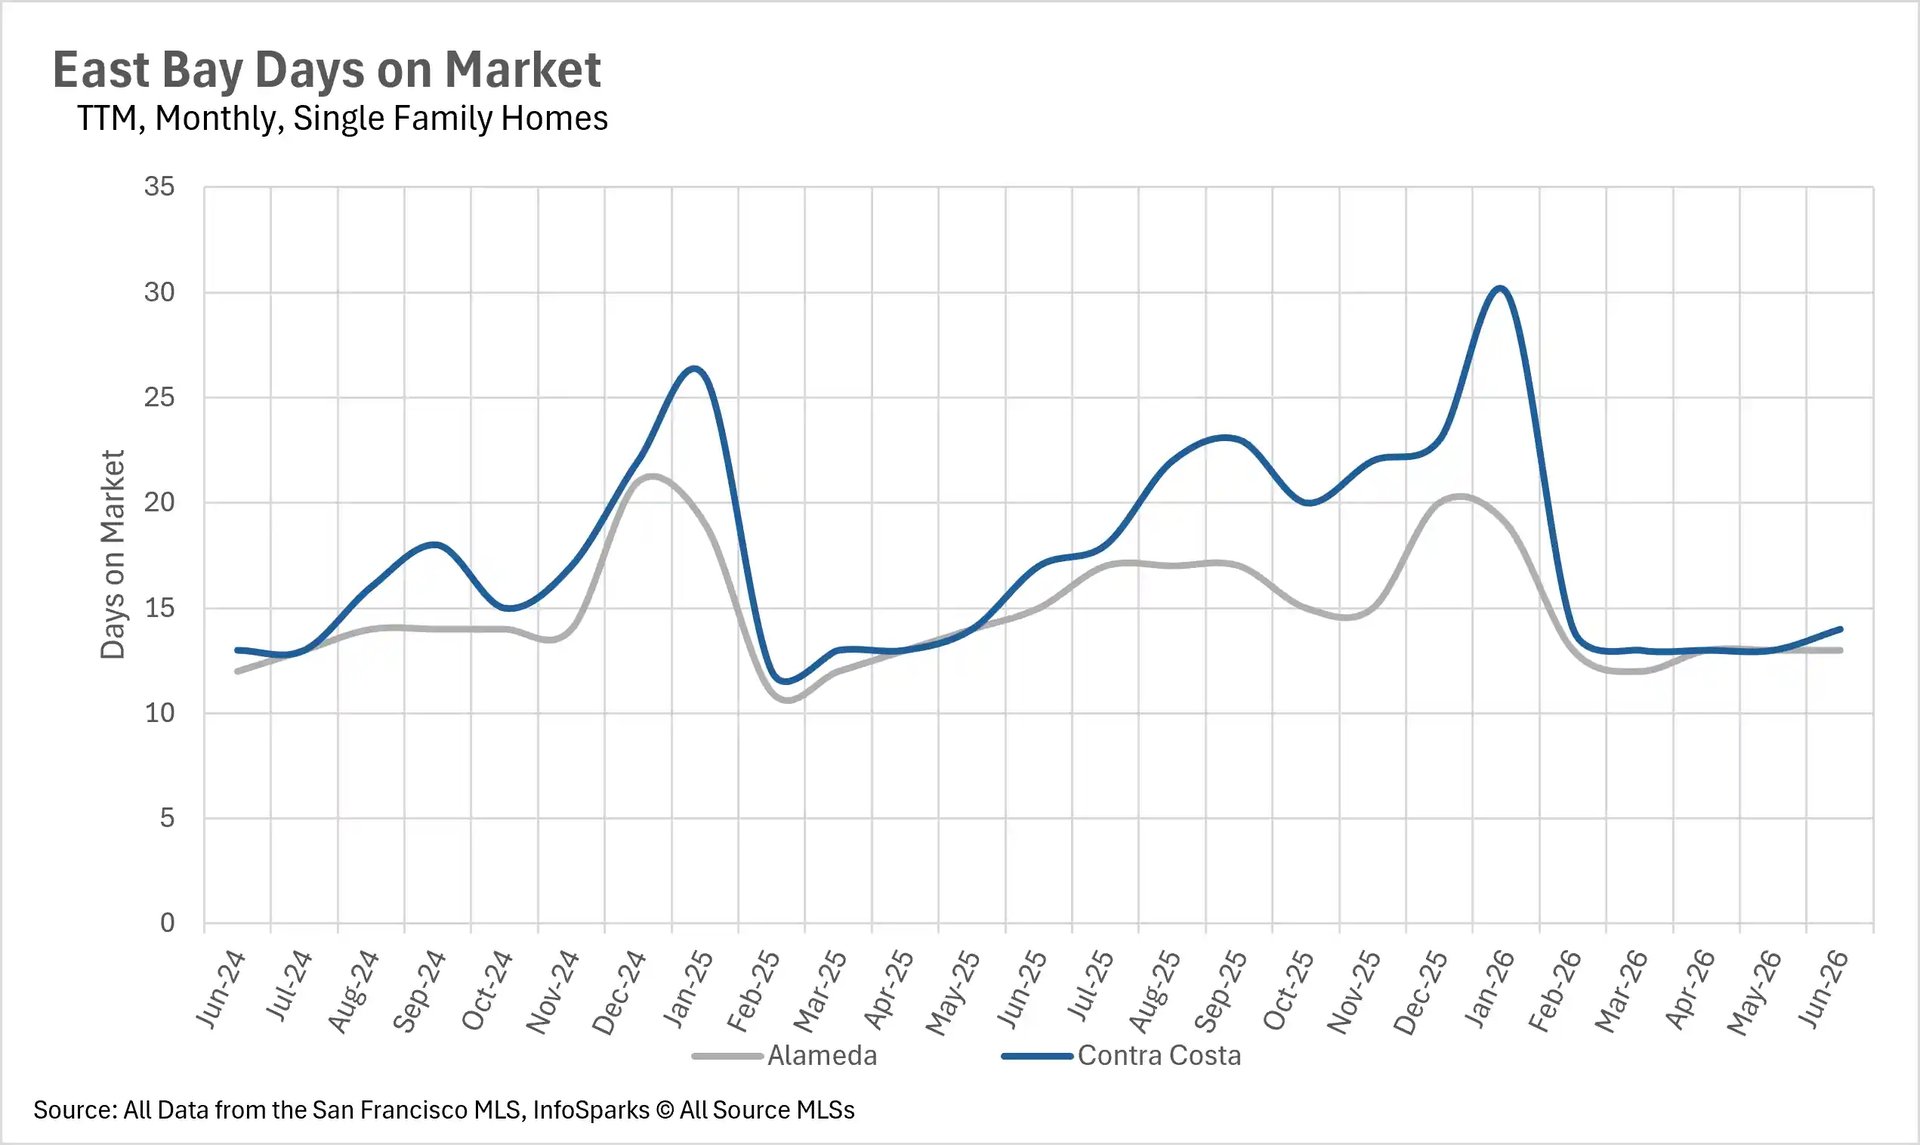
The combination of razor-thin inventory and strong demand has created one of the fastest-moving markets the Bay Area has seen in years. San Francisco single-family homes are selling in just 12 days, a 14.29% improvement year-over-year, while San Mateo and Santa Clara County homes are also moving in just 12 days each. East Bay single-family homes are selling in 13 and 14 days in Alameda and Contra Costa Counties, respectively, with both counties posting meaningful year-over-year improvements.

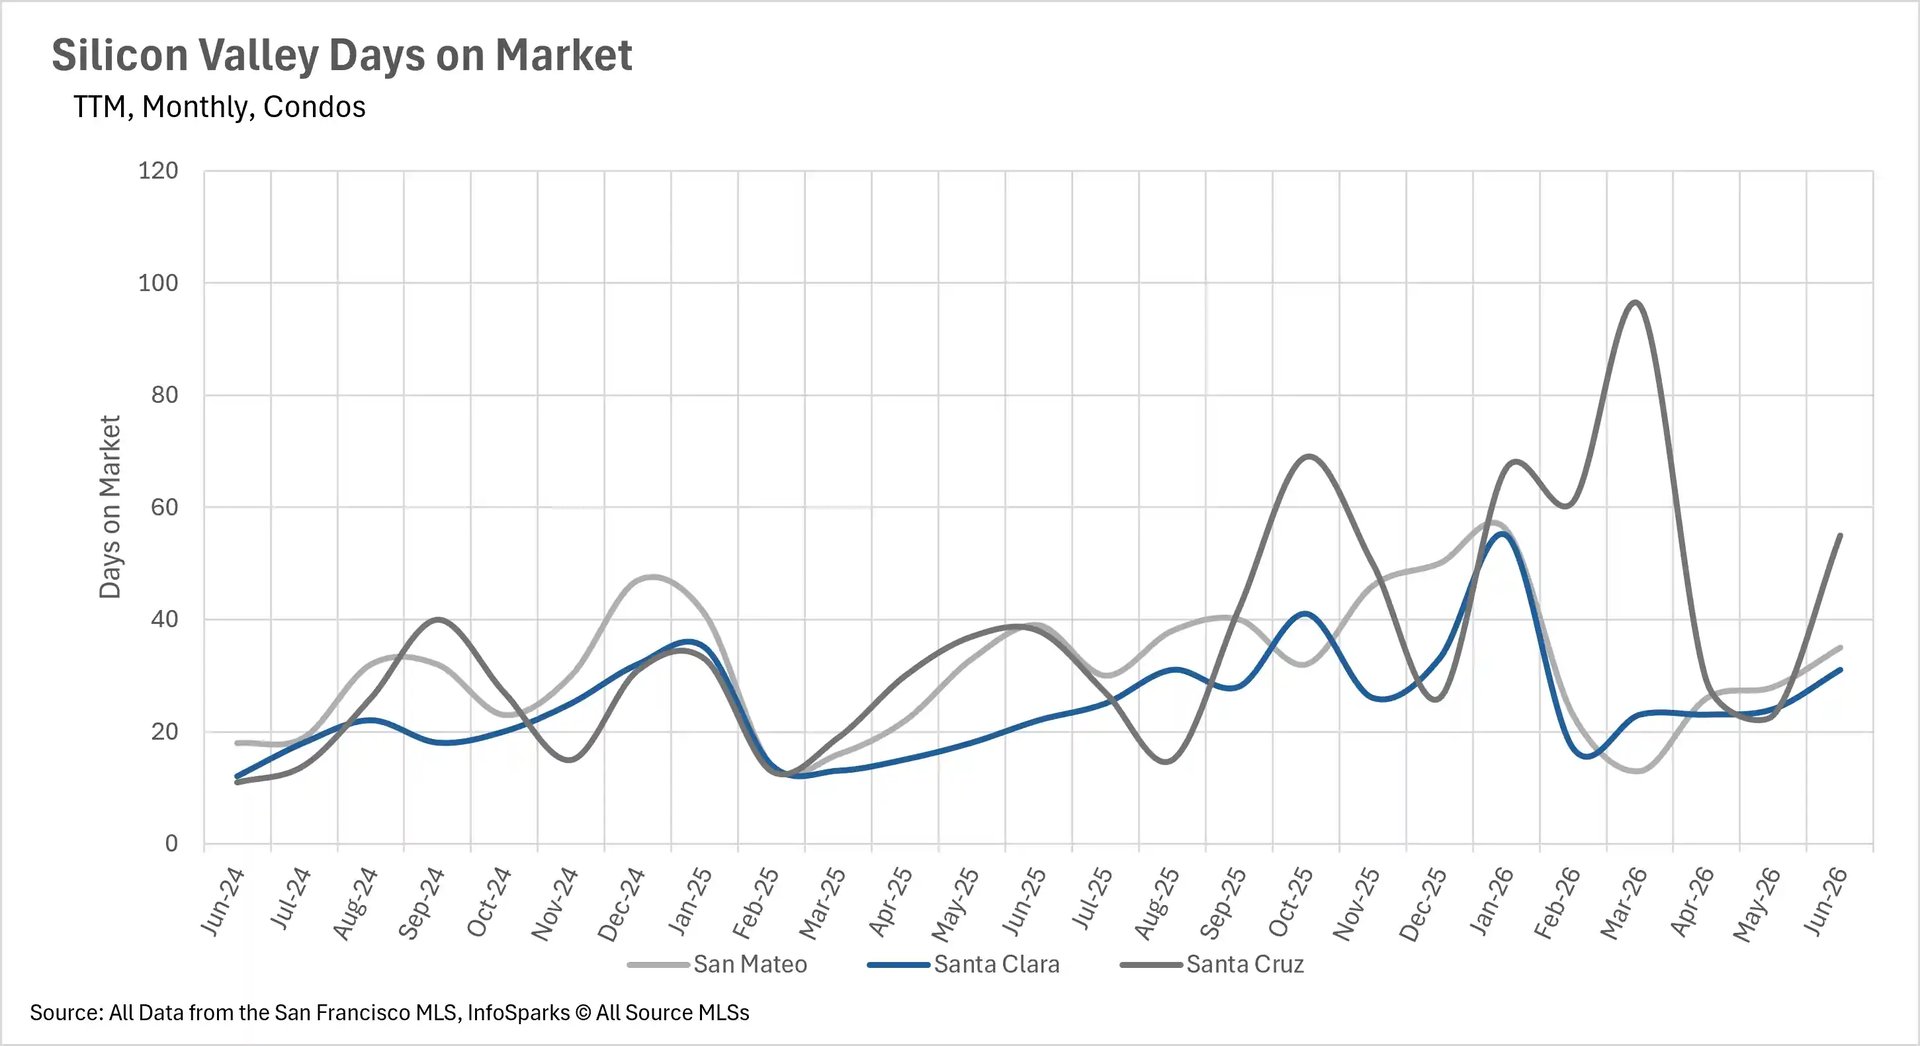
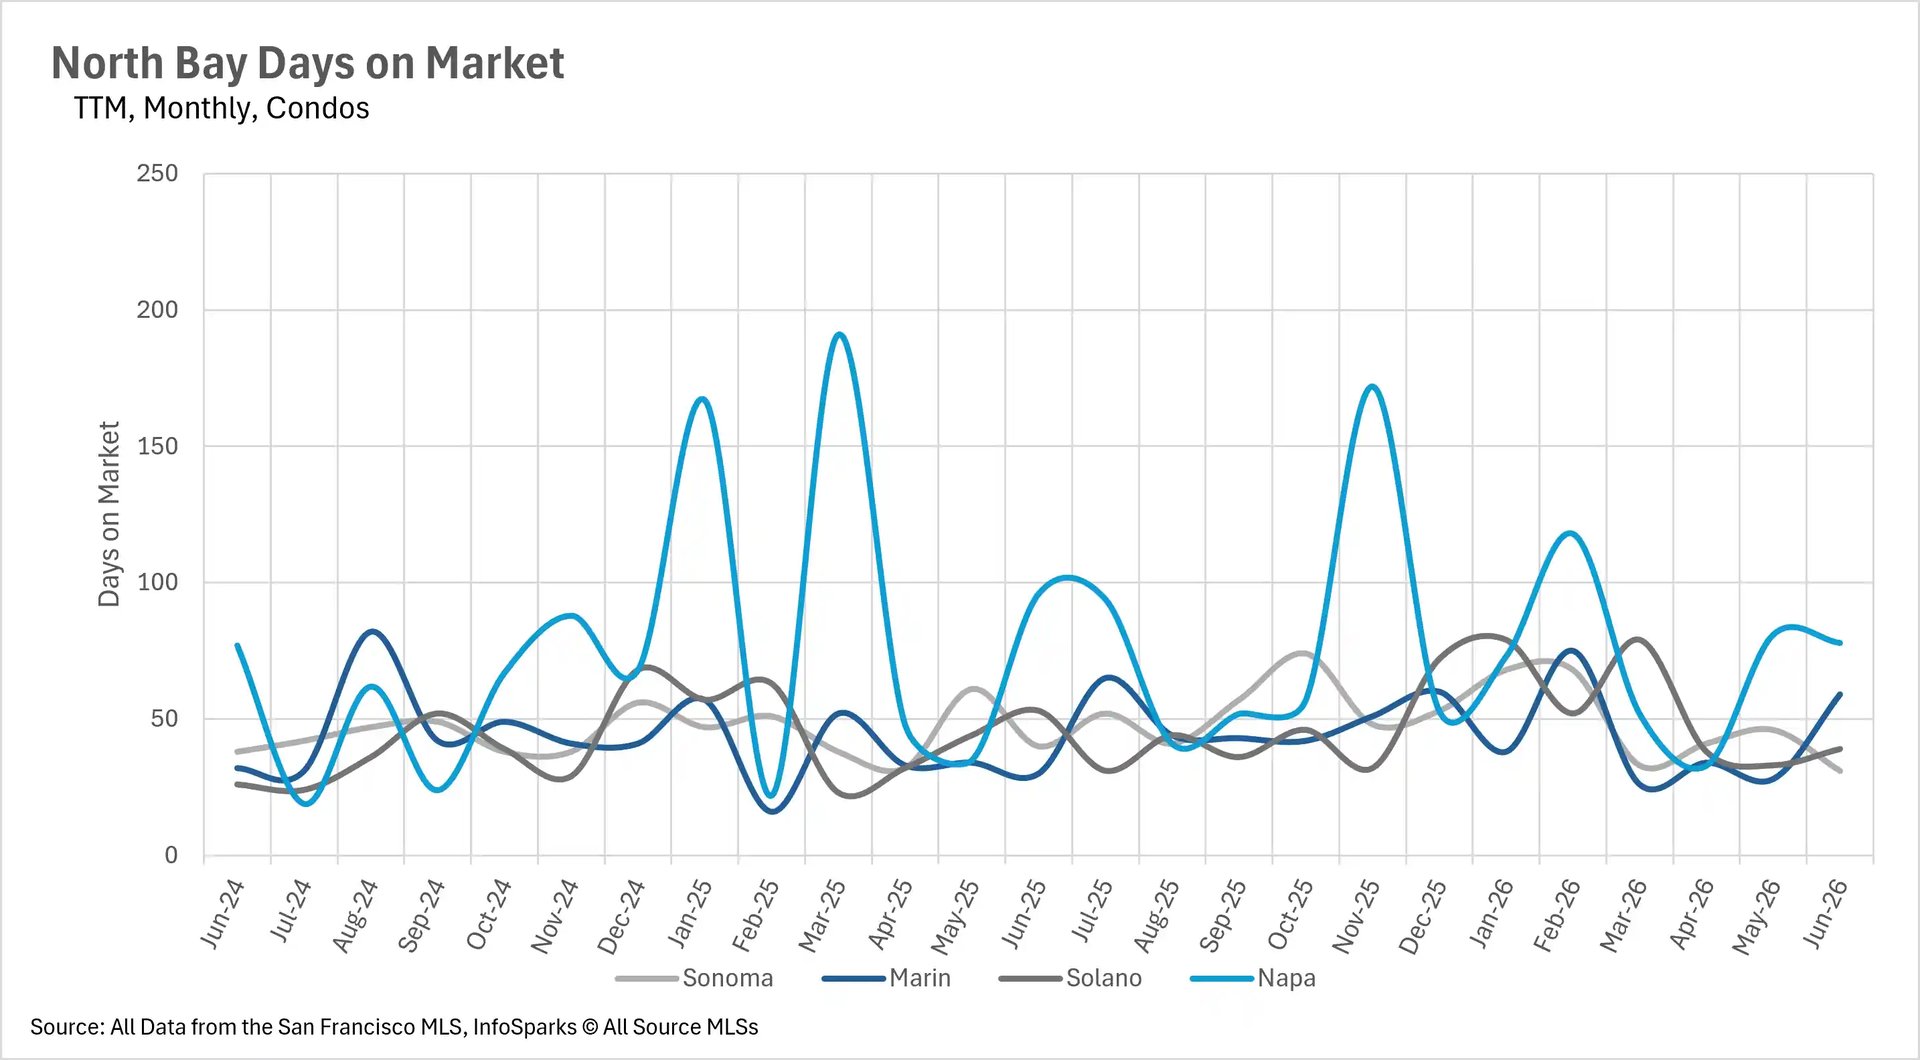
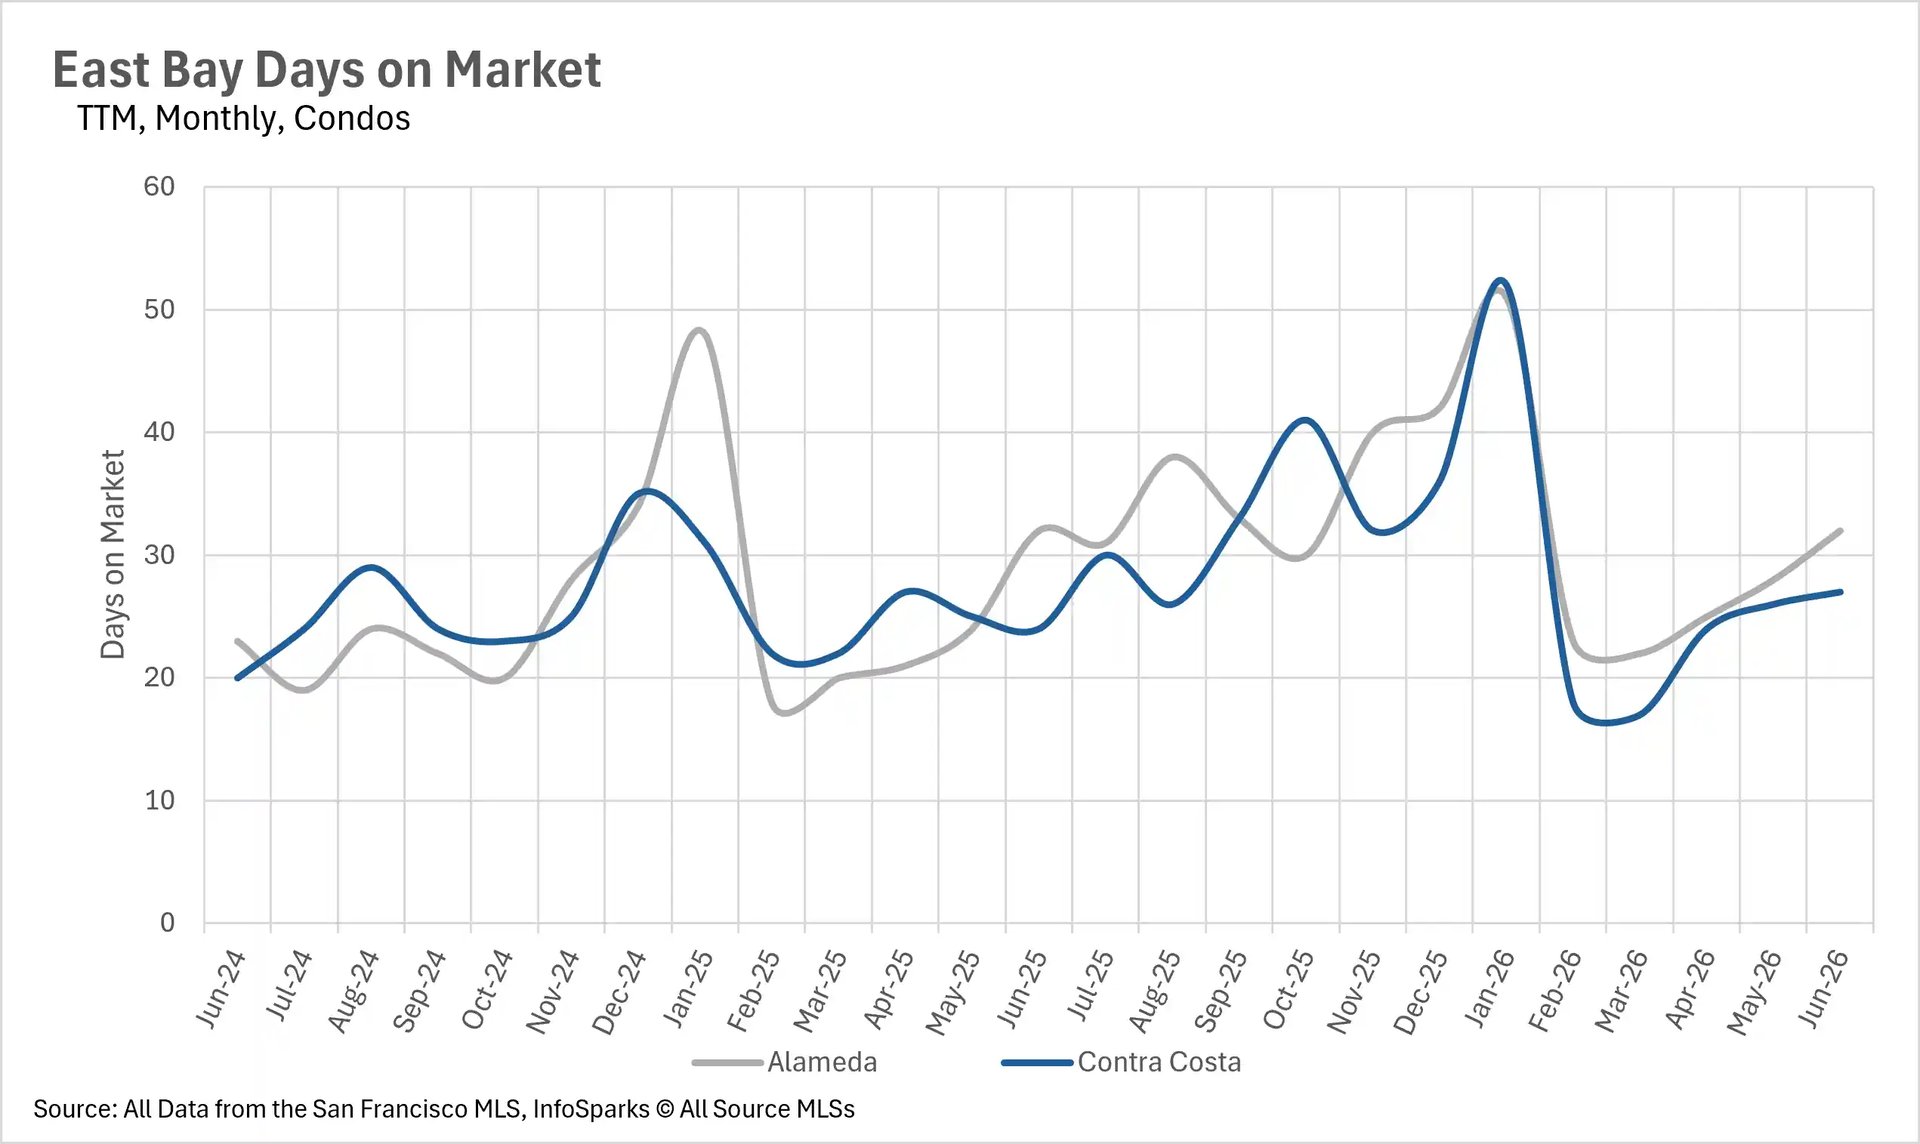
Marin County single-family homes are moving in just 18 days, 28% faster than this time last year, while Sonoma County homes are selling in 32 days and Solano County in 30 days. The condo market is also showing encouraging signs of acceleration. San Francisco condos are now moving in 23 days, down 28.13% year-over-year, and San Mateo County condos are selling 10.26% faster. In the North Bay, Sonoma and Solano County condos are moving 22.50% and 26.42% faster, respectively. However, pockets of sluggishness remain, as Santa Clara and Santa Cruz County condos are taking 40.91% and 44.74% longer to sell than they were a year ago.

San Francisco leads one of the tightest seller's markets the Bay Area has ever seen

When determining whether a market is a buyers' market or a sellers' market, we look at the Months of Supply Inventory (MSI) metric. The state of California has historically averaged around three months of MSI, so any area with at or around three months of MSI is considered a balanced market. Any market that has less than three months of MSI is considered a seller's market, whereas markets with more than three months of MSI are considered a buyers' market.

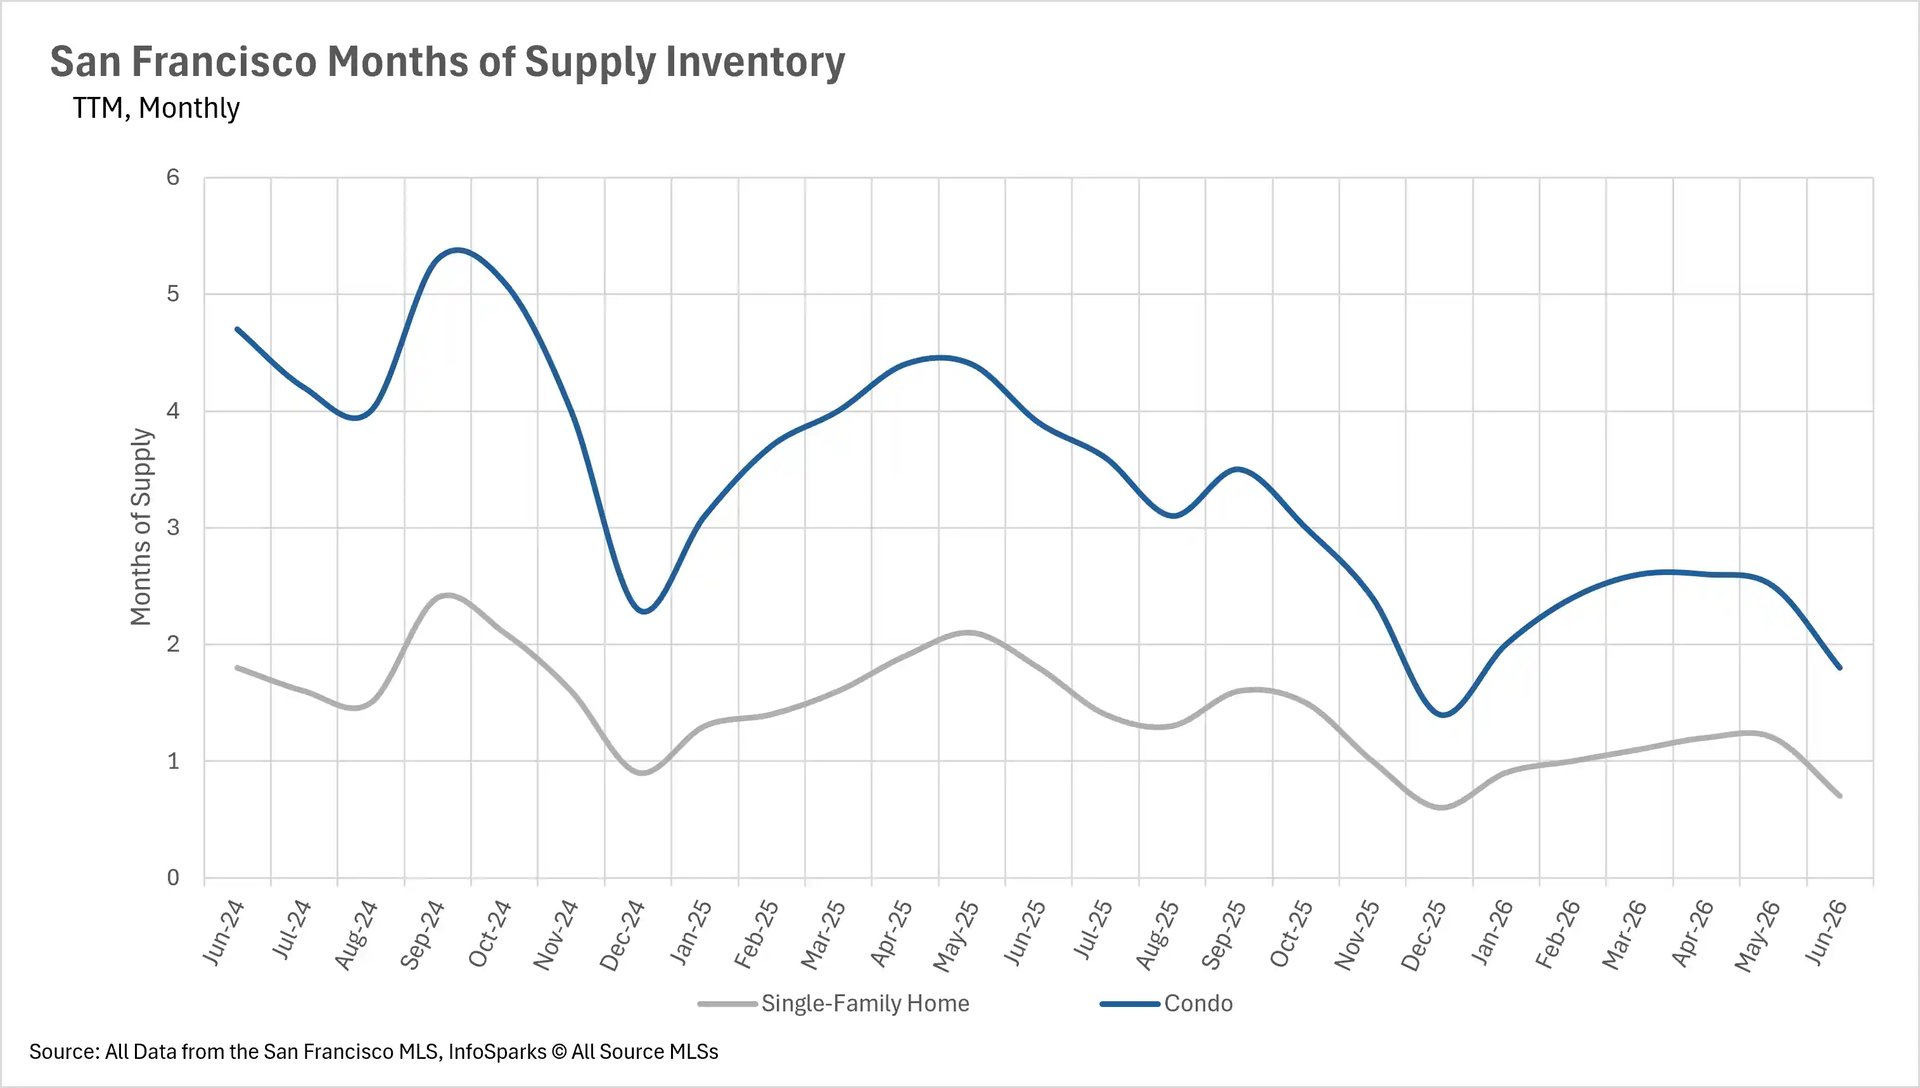
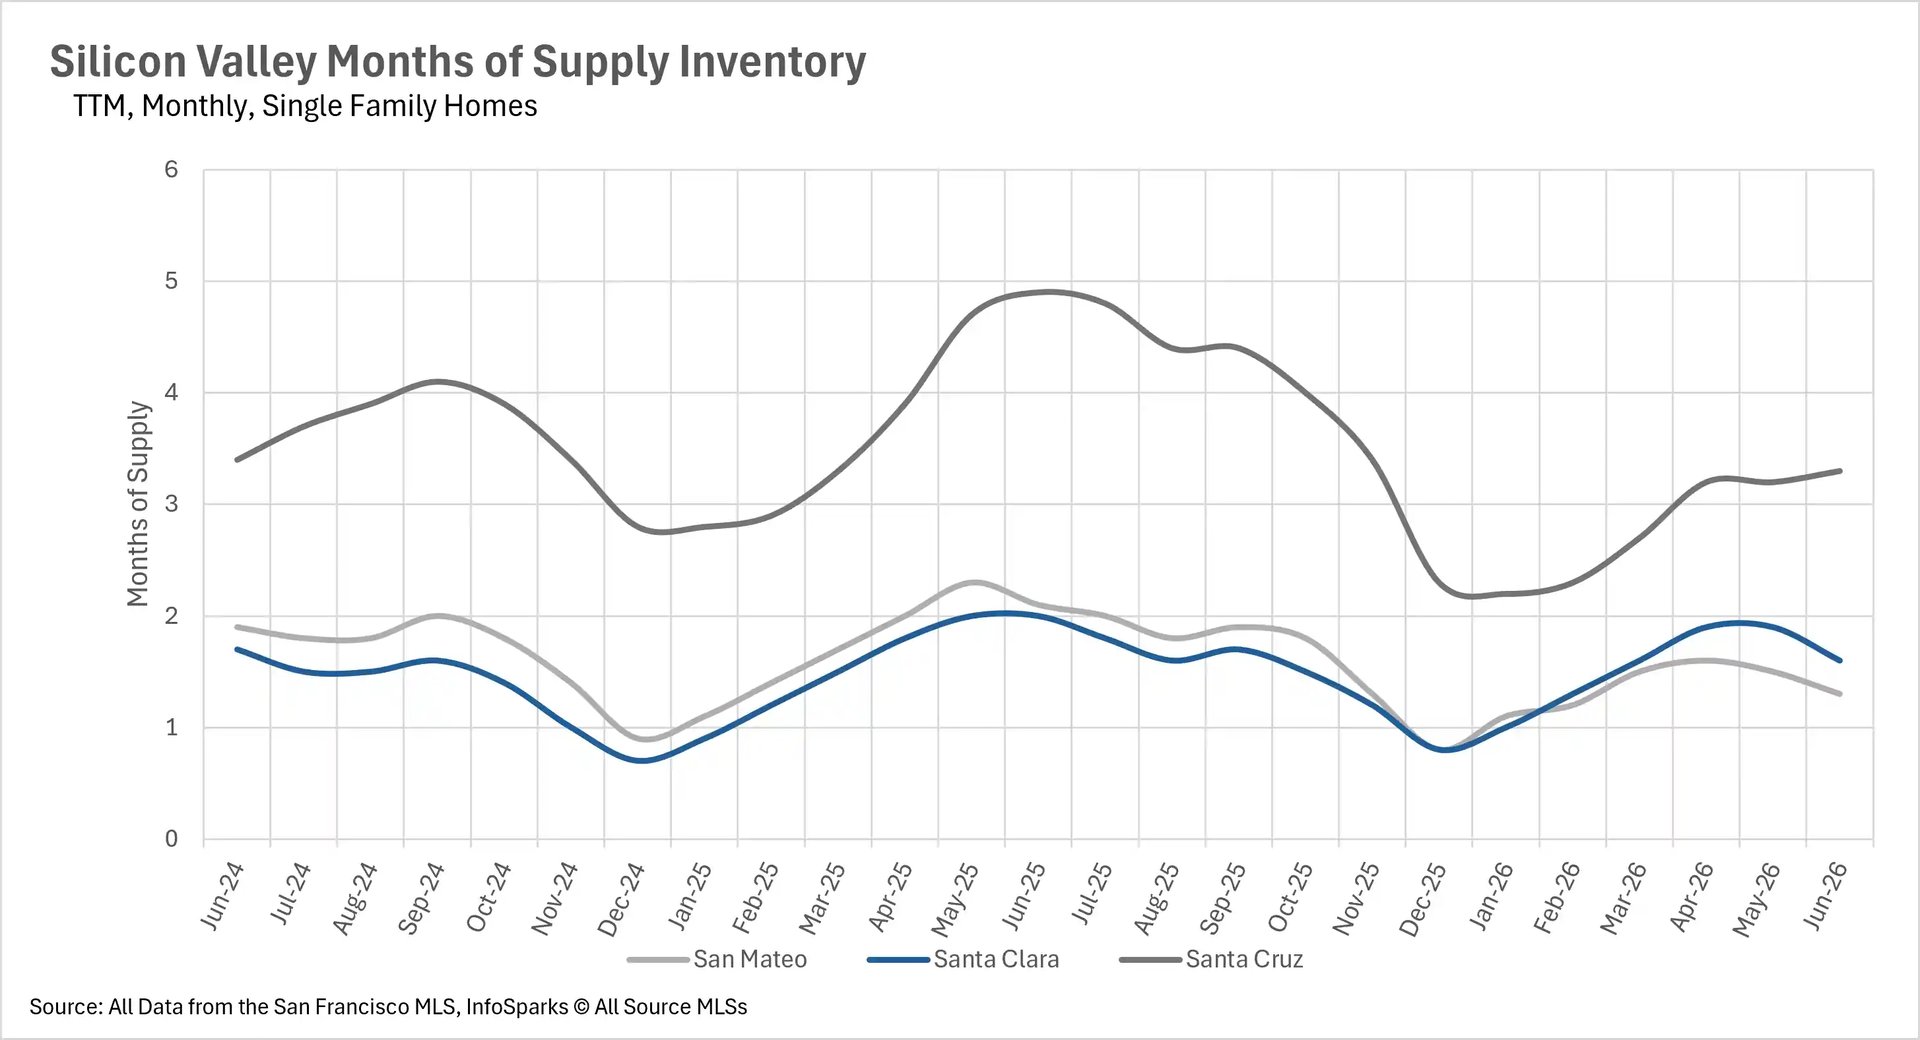
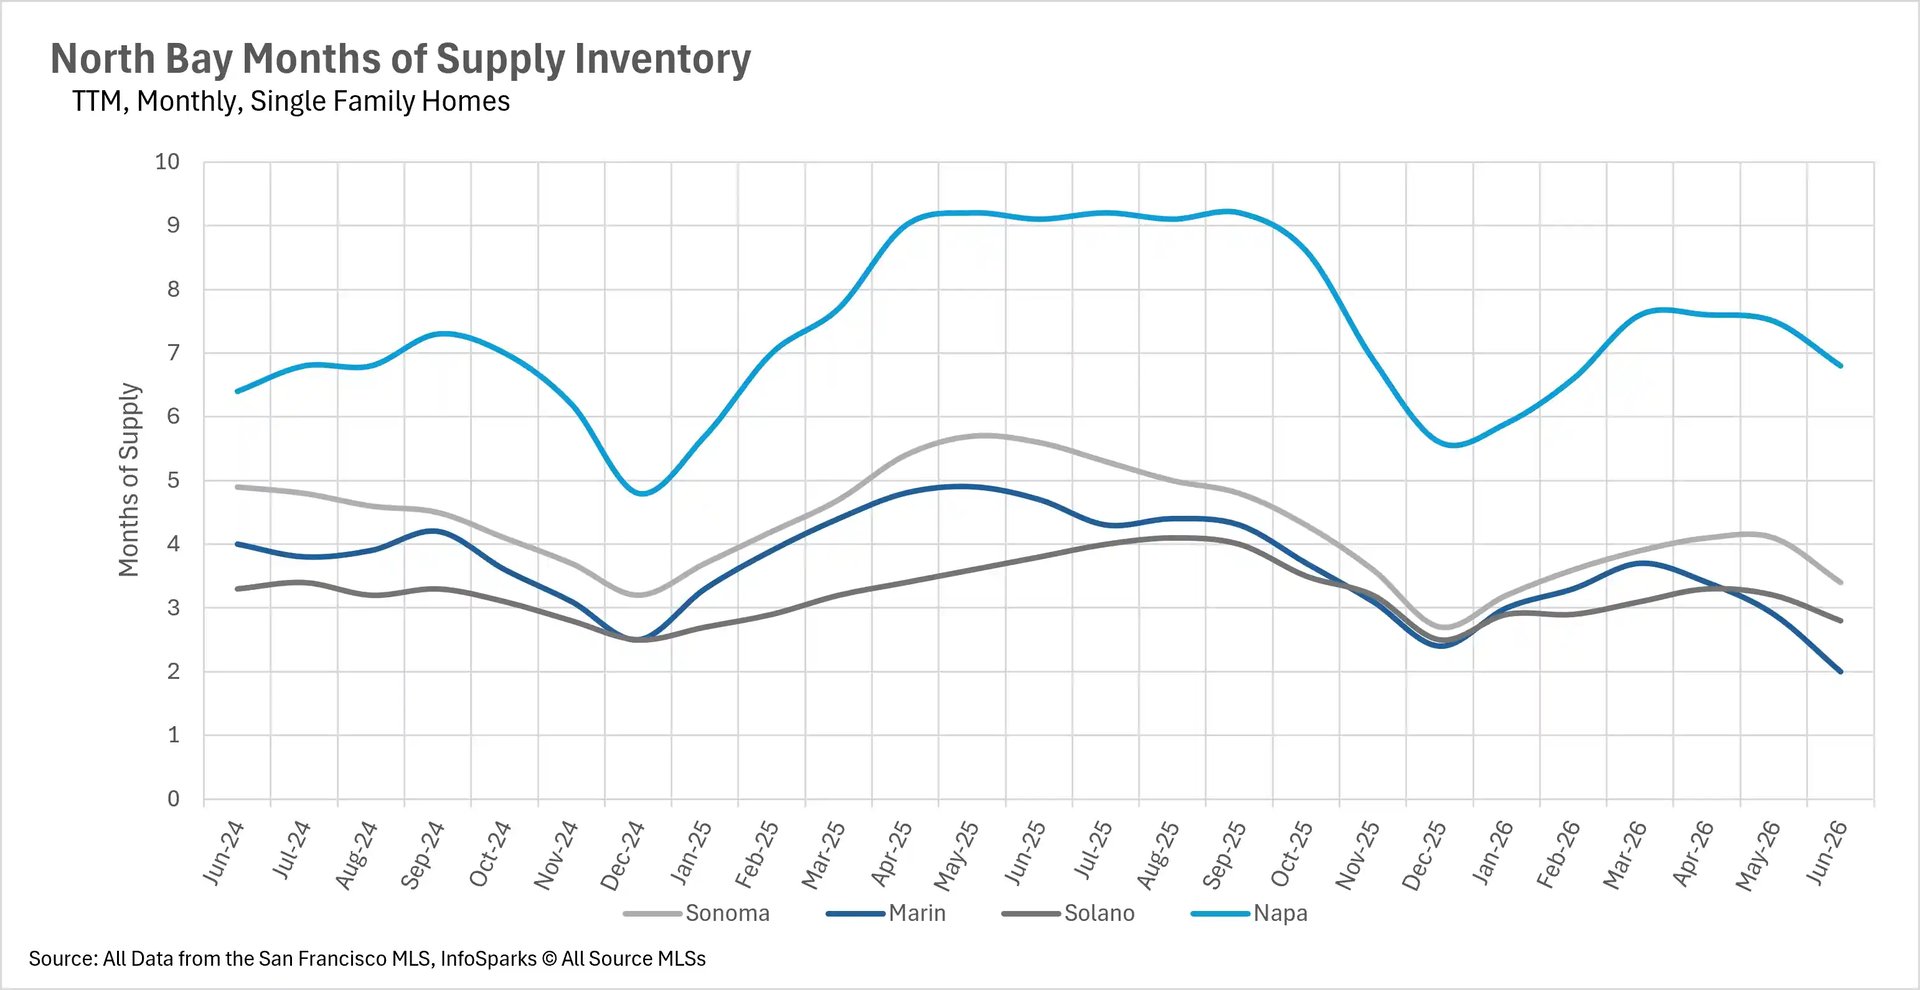
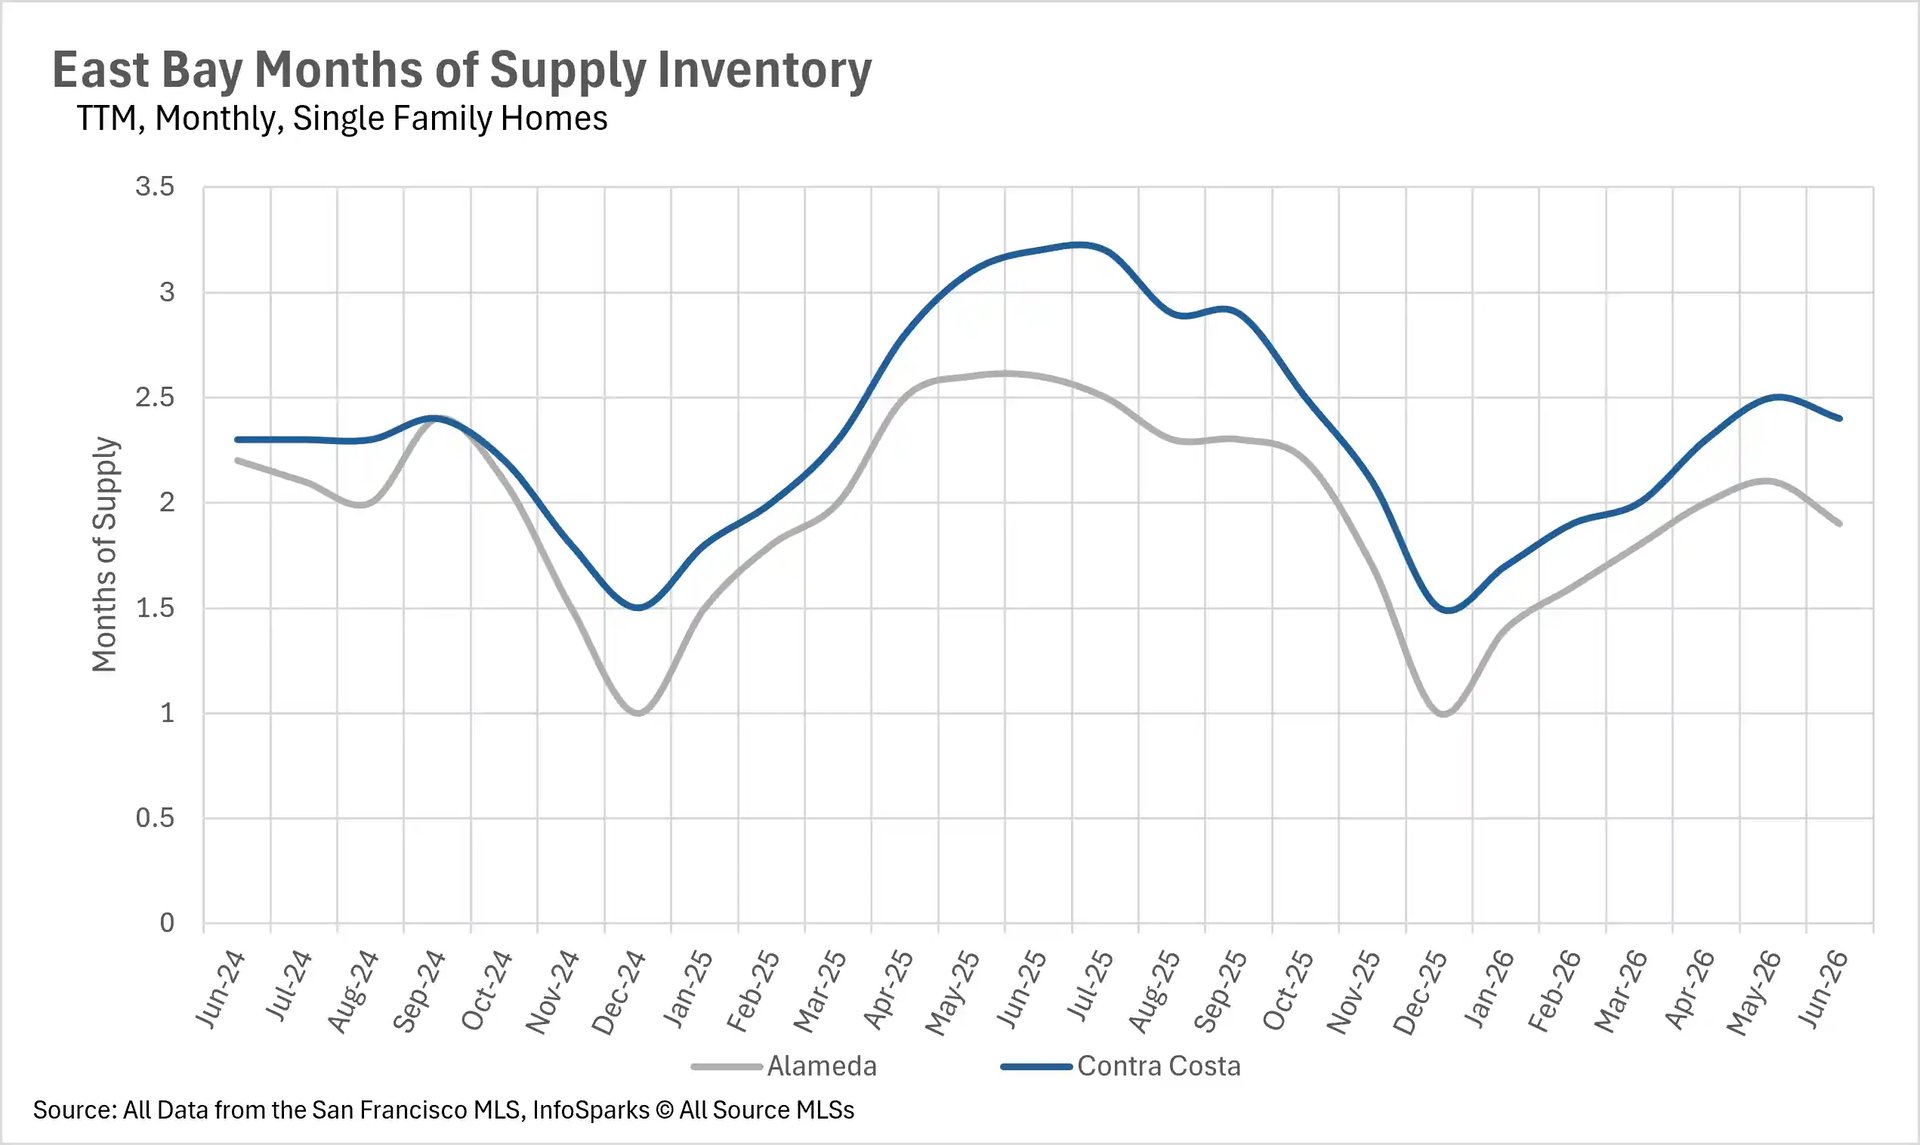
San Francisco has become one of the most extreme seller's markets in the state, with just 0.7 months of single-family home supply and 1.8 months of condo supply, meaning every available single-family home would be sold in just three weeks at the current pace. Both figures are down more than 50% year-over-year. Across Silicon Valley, San Mateo County sits at just 1.3 months of single-family supply, down 38.10%, while Santa Clara County has 1.6 months and Santa Cruz County has 3.3 months. The East Bay remains a strong seller's market for single-family homes, with Alameda County at 1.9 months and Contra Costa County at 2.4 months, both down roughly 26% year-over-year. In the North Bay, Marin County has just 2 months of supply, down 57.45%, while Solano County sits at 2.8 months and Sonoma County at 3.4 months. Napa County remains the lone buyer's market at 6.8 months.

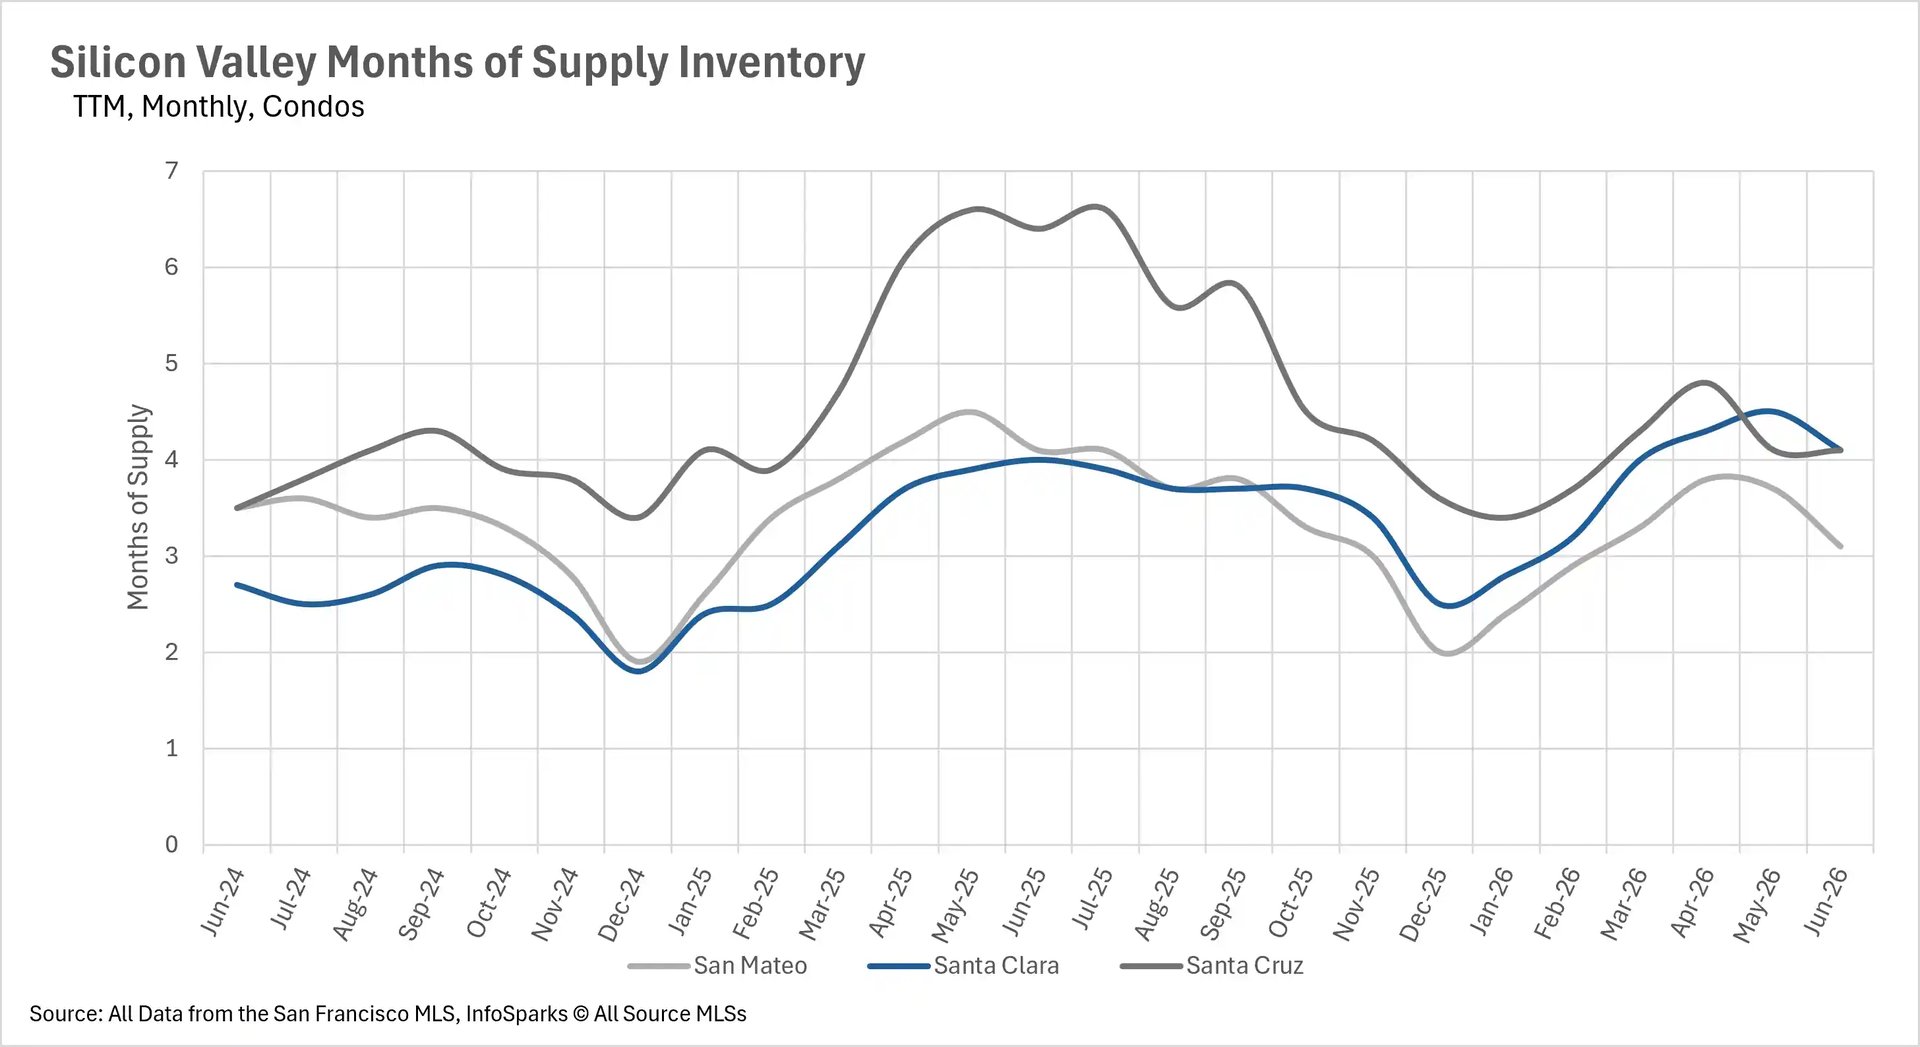
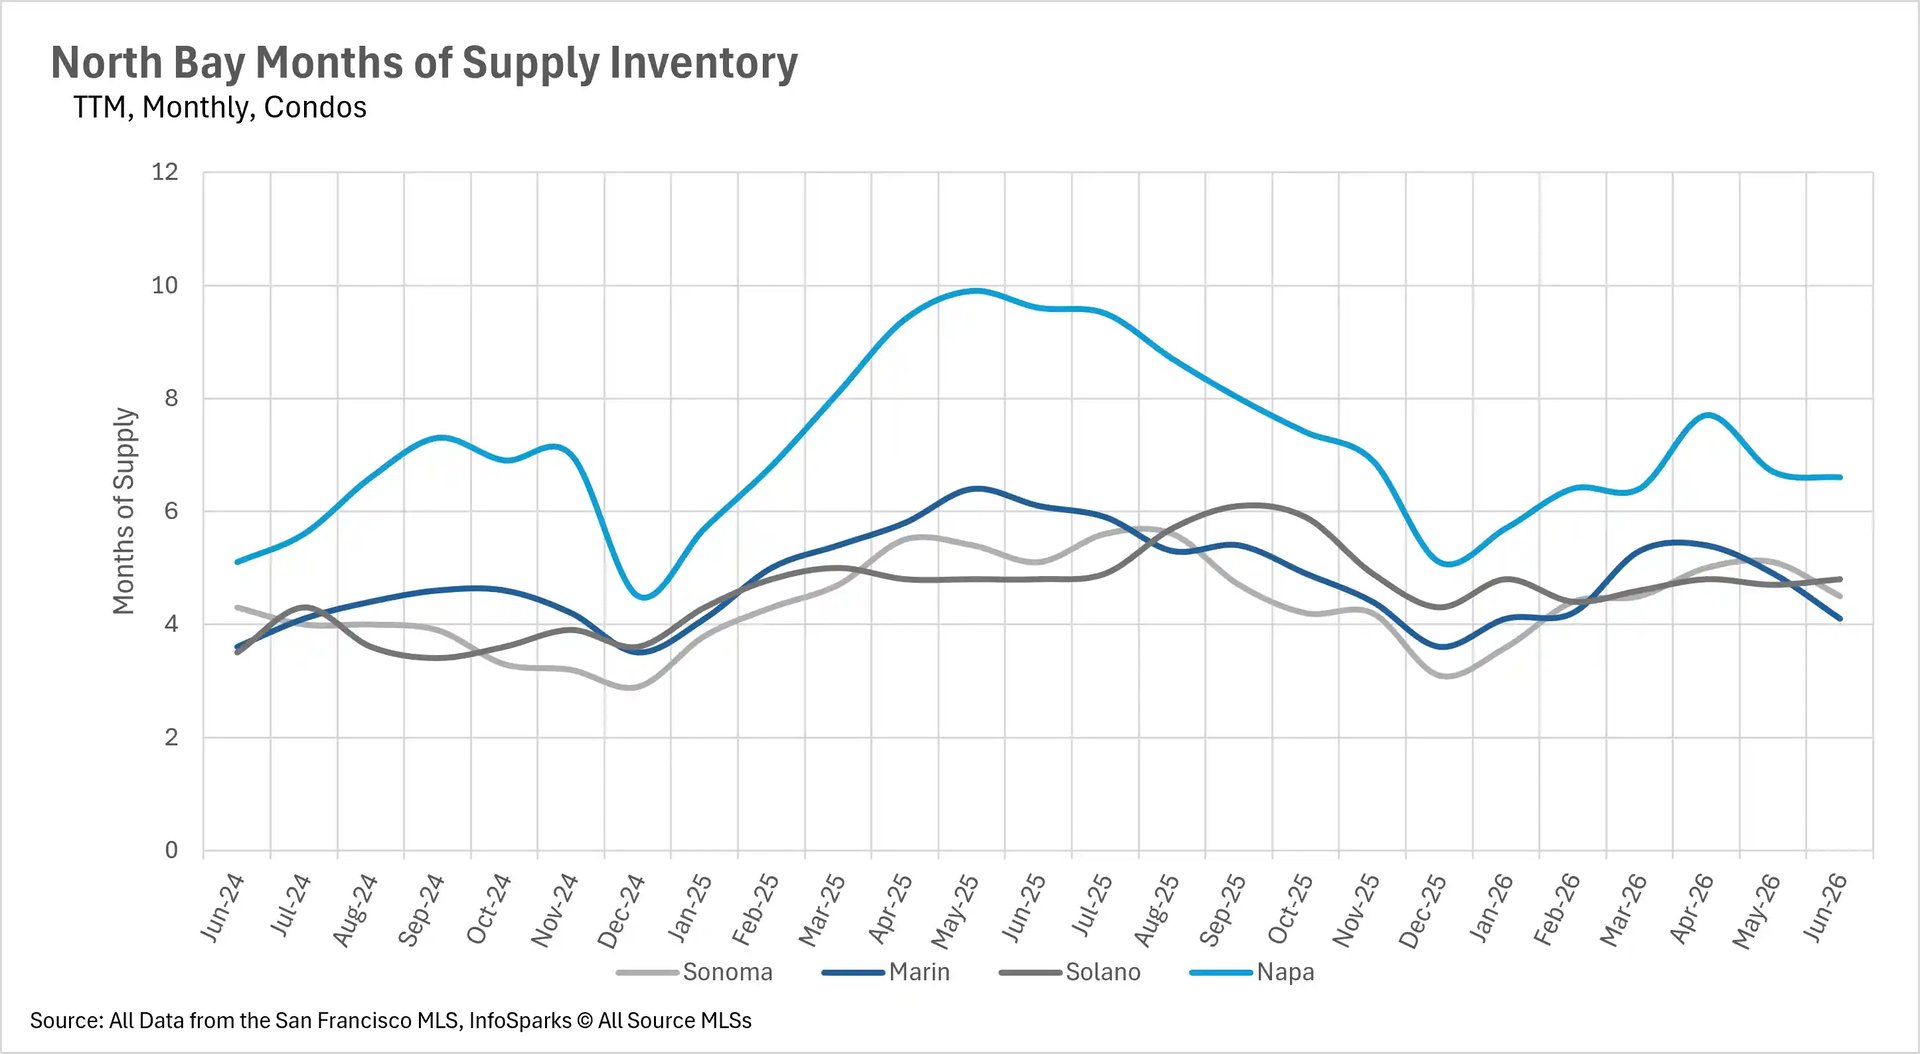
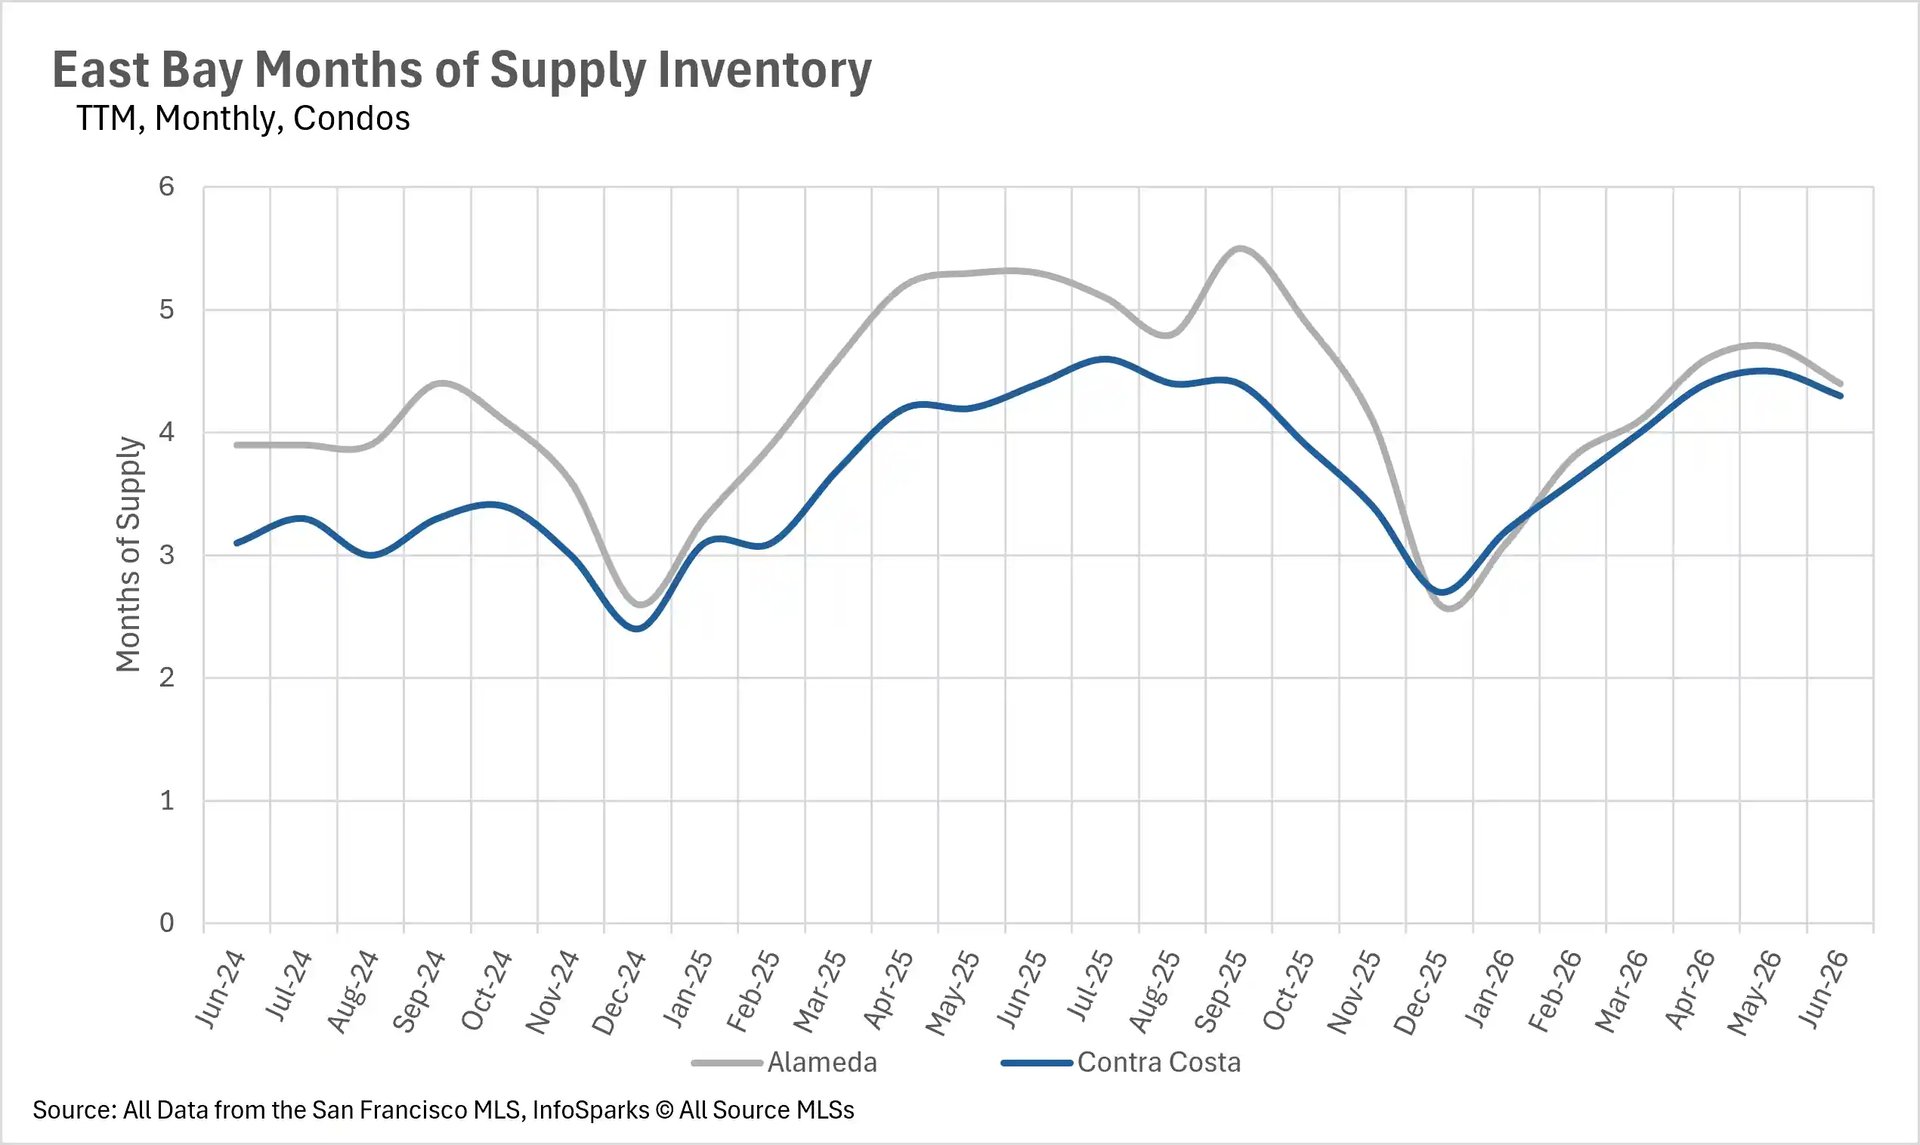
The condo market continues to favor buyers in several areas, with Alameda County at 4.4 months, Contra Costa County at 4.3 months, Napa County at 6.6 months, Solano County at 4.8 months, and Sonoma County at 4.5 months, although these figures have been trending downward as the condo market gradually tightens. As the summer selling season hits its stride, sellers across the single-family home market are holding virtually all the cards.
Local Lowdown Data

Line chart displaying San Francisco median real estate prices over a three-year monthly period up to June 2026, comparing market value trends between single-family homes and condos.

Bar chart illustrating San Francisco median real estate price changes year-over-year up to June 2026, showing monthly percentage fluctuations for both single-family homes and condos.

Line graph tracking the average percentage of the original list price received in San Francisco over a three-year period up to June 2026, comparing single-family homes and condos.

Combination chart tracking two-year monthly condo inventory in San Francisco up to June 2026, detailing the volume of new listings, sold listings, and total active units for sale.

Combination chart tracking two-year monthly single-family home inventory in San Francisco up to June 2026, highlighting the volume of new listings, sold units, and total active housing supply.

Line graph of San Francisco months of supply housing inventory up to June 2026, showing monthly market saturation trends for single-family homes versus condos.

Line graph tracking the average days on market in San Francisco up to June 2026, comparing sales cycle speed and buyer velocity between single-family homes and condos.

Line chart displaying Silicon Valley median condo prices over a three-year monthly period up to June 2026, comparing real estate trends in San Mateo, Santa Clara, and Santa Cruz counties.

Line chart showing Silicon Valley median single-family home prices over a three-year period up to June 2026, tracking values across San Mateo, Santa Clara, and Santa Cruz counties.

Bar chart illustrating year-over-year median condo price changes in Silicon Valley up to June 2026, comparing percentage fluctuations for the San Mateo, Santa Clara, and Santa Cruz markets.

Bar chart showing year-over-year median single-family home price percentage changes for Silicon Valley real estate markets up to June 2026 across San Mateo, Santa Clara, and Santa Cruz.

Combination chart tracking two-year monthly condo inventory in Silicon Valley up to June 2026, detailing the volume of new listings, sold listings, and total active homes for sale.

Combination chart tracking two-year monthly single-family home inventory in Silicon Valley up to June 2026, highlighting the volume of new listings, sold units, and total active housing supply.

Line graph depicting months of supply inventory for Silicon Valley condos up to June 2026, comparing market saturation and supply levels in San Mateo, Santa Clara, and Santa Cruz.

Line graph showing months of supply housing inventory for Silicon Valley single-family homes up to June 2026, tracking market balance across San Mateo, Santa Clara, and Santa Cruz.

Line graph tracking the average days on market for condos in Silicon Valley up to June 2026, comparing the speed of real estate sales in San Mateo, Santa Clara, and Santa Cruz.

Line graph tracking the average days on market for single-family homes in Silicon Valley up to June 2026, comparing sales cycles and buyer velocity for San Mateo, Santa Clara, and Santa Cruz counties.

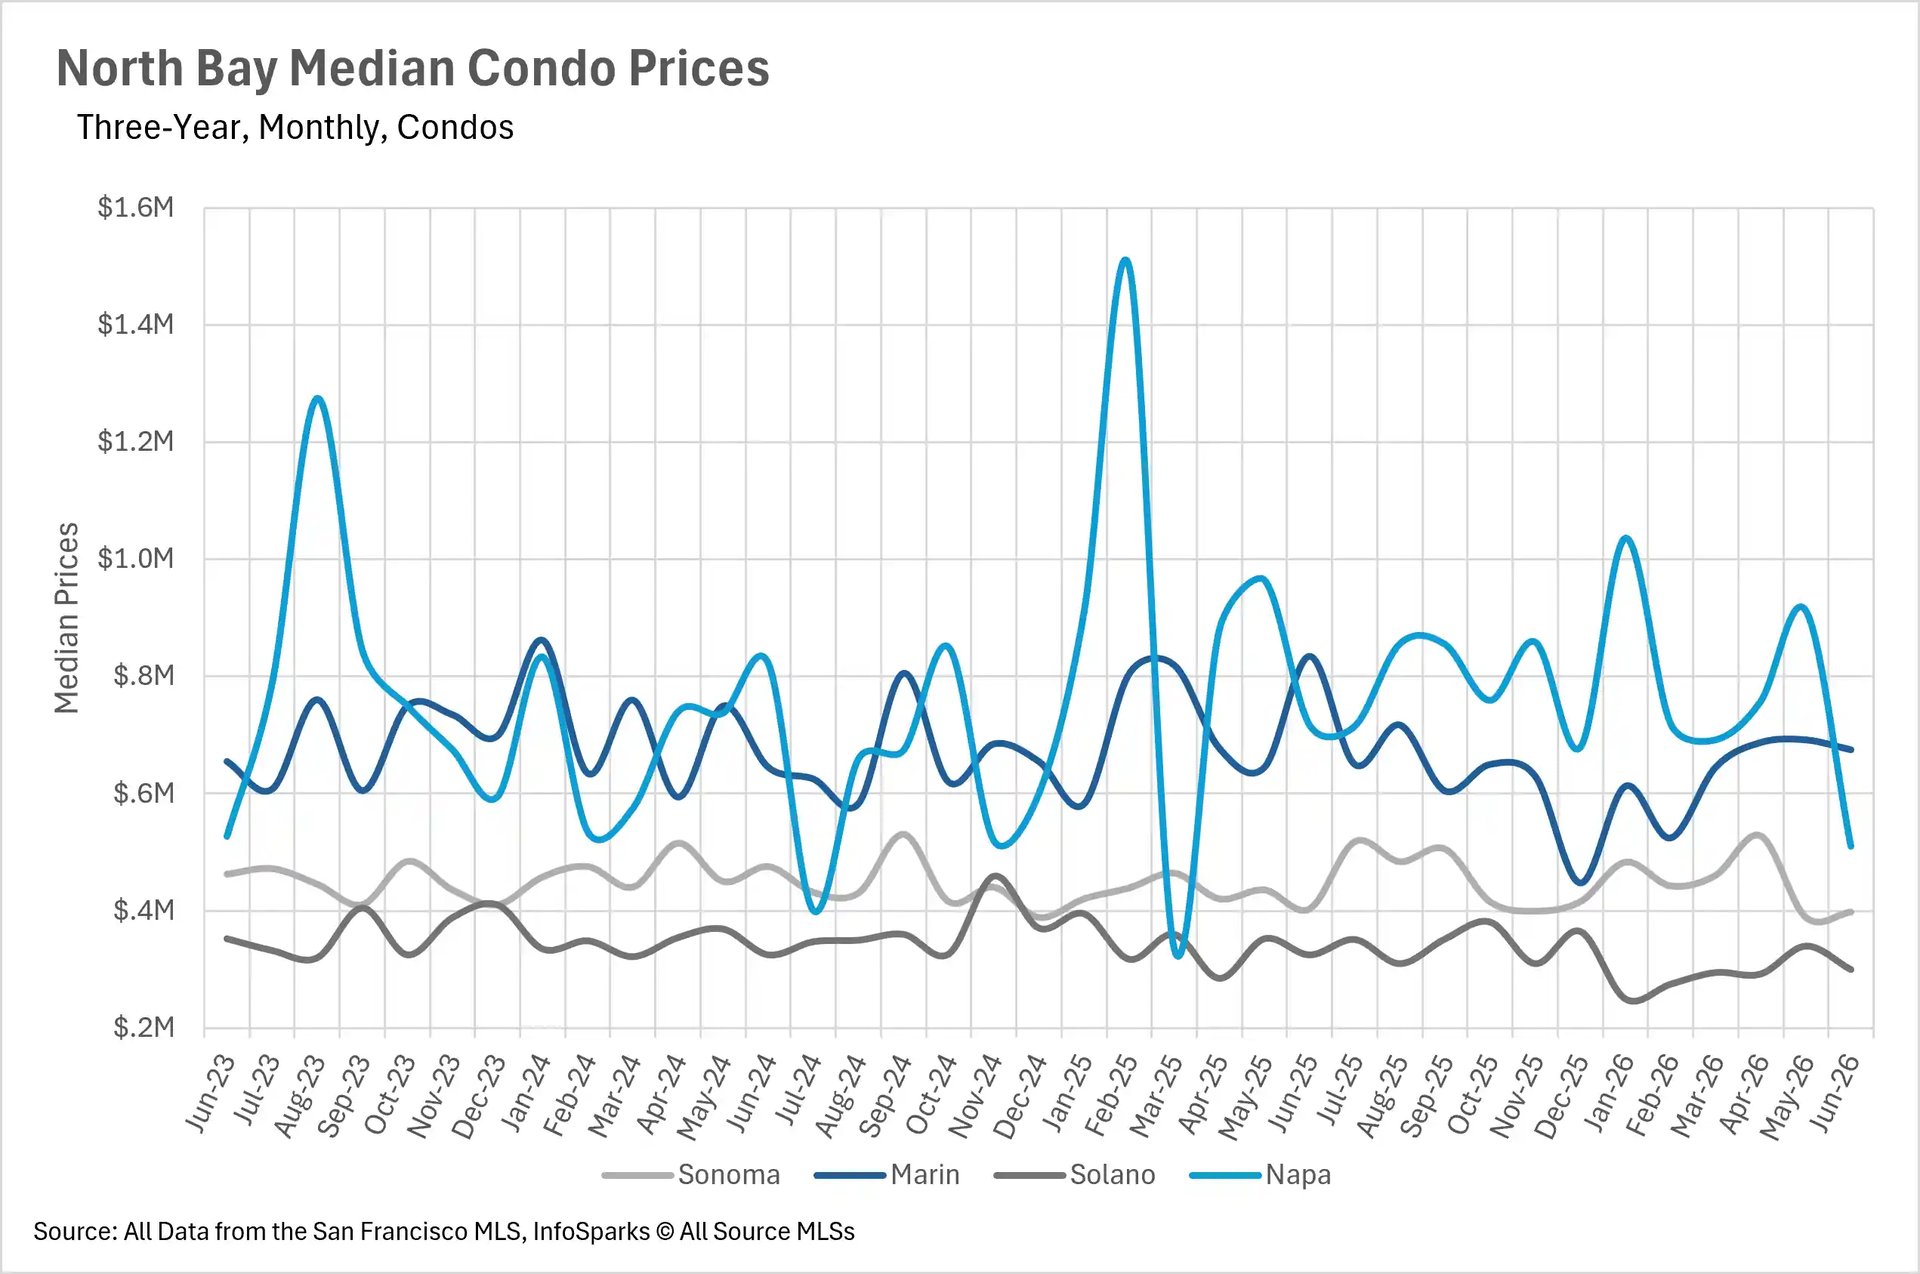
Line chart displaying North Bay median condo prices over a three-year monthly period up to June 2026, comparing real estate trends in Sonoma, Marin, Solano, and Napa counties.

Line chart showing North Bay median single-family home prices over a three-year period up to June 2026, tracking values across Sonoma, Marin, Solano, and Napa counties.

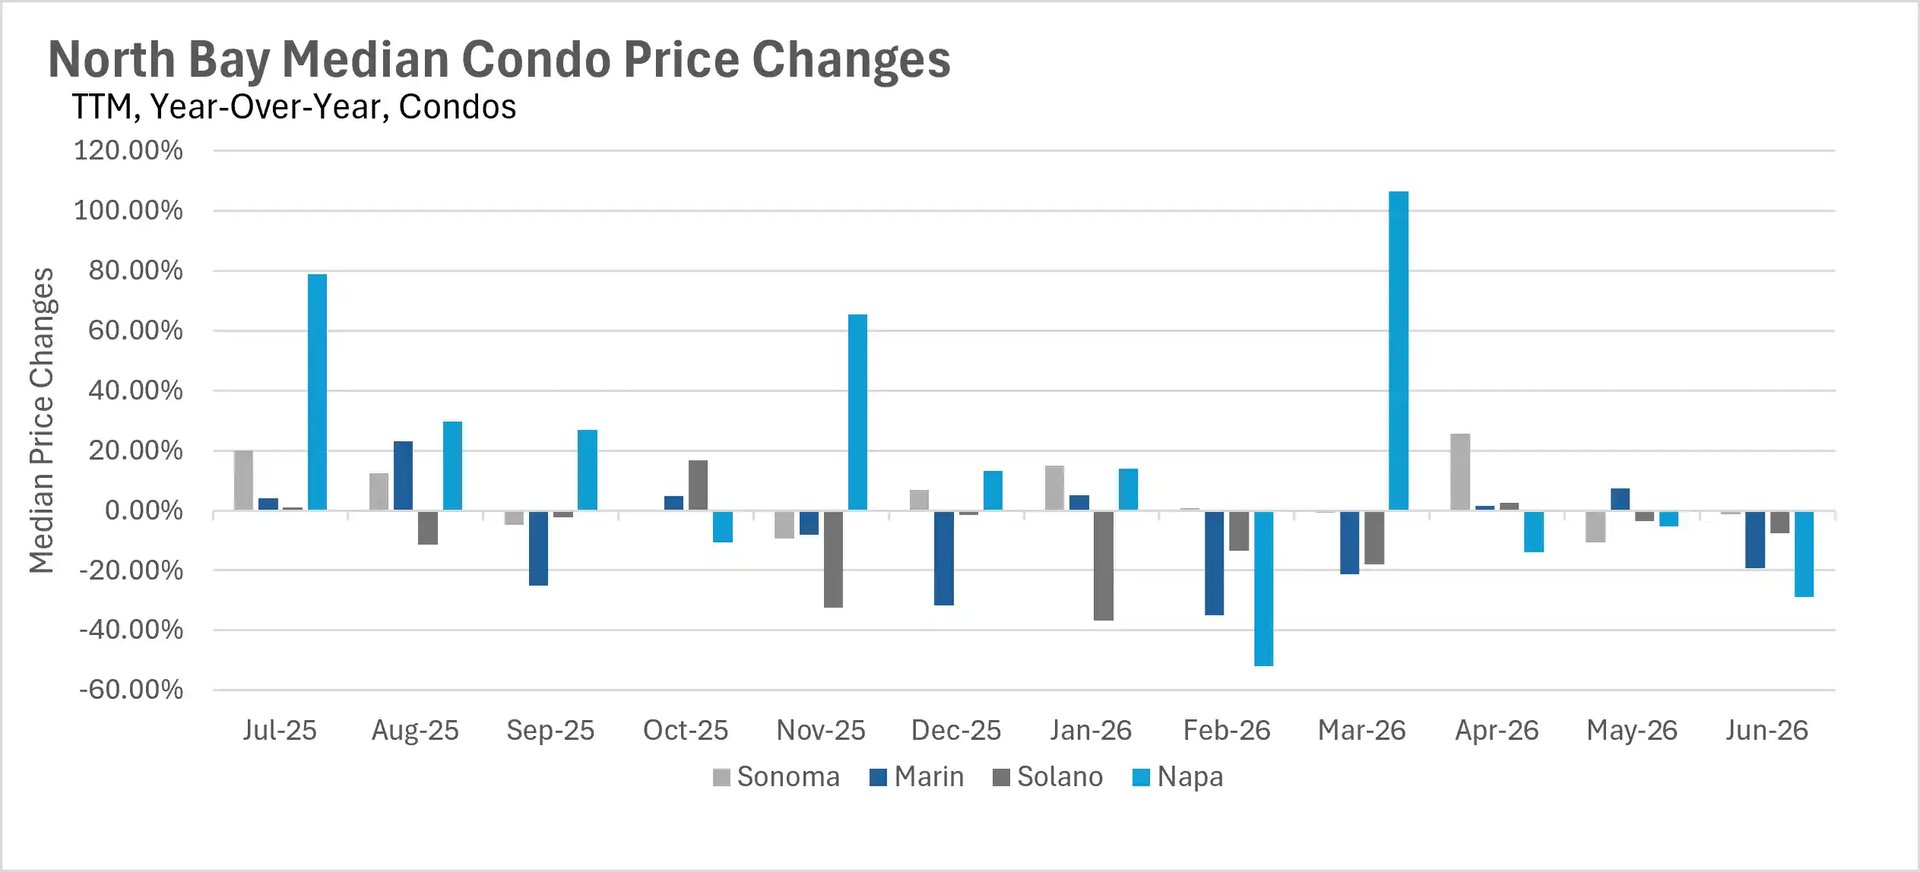
Bar chart illustrating year-over-year median condo price changes in the North Bay up to June 2026, comparing percentage fluctuations for the Sonoma, Marin, Solano, and Napa markets.

Bar chart showing year-over-year median single-family home price percentage changes for North Bay real estate markets up to June 2026 across Sonoma, Marin, Solano, and Napa.

Combination chart tracking two-year monthly condo inventory in the North Bay up to June 2026, detailing the volume of new listings, sold listings, and total active homes for sale.

Combination chart tracking two-year monthly single-family home inventory in the North Bay up to June 2026, highlighting the volume of new listings, sold units, and total active housing supply.

Line graph depicting months of supply inventory for North Bay condos up to June 2026, comparing market saturation and supply levels in Sonoma, Marin, Solano, and Napa counties.

Line graph showing months of supply housing inventory for North Bay single-family homes up to June 2026, tracking market balance across Sonoma, Marin, Solano, and Napa counties.

Line graph tracking the average days on market for condos in the North Bay up to June 2026, comparing the speed of real estate sales in Sonoma, Marin, Solano, and Napa counties.

Line graph tracking the average days on market for single-family homes in the North Bay up to June 2026, comparing sales cycles and buyer velocity for Sonoma, Marin, Solano, and Napa counties.

Line chart displaying East Bay median condo prices over a three-year monthly period up to June 2026, comparing real estate trends in Alameda and Contra Costa counties.

Line chart showing East Bay median single-family home prices over a three-year period up to June 2026, tracking values across Alameda and Contra Costa counties.

Bar chart illustrating year-over-year median condo price changes in the East Bay up to June 2026, comparing percentage fluctuations for the Alameda and Contra Costa real estate markets.

Bar chart showing year-over-year median single-family home price percentage changes for East Bay real estate markets up to June 2026 across Alameda and Contra Costa counties.

Combination chart tracking two-year monthly condo inventory in the East Bay up to June 2026, detailing the volume of new listings, sold listings, and total active homes for sale.

Combination chart tracking two-year monthly single-family home inventory in the East Bay up to June 2026, highlighting the volume of new listings, sold units, and total active housing supply.

Line graph depicting months of supply inventory for East Bay condos up to June 2026, comparing market saturation and supply levels in Alameda and Contra Costa counties.

Line graph showing months of supply housing inventory for East Bay single-family homes up to June 2026, tracking market balance across Alameda and Contra Costa counties.

Line graph tracking the average days on market for condos in the East Bay up to June 2026, comparing the speed of real estate sales in Alameda and Contra Costa counties.

Line graph tracking the average days on market for single-family homes in the East Bay up to June 2026, comparing sales cycles and buyer velocity for Alameda and Contra Costa counties.

Let’s Talk

You’ve got questions and we can’t wait to answer them.

Follow Us on Instagram