The Local Lowdown
Quick Take:
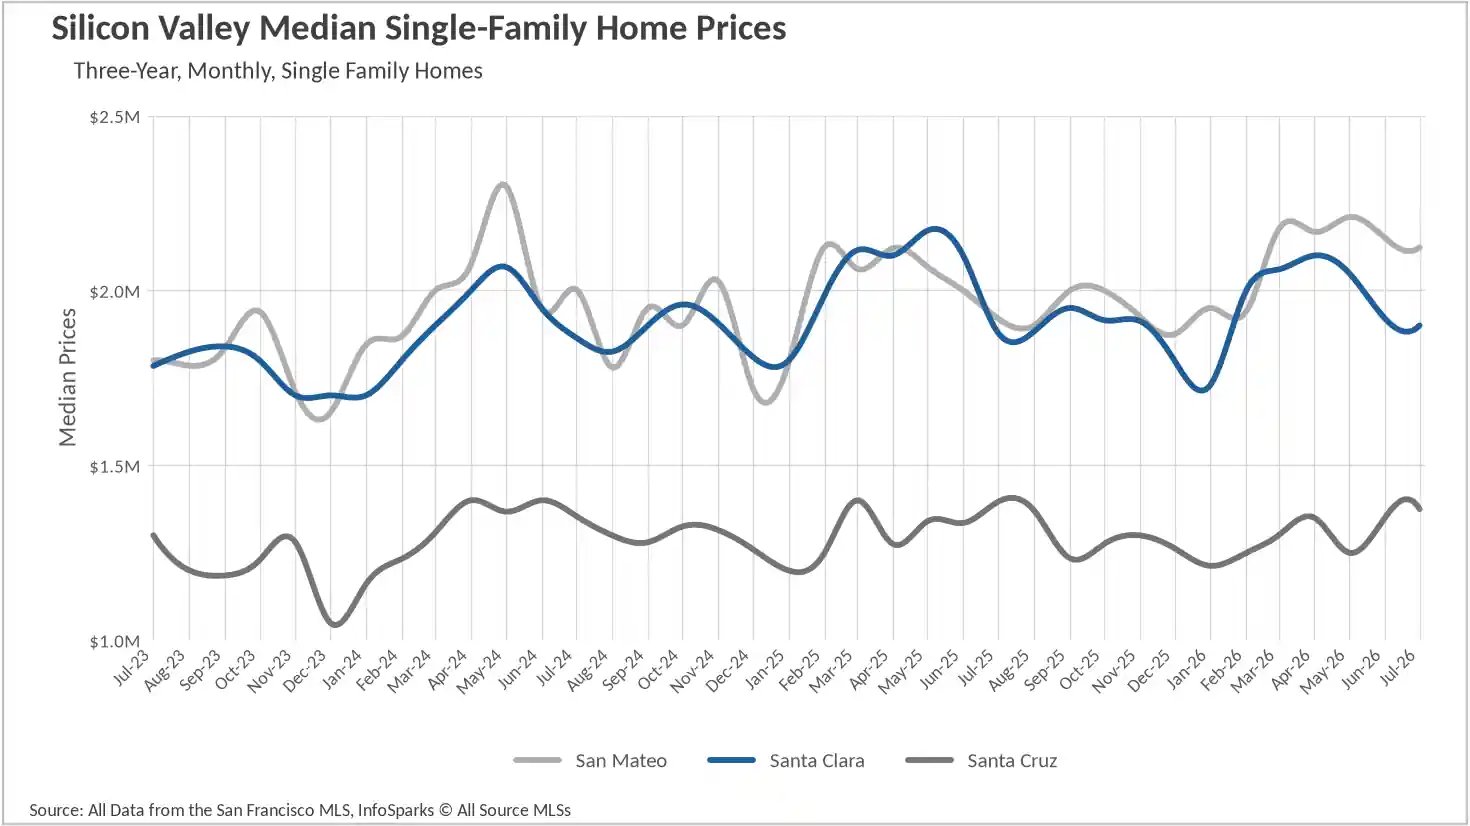
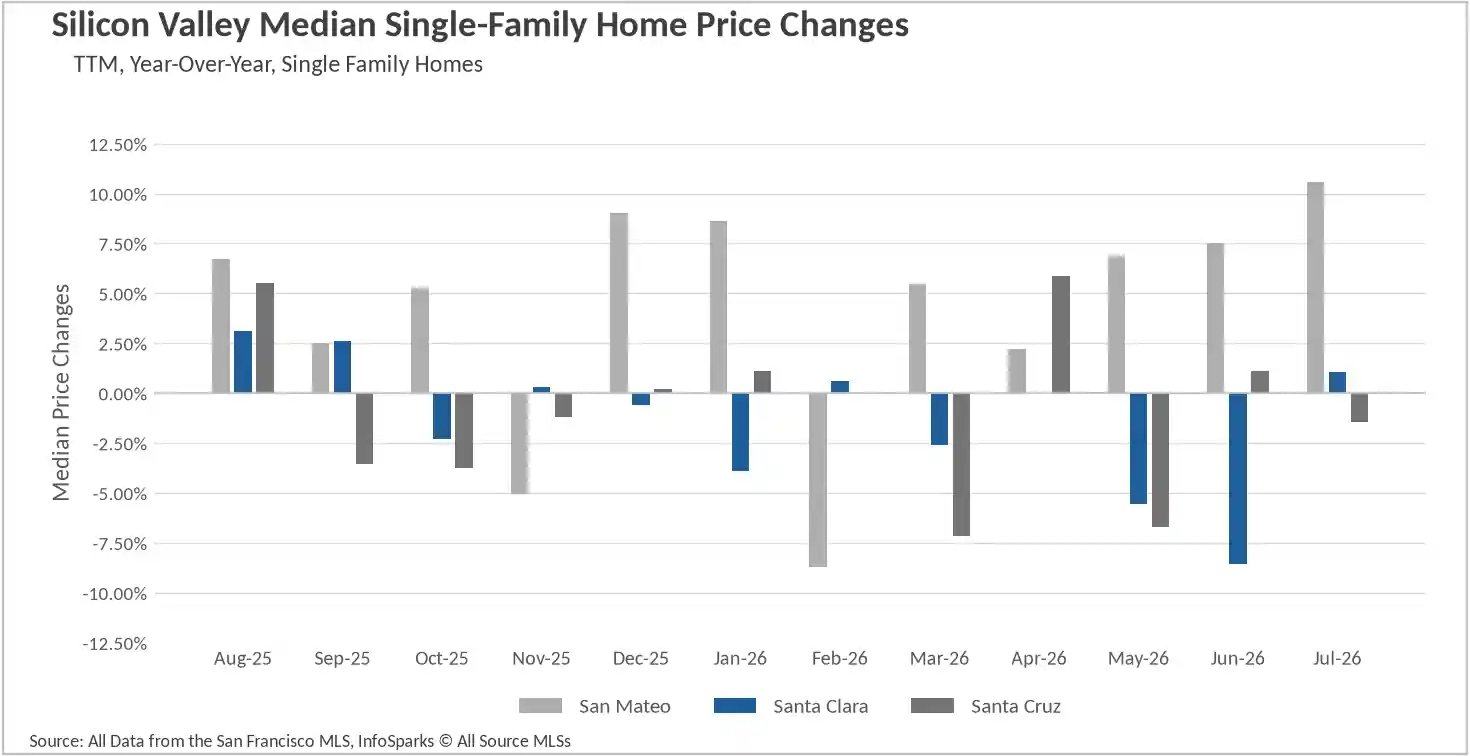
Single-family prices held above year-ago levels almost everywhere in July, led by San Francisco at $2,050,000 (up 24.87%) and San Mateo County at $2,123,000 (up 10.57%), while most other counties posted modest gains and eased off their spring peaks.
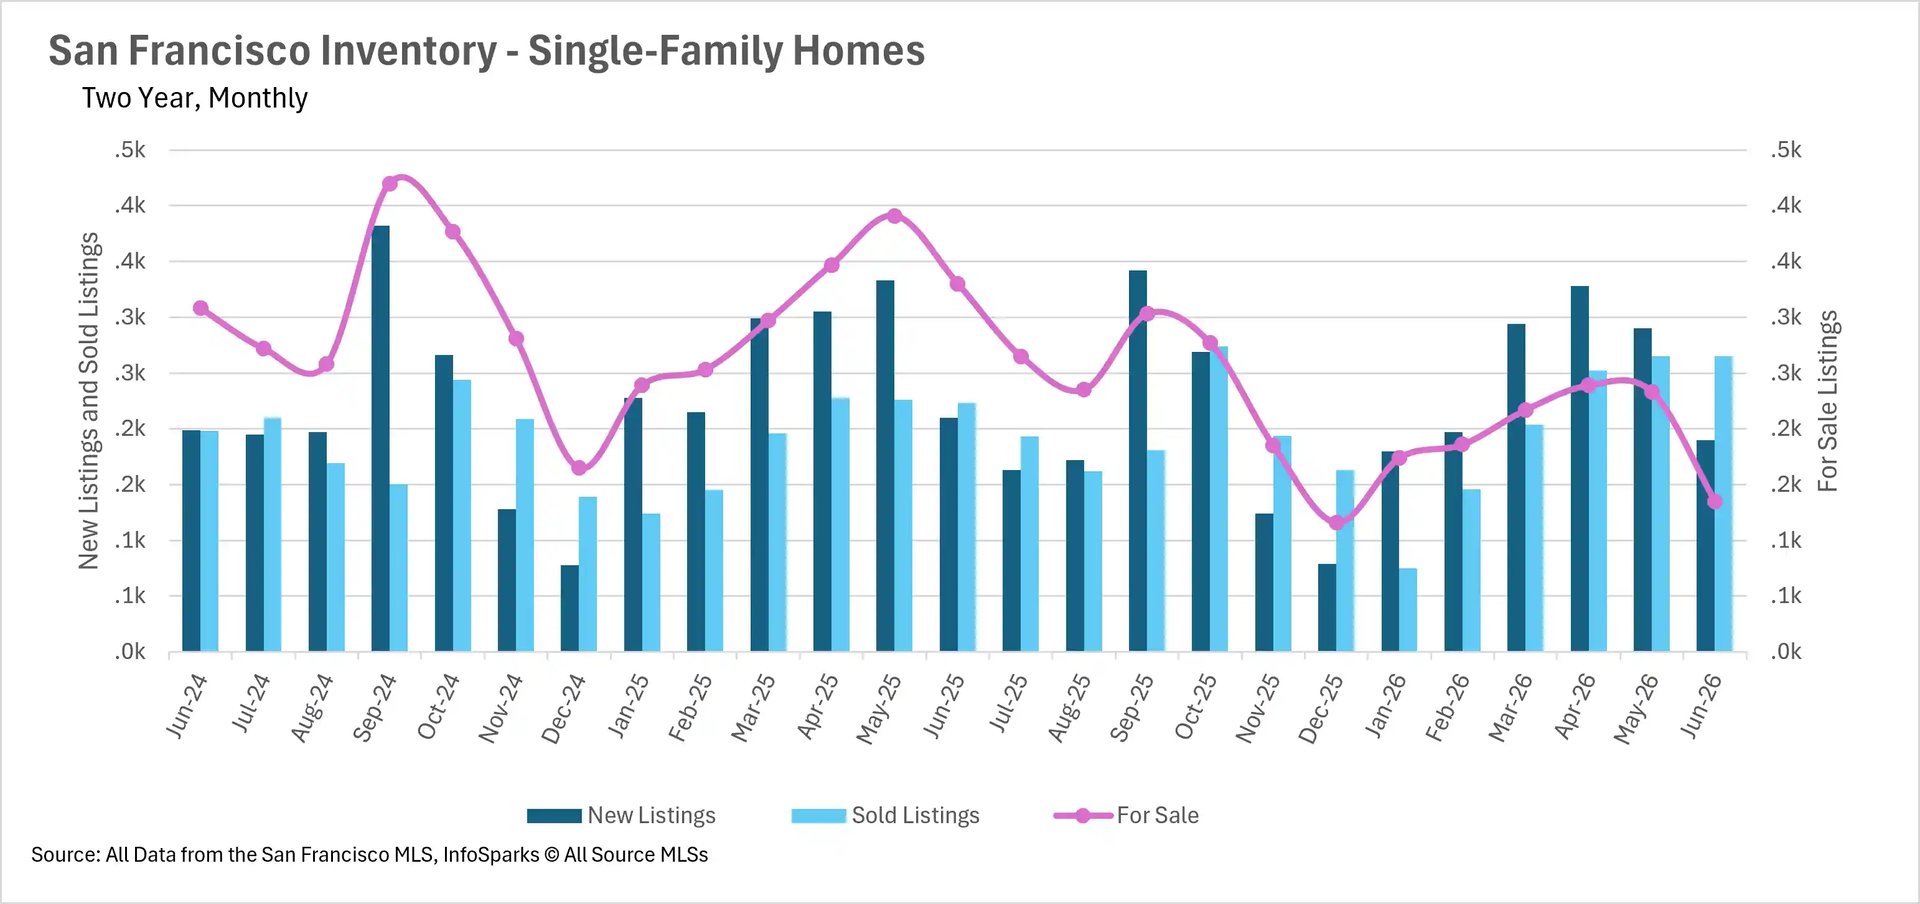
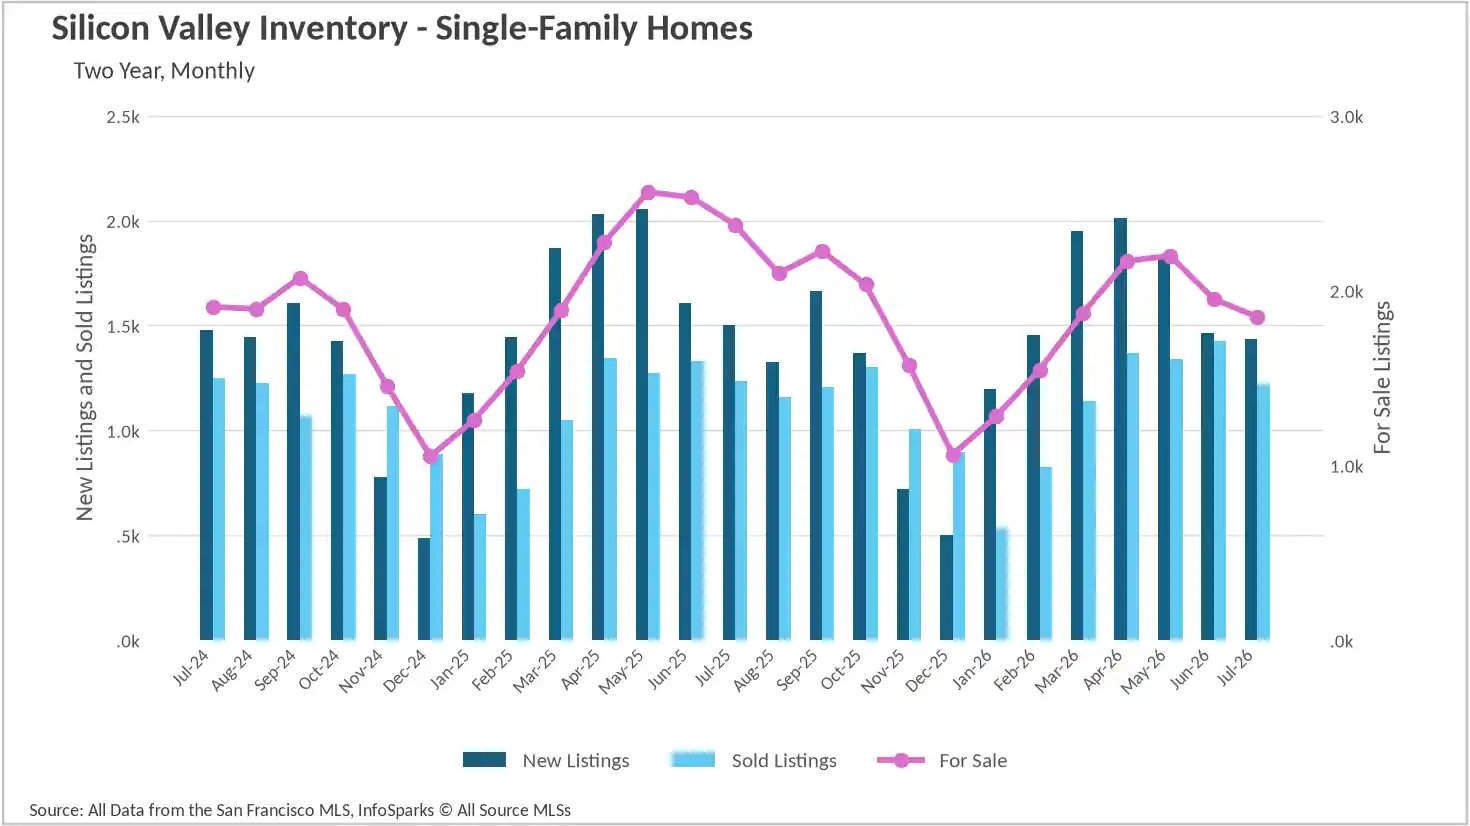
Inventory is the story of the summer. Just over 7,300 single-family homes were for sale across the Bay Area's four subregions, with declines ranging from 22% in Silicon Valley to 42% in San Francisco.
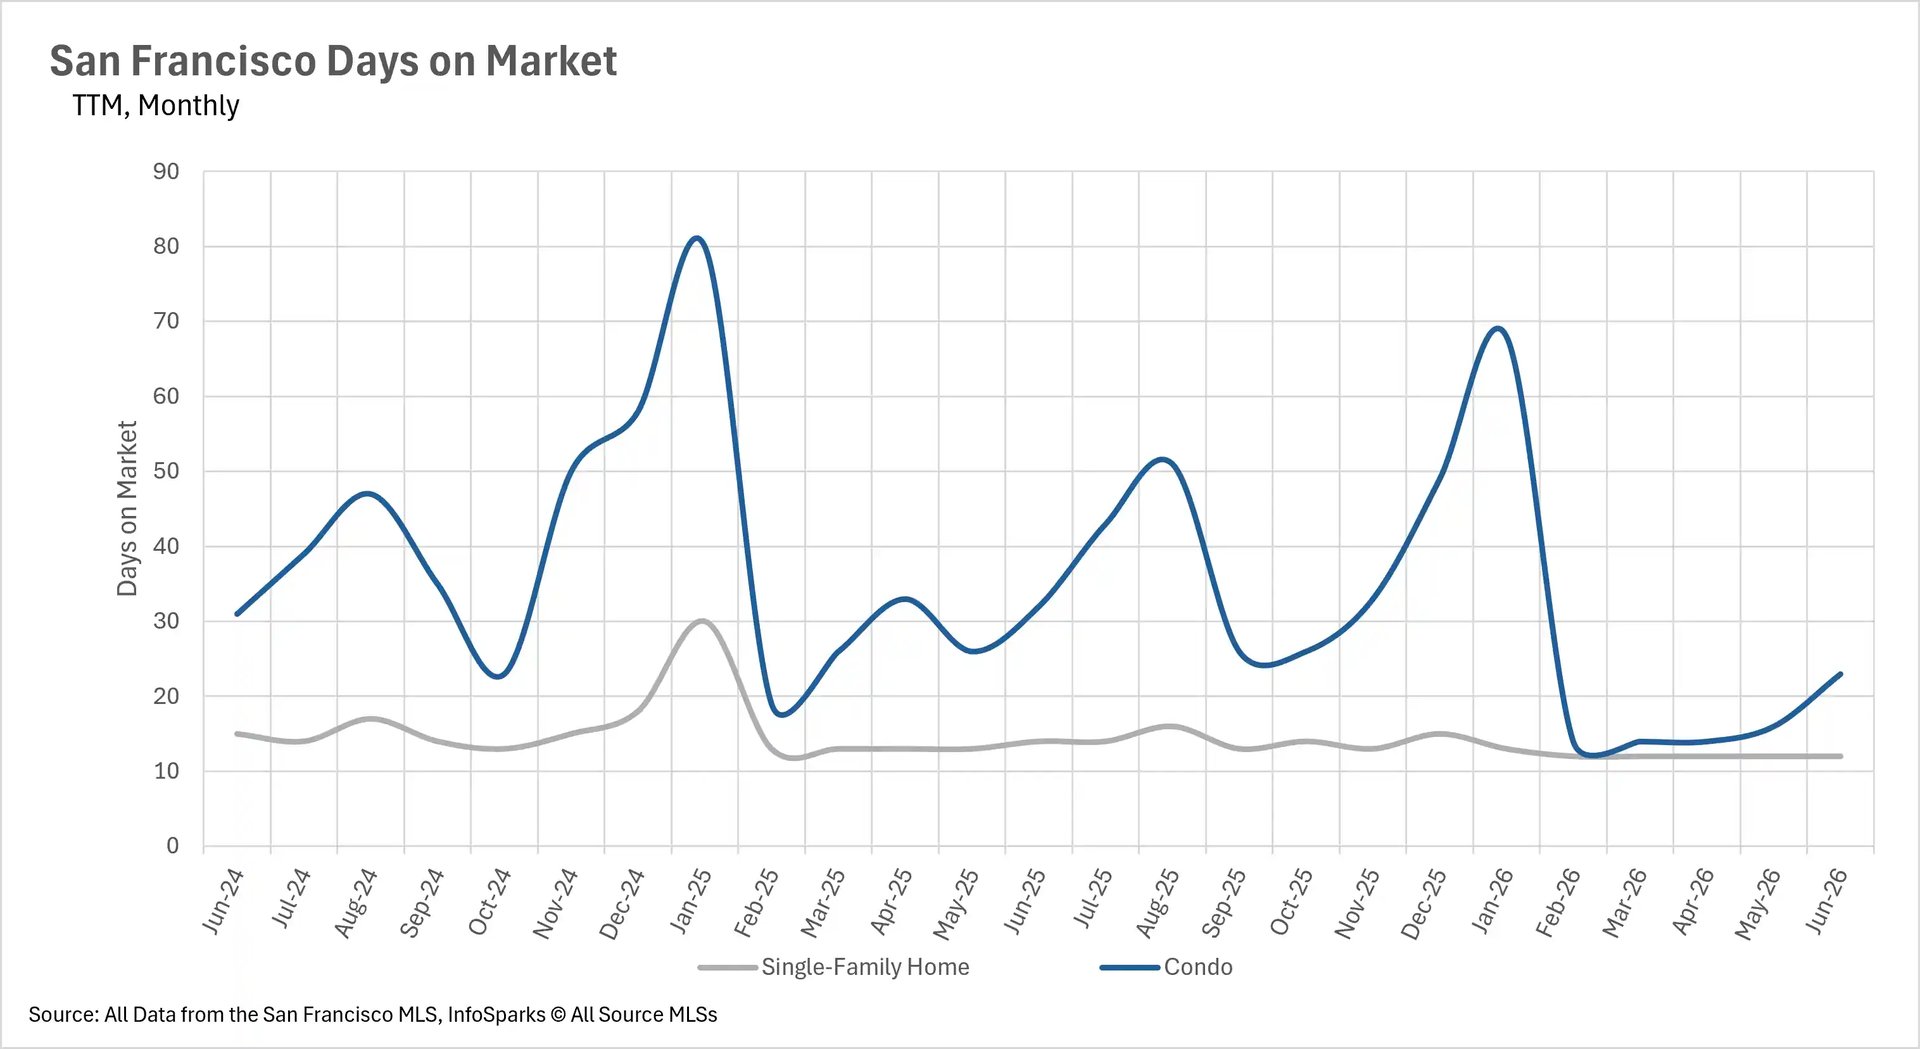
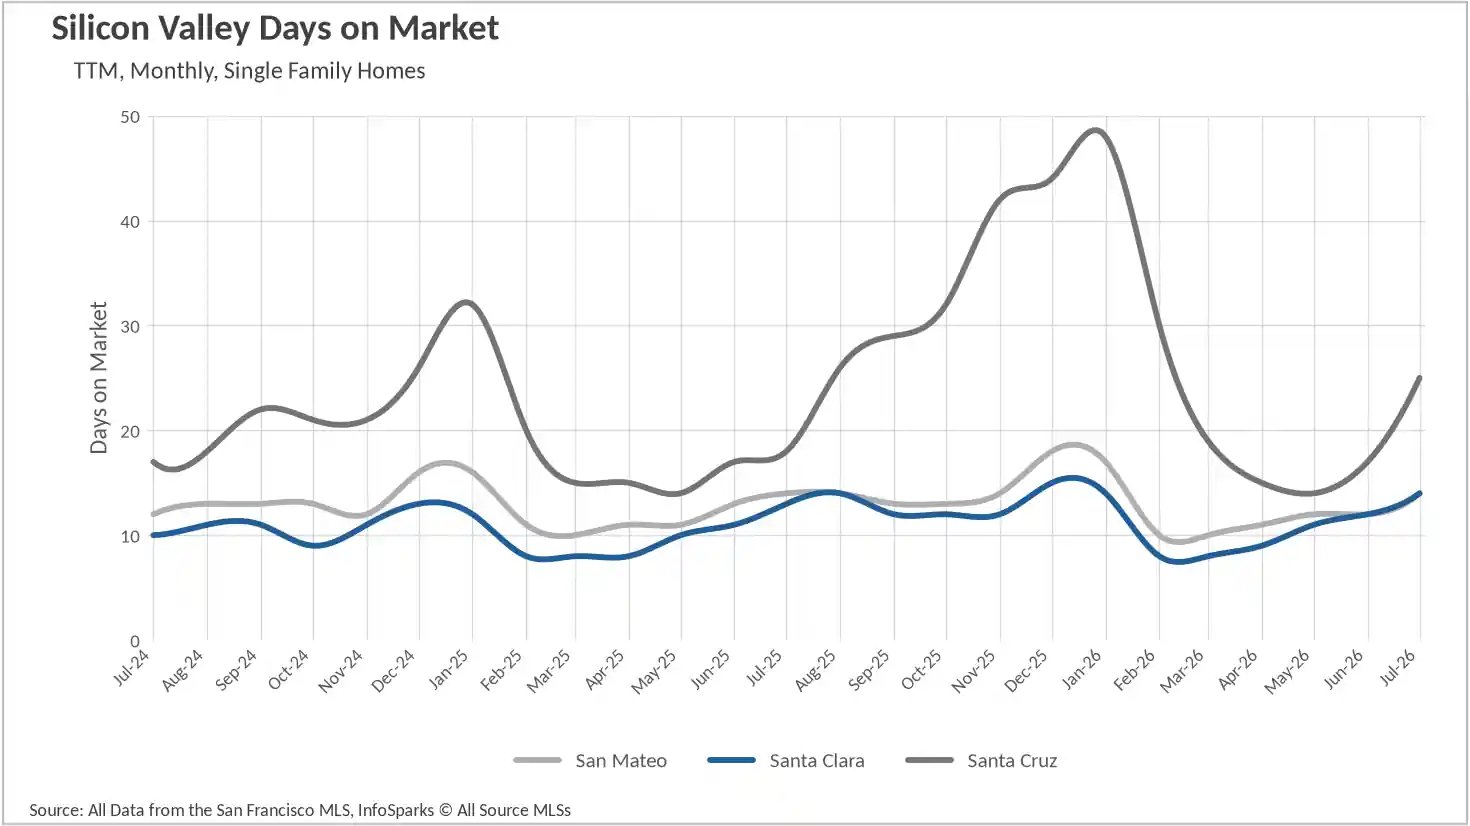
Homes are moving quickly, with seven of the region's ten counties clearing single-family listings in 20 days or less.
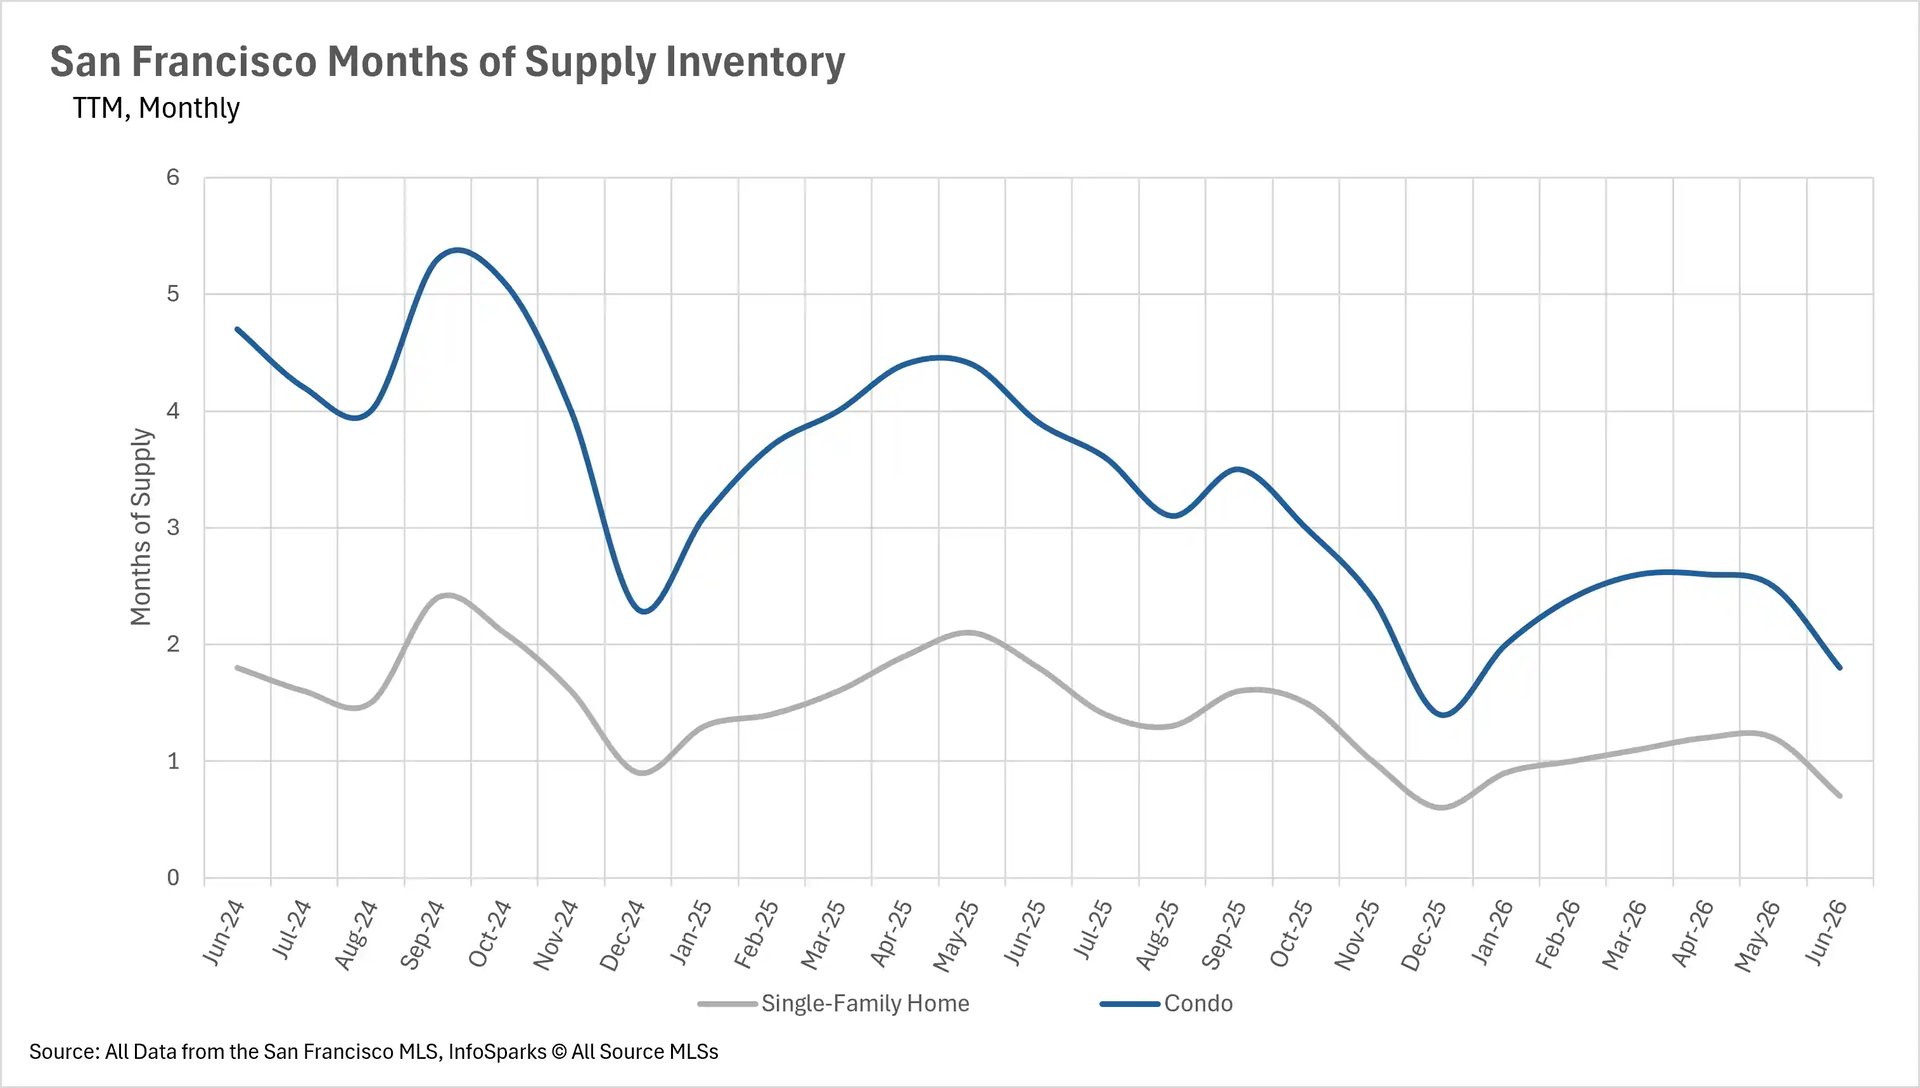
Nearly every single-family market in the region sits below three months of supply, and the condo segment is tightening fast behind it.
Note: You can find the charts/graphs for the Local Lowdown at the end of this section.
A summer step down that still leaves the region ahead of last year
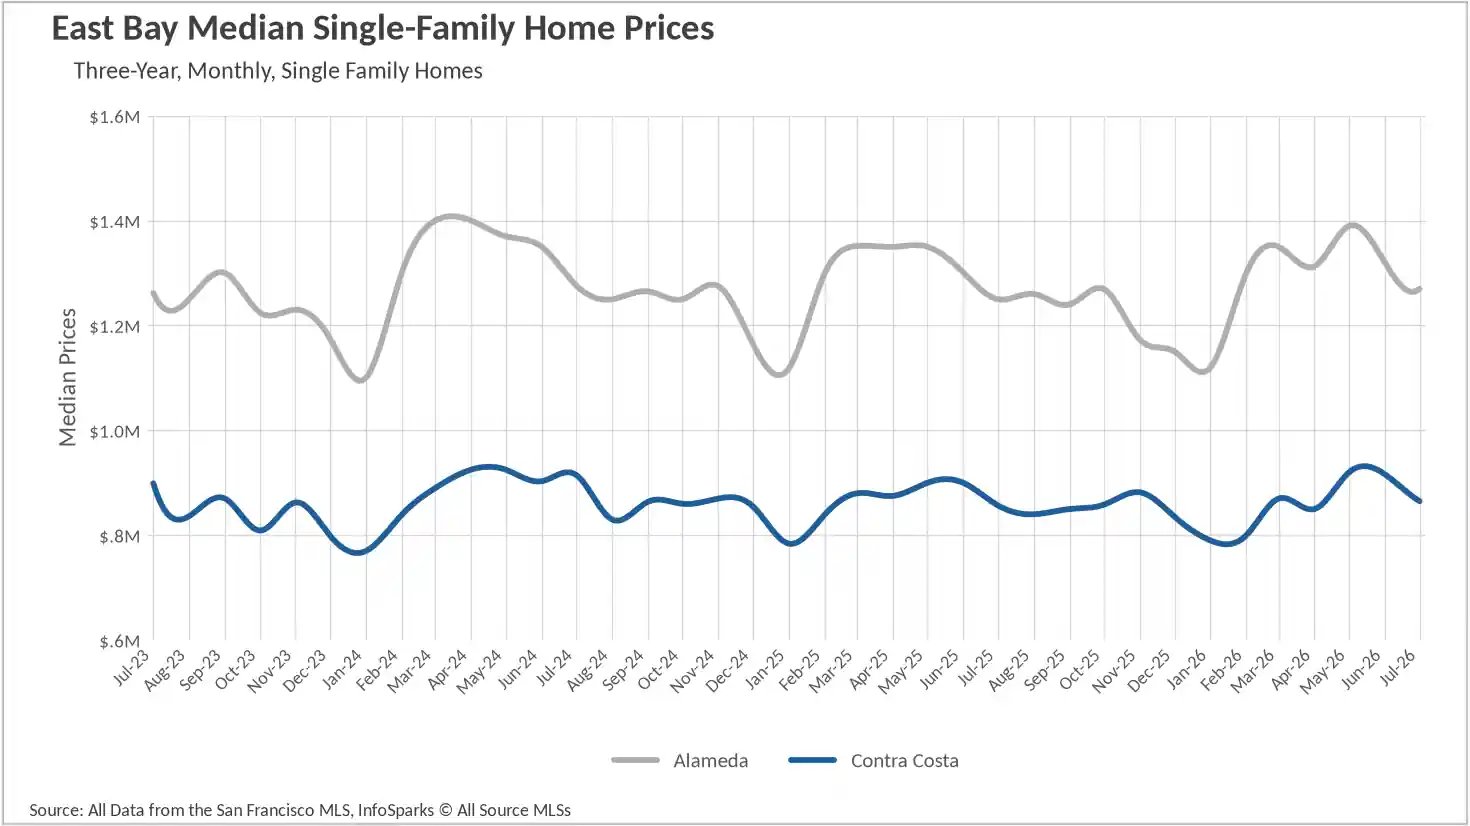
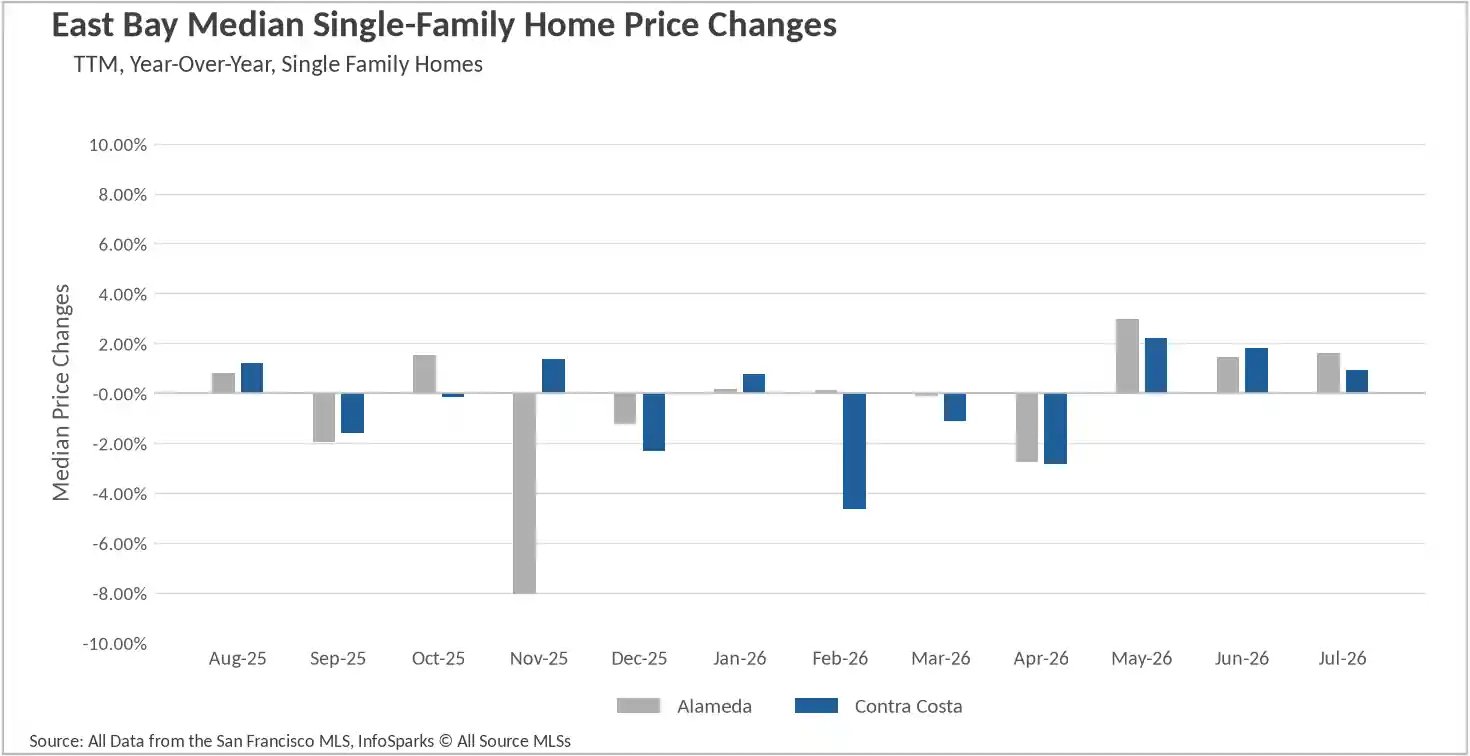
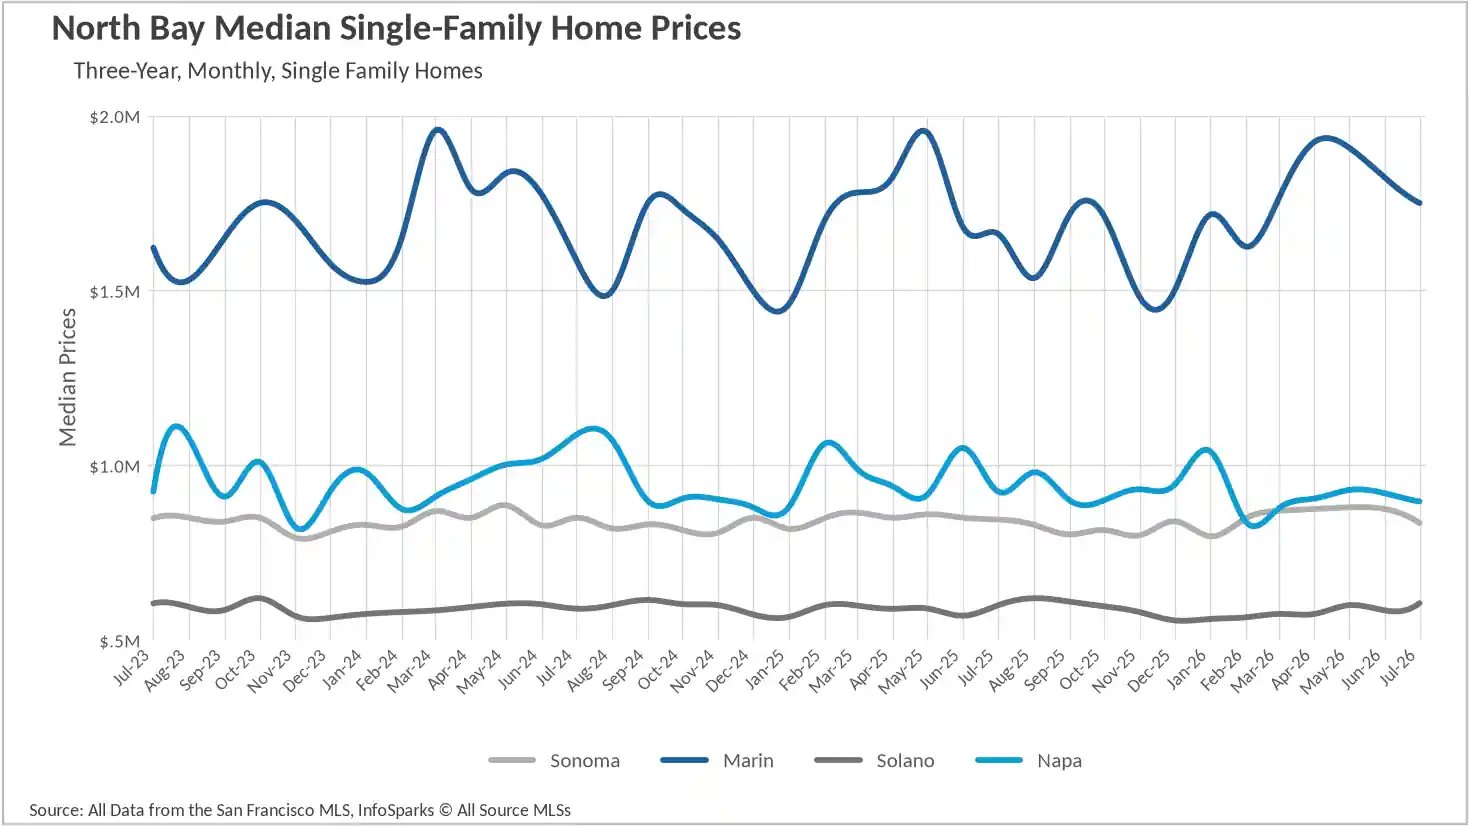
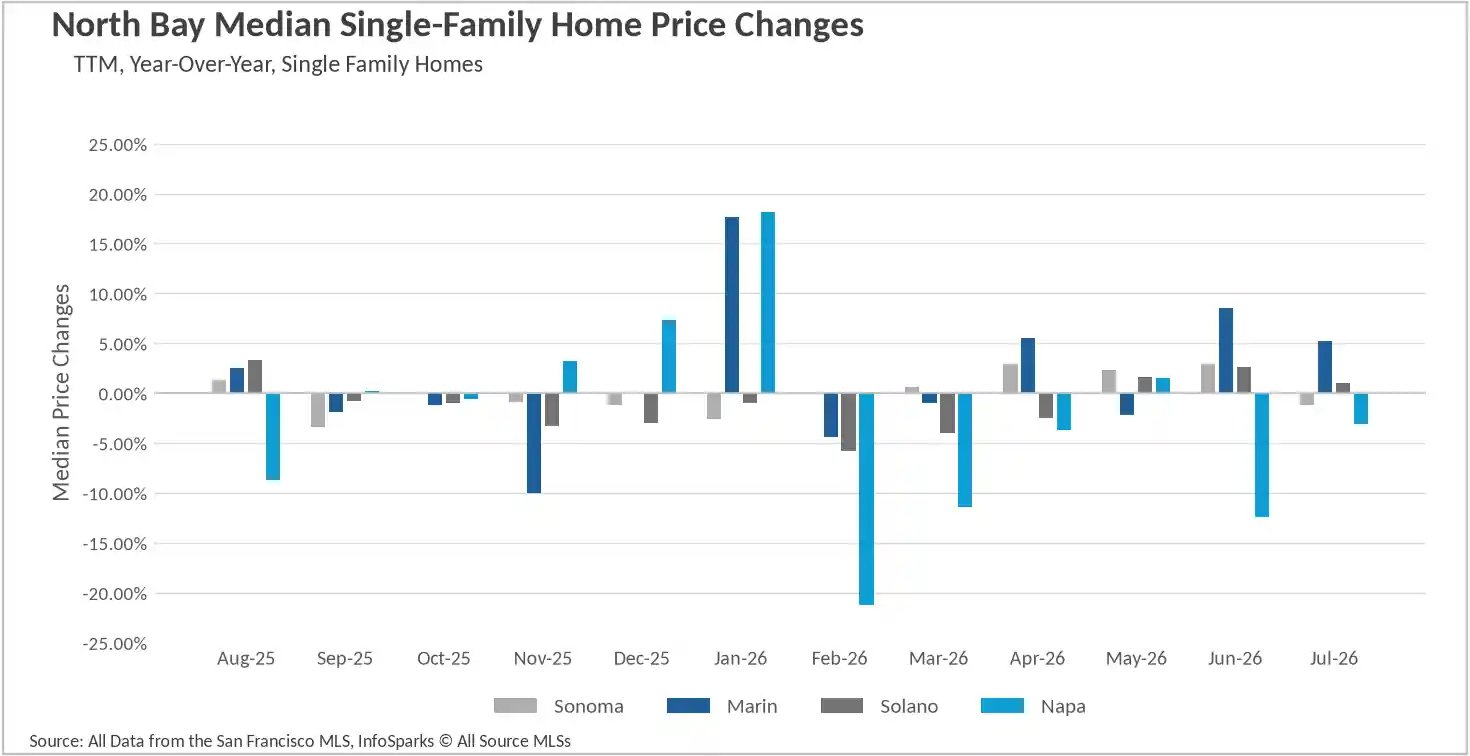
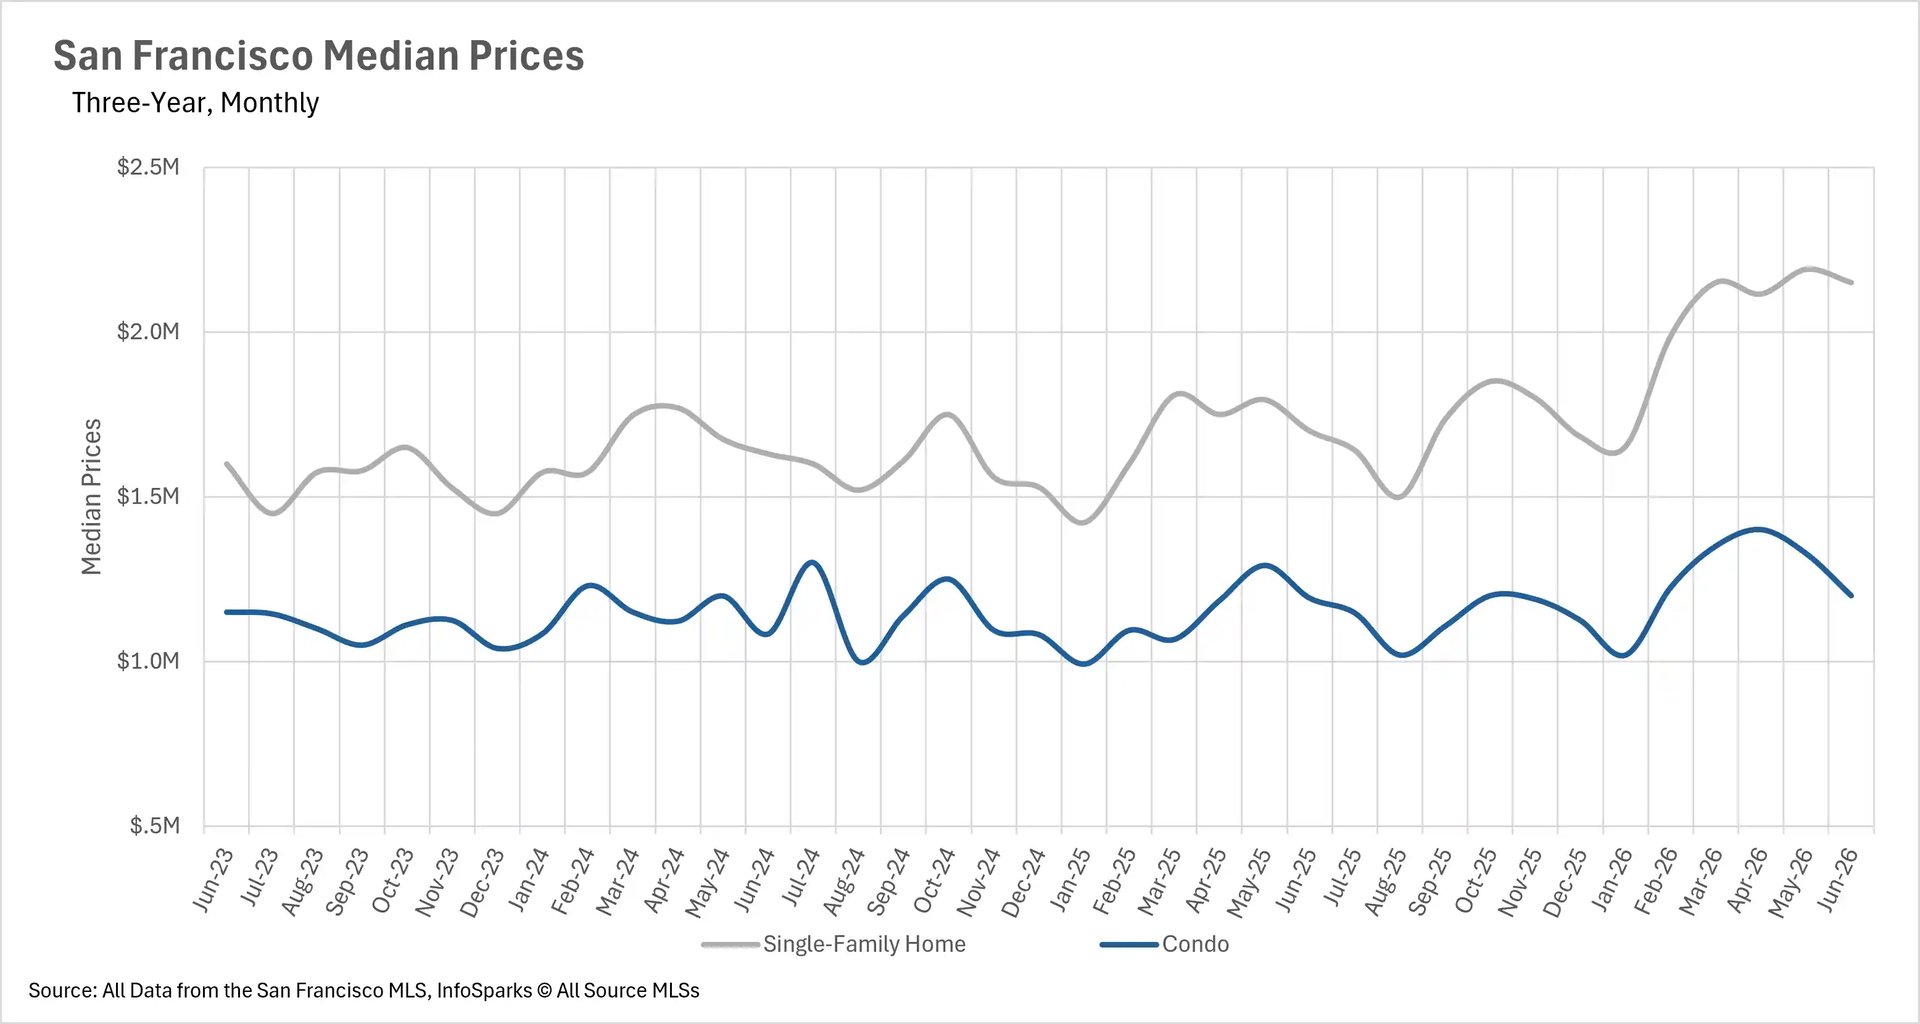
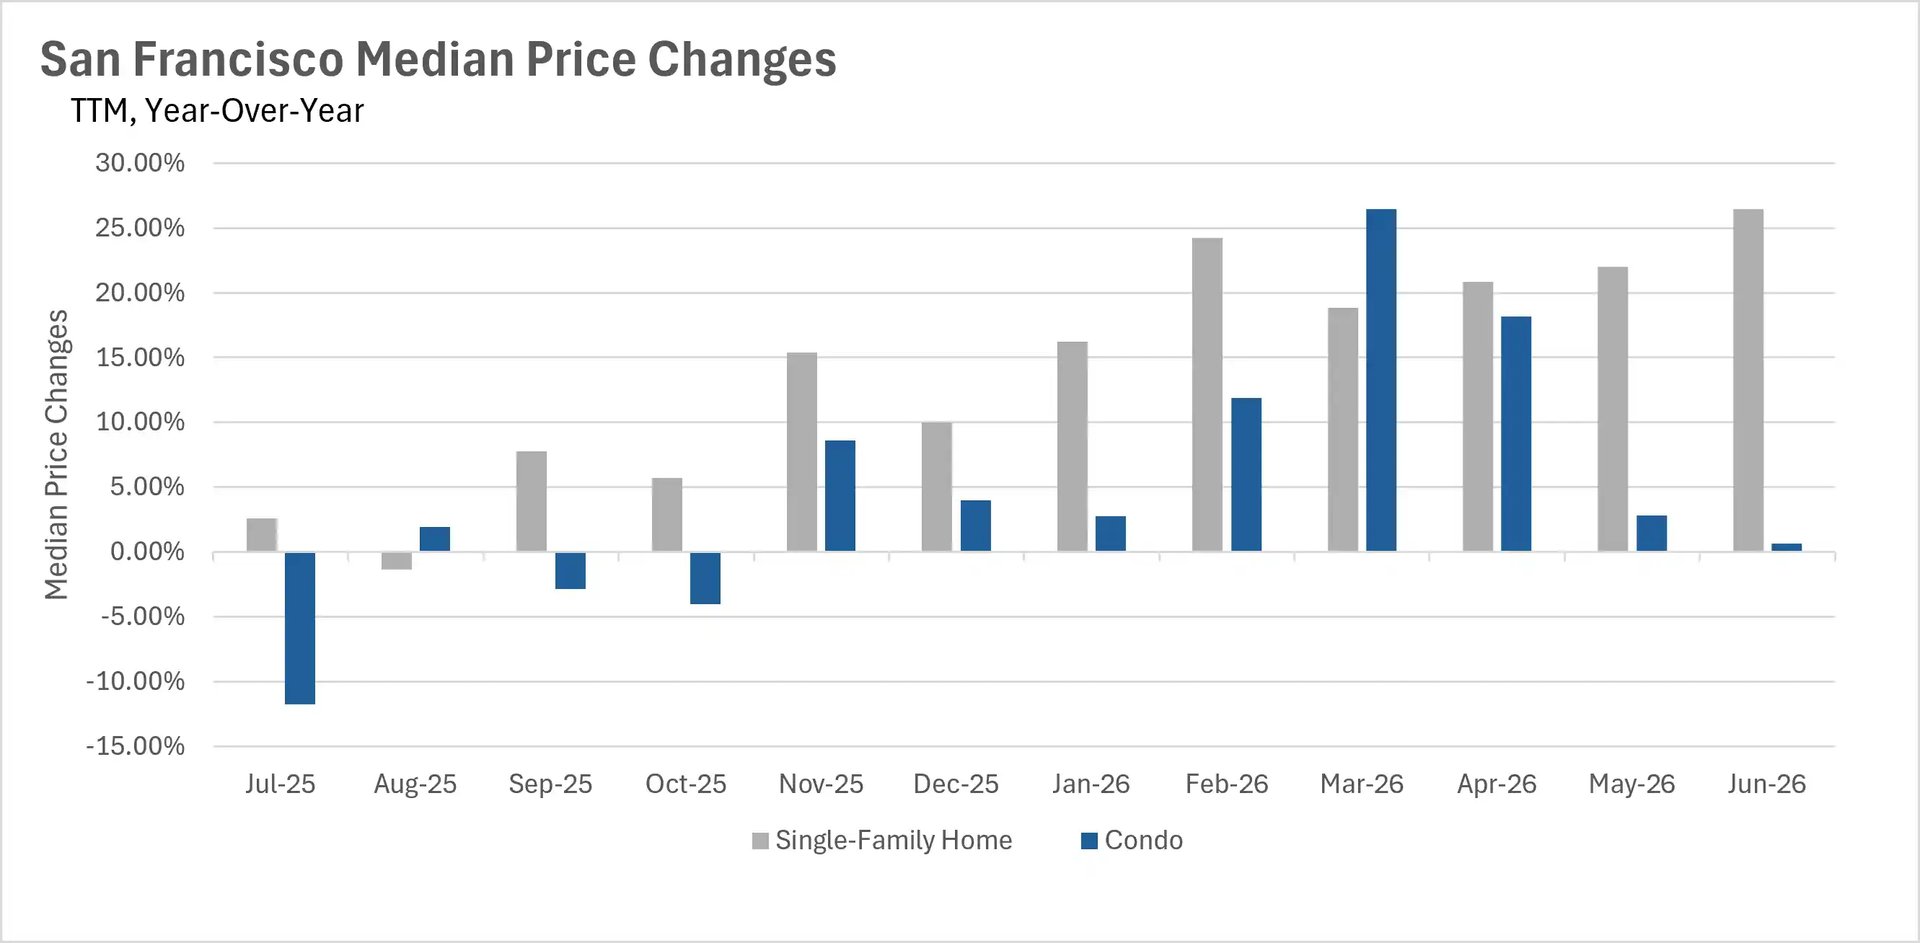
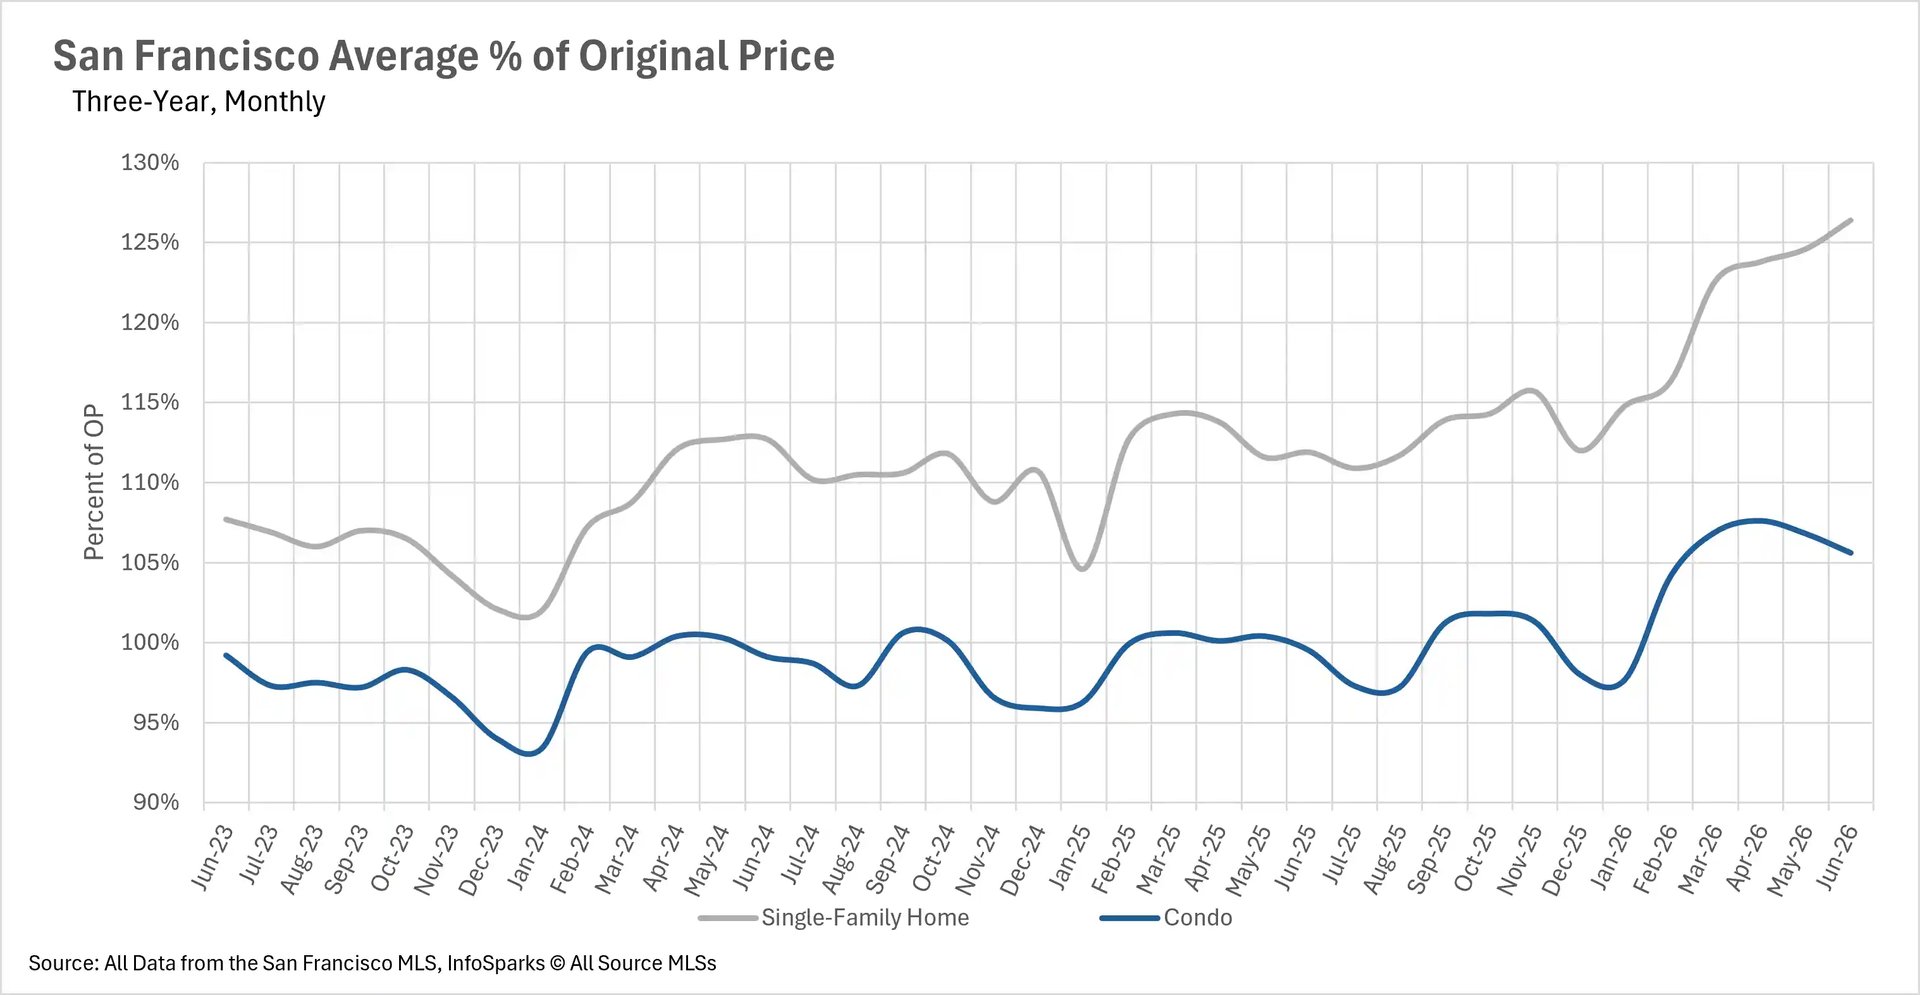
July followed the script the Bay Area has written for the past several summers: medians eased back from their May and June highs while remaining comfortably above where they stood twelve months ago. San Francisco set the pace on the year-over-year comparison, with the single-family median settling at $2,050,000, down 4.65% from June's $2,150,000 but a remarkable 24.87% above last July's $1,641,750. San Mateo County posted the region's highest median at $2,123,000, up 10.57% from a year ago, while Marin County added 5.26% to reach $1,750,000.
Elsewhere the gains were narrower. Santa Clara County was essentially flat at $1,900,000, up just 1.06% year over year and down for a third straight month from May's $2,050,000. Alameda County came in at $1,270,000 and Contra Costa at $865,000, up 1.60% and 0.93% respectively after peaking in May. Solano County was the month's monthly standout, climbing 3.59% from June to $606,000. Only Santa Cruz, Sonoma, and Napa Counties finished below last July, each by less than 3.1%.
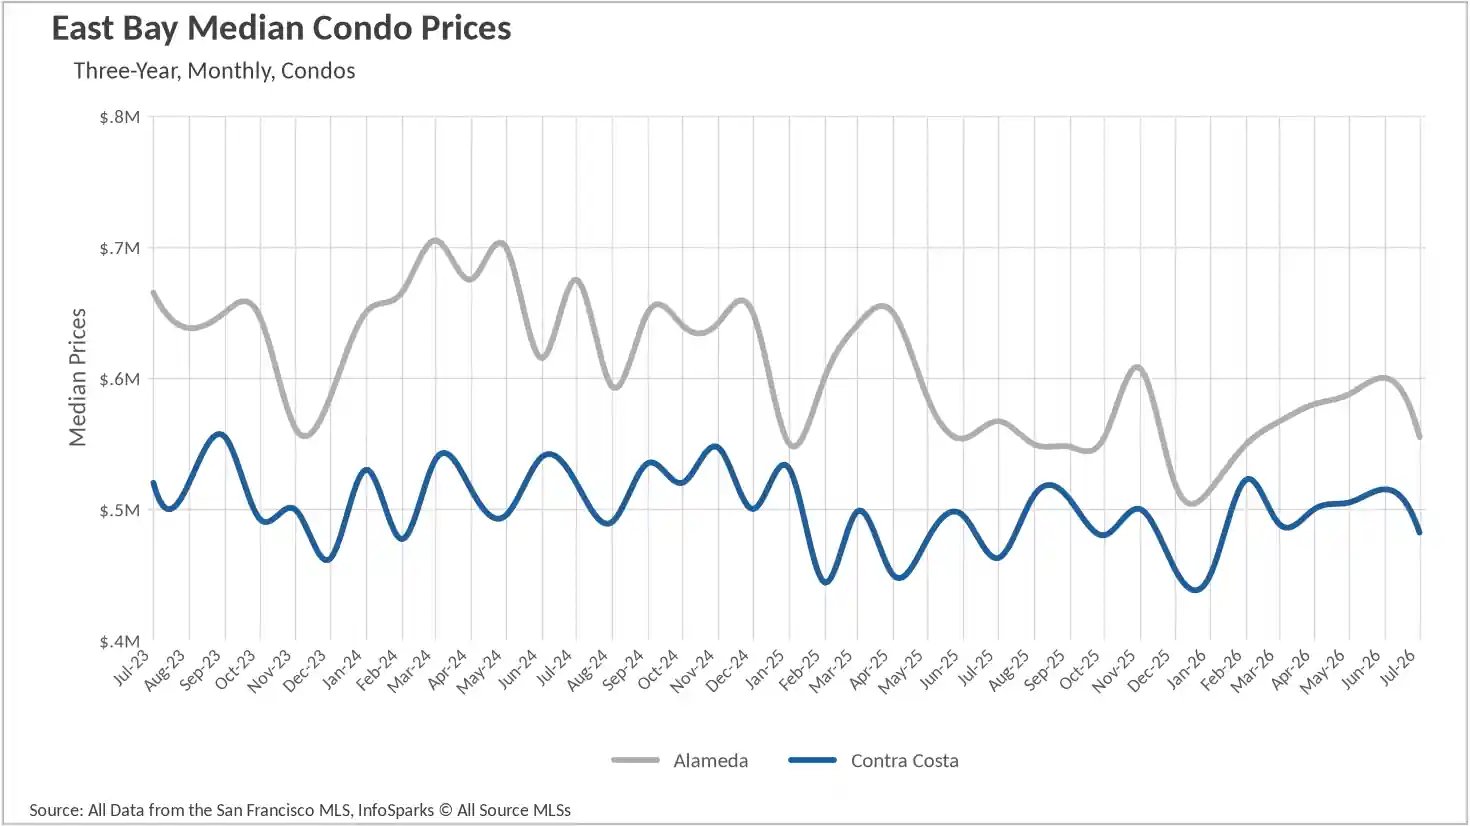
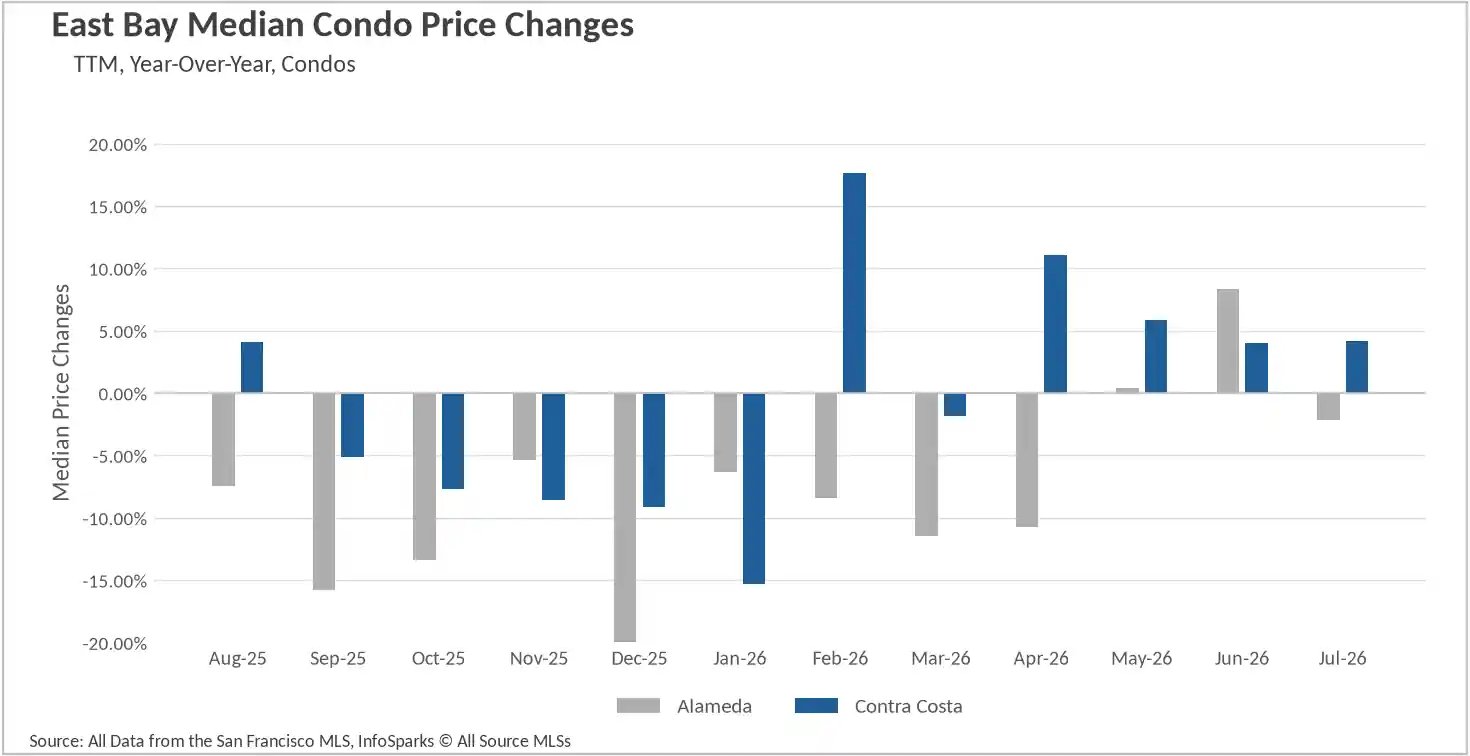
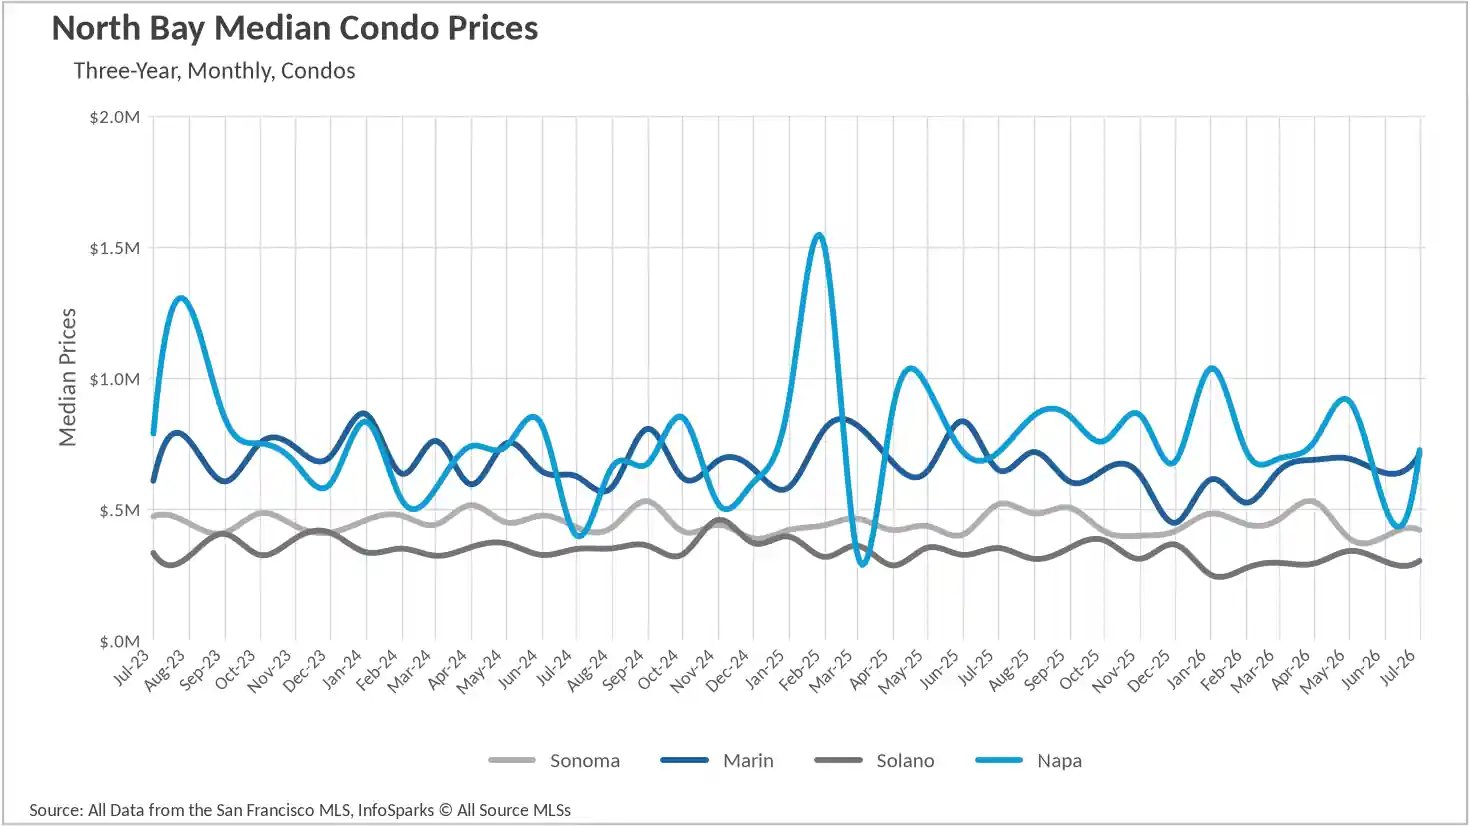
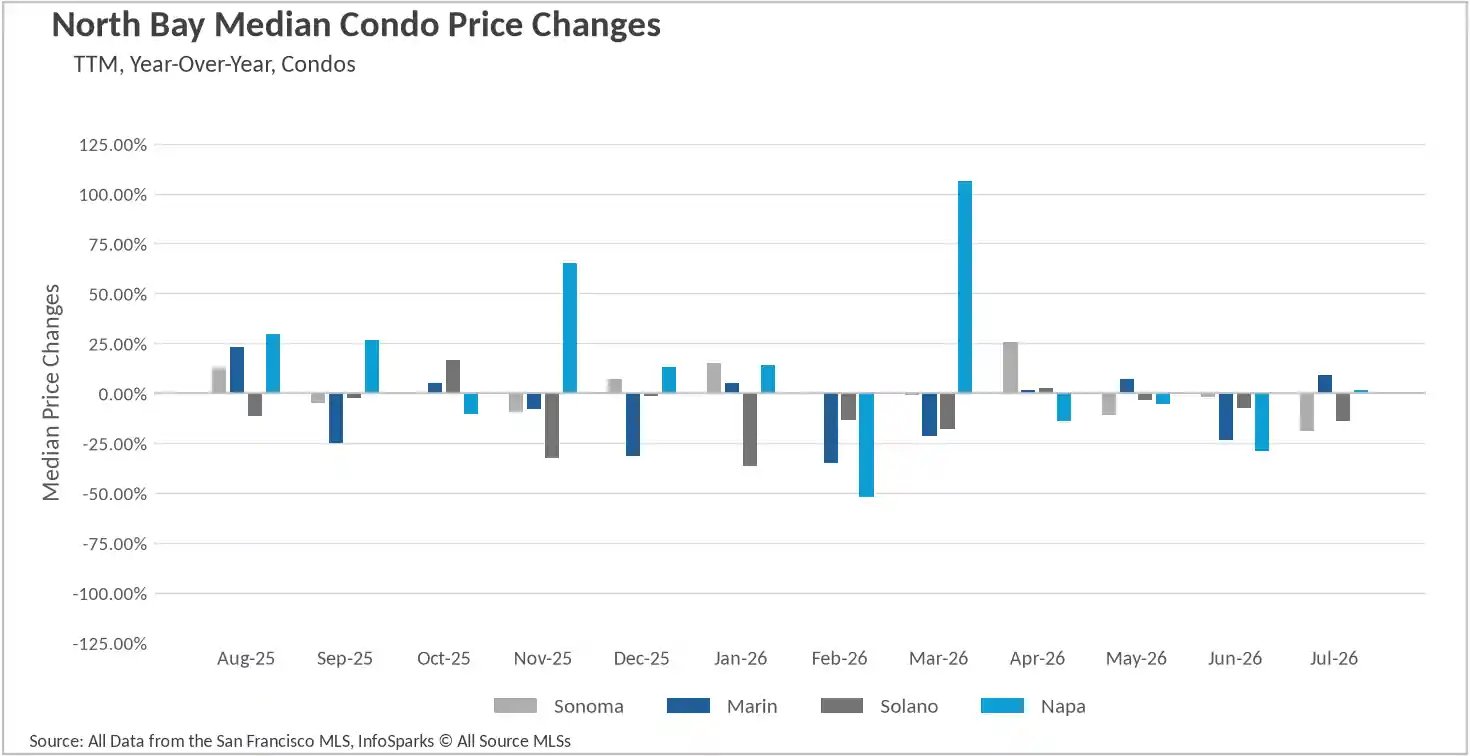
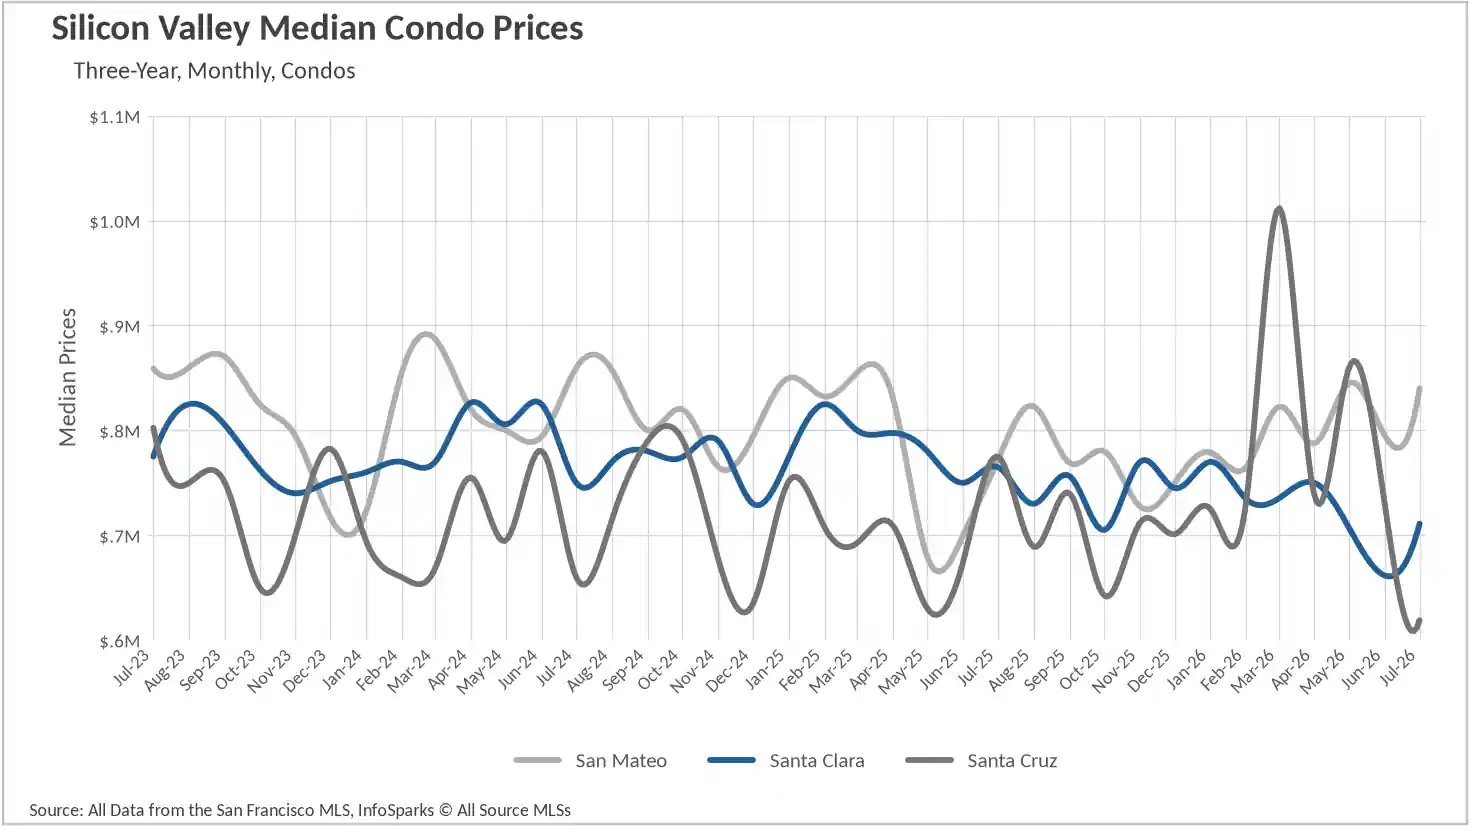
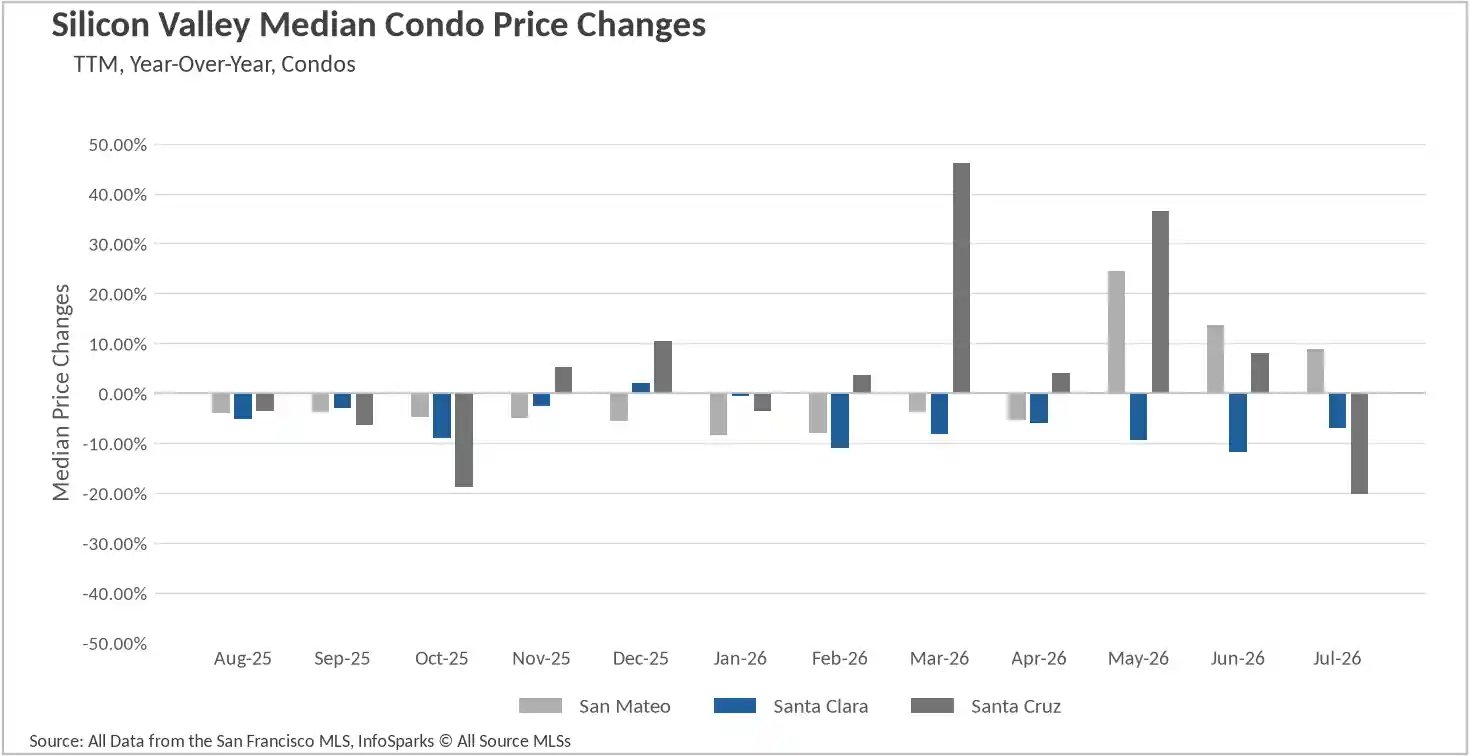
The condo picture was genuinely split. San Francisco condos rose 4.17% from June to $1,250,000, an 8.93% annual gain, and Marin County condos reached $707,500, up 8.85%. San Mateo County condos added 8.88% to $840,000. Working the other direction, Sonoma County condos fell 18.84% and Santa Cruz County condos dropped 20.13%, although transaction counts in those segments are thin enough that single-month prints deserve caution.
The supply squeeze is now region-wide
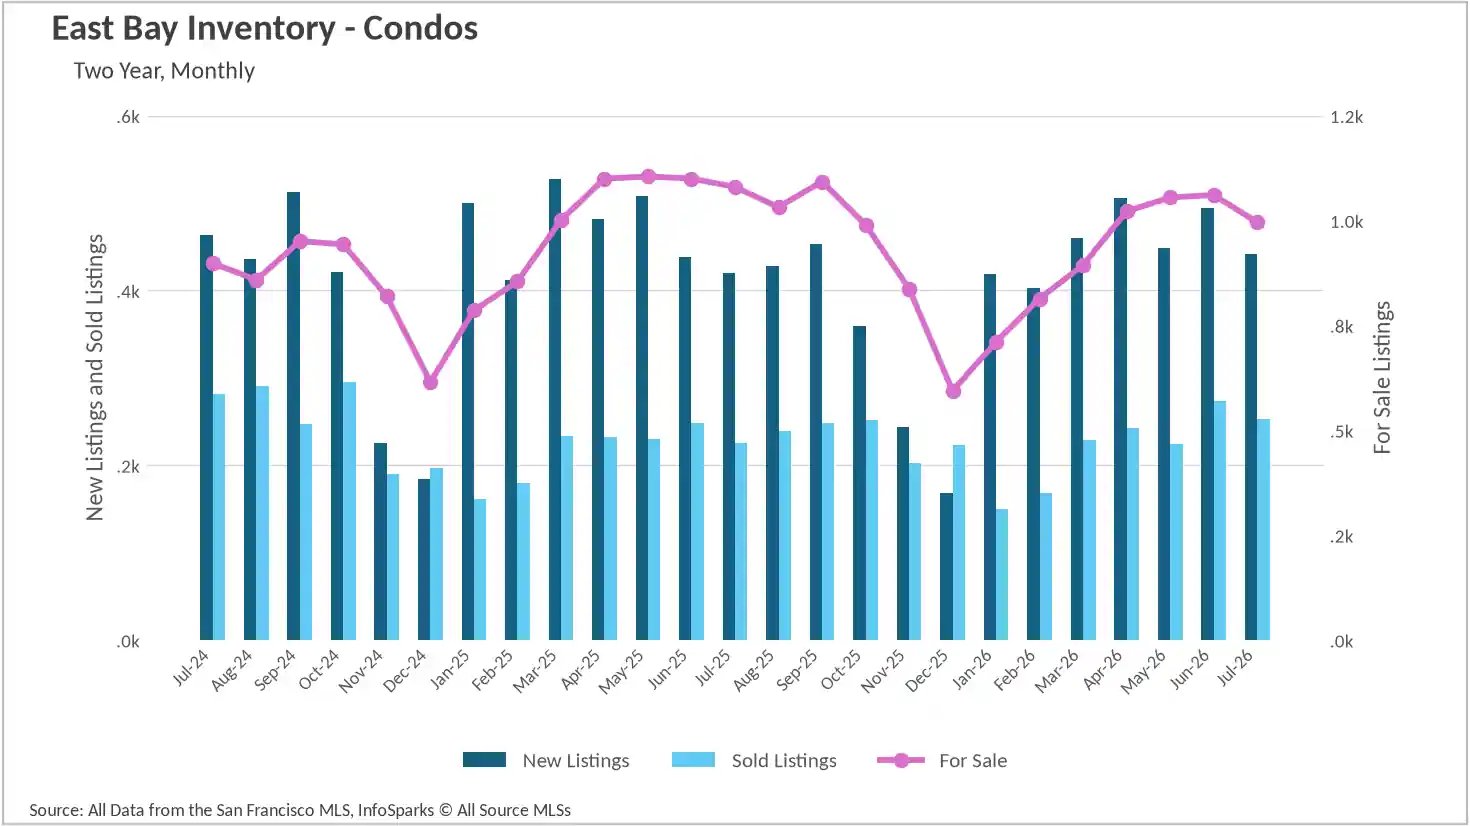
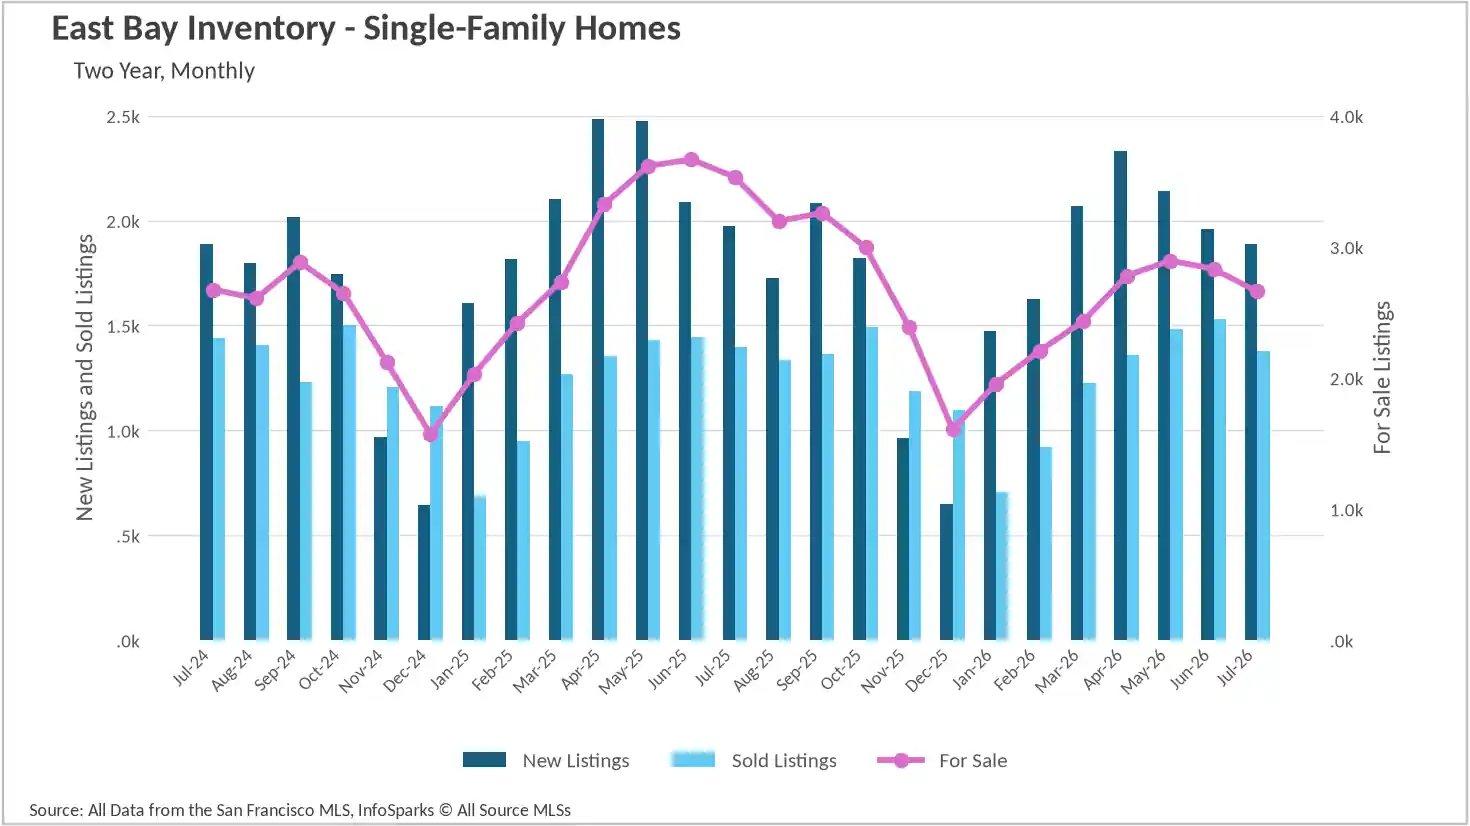
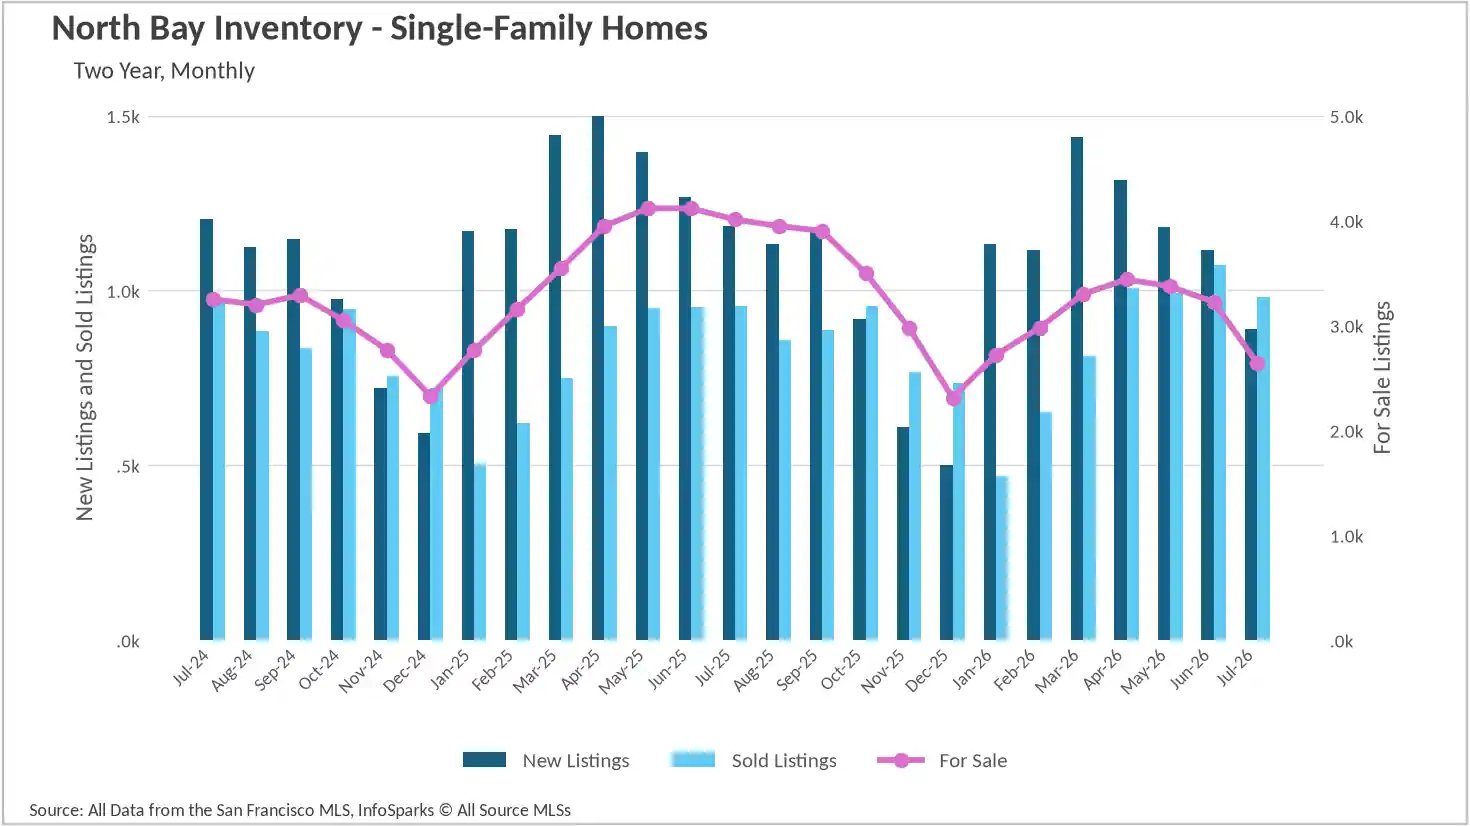
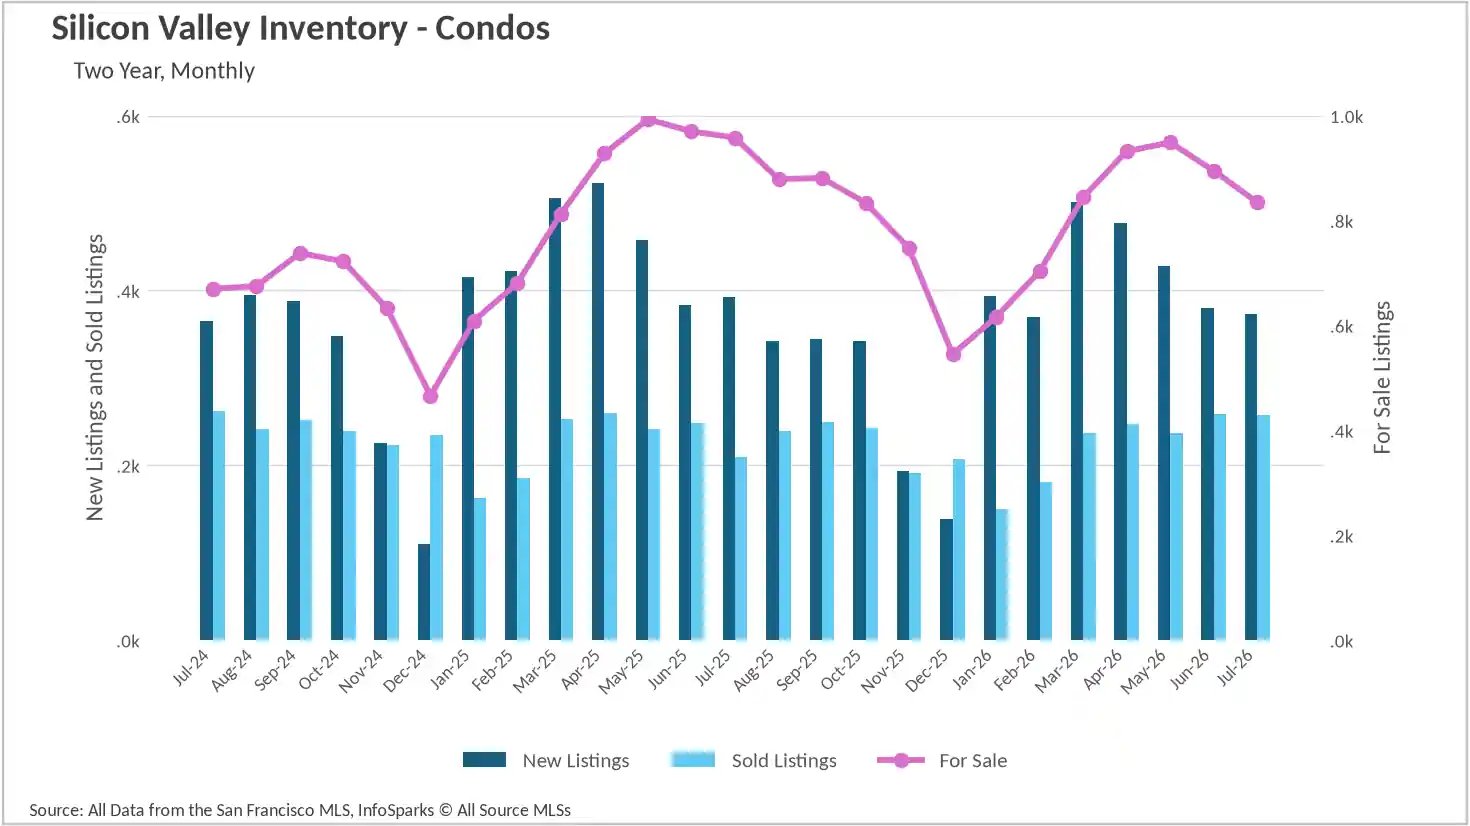
Every corner of the Bay Area is short of homes. Silicon Valley counted 1,849 single-family homes for sale in July, down 22.18% year over year and 5.28% from June. The East Bay closed the month at 2,659, off 24.70%. The North Bay saw the sharpest contraction, falling to 2,645 units, a 34.04% annual decline and 17.96% below June, the leanest July reading in that region's two-year series. San Francisco had just 154 single-family homes on the market, down 42.11% from 266 a year ago.
What makes this different from a demand story is that sales have held up. Roughly 3,750 single-family homes closed across the four subregions in July, and each region posted volume that was flat to slightly higher than last July. The shortfall is coming from sellers. New single-family listings fell 4.59% in Silicon Valley, 4.26% in the East Bay, and 24.98% in the North Bay, with only San Francisco bucking the trend at a 13.5% increase.
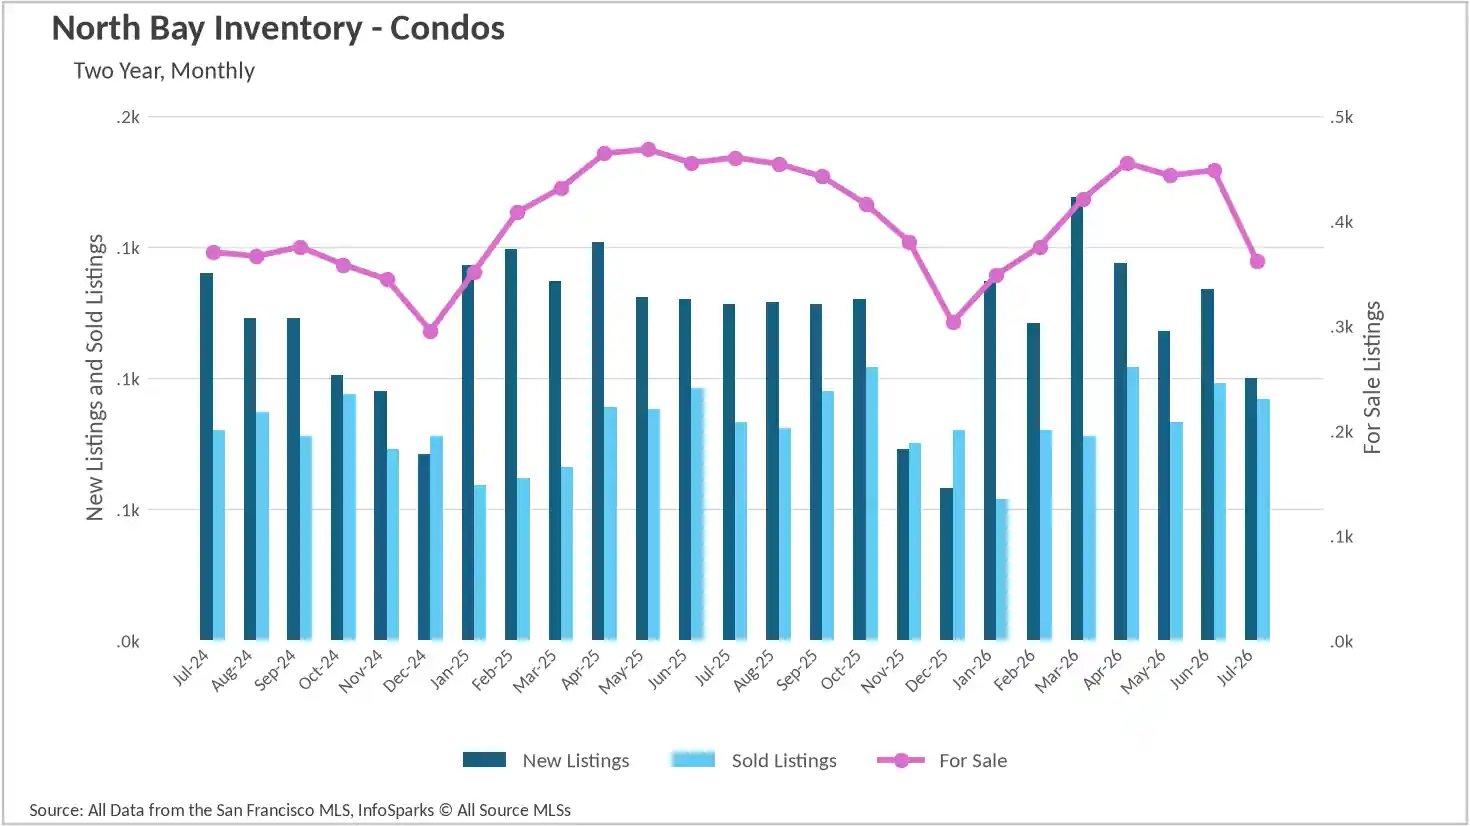
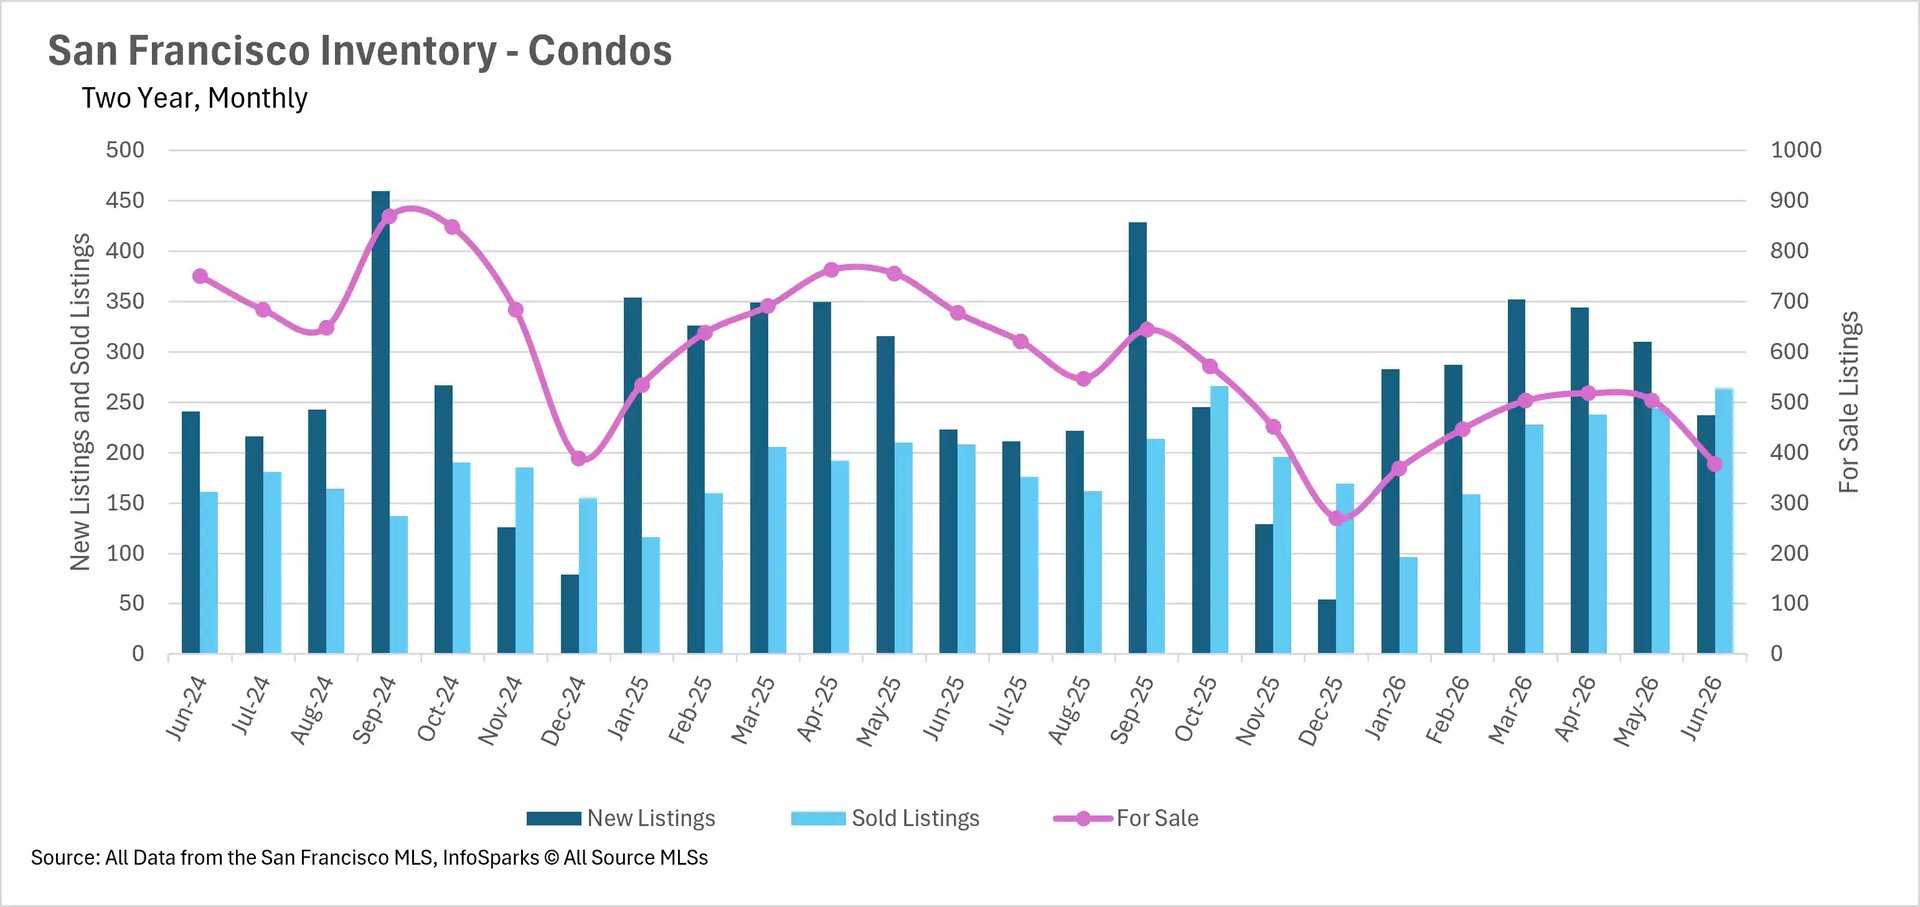
Condos are following the same trajectory for a different reason. Inventory fell 12.84% in Silicon Valley, 7.78% in the East Bay, 21.52% in the North Bay, and 43.16% in San Francisco, but closed condo sales rose in all four regions, including a 39.2% jump in San Francisco and 23.44% in Silicon Valley. Condo supply is thinning largely because buyers are finally absorbing it.
Two weeks in the core, six weeks in the outer ring
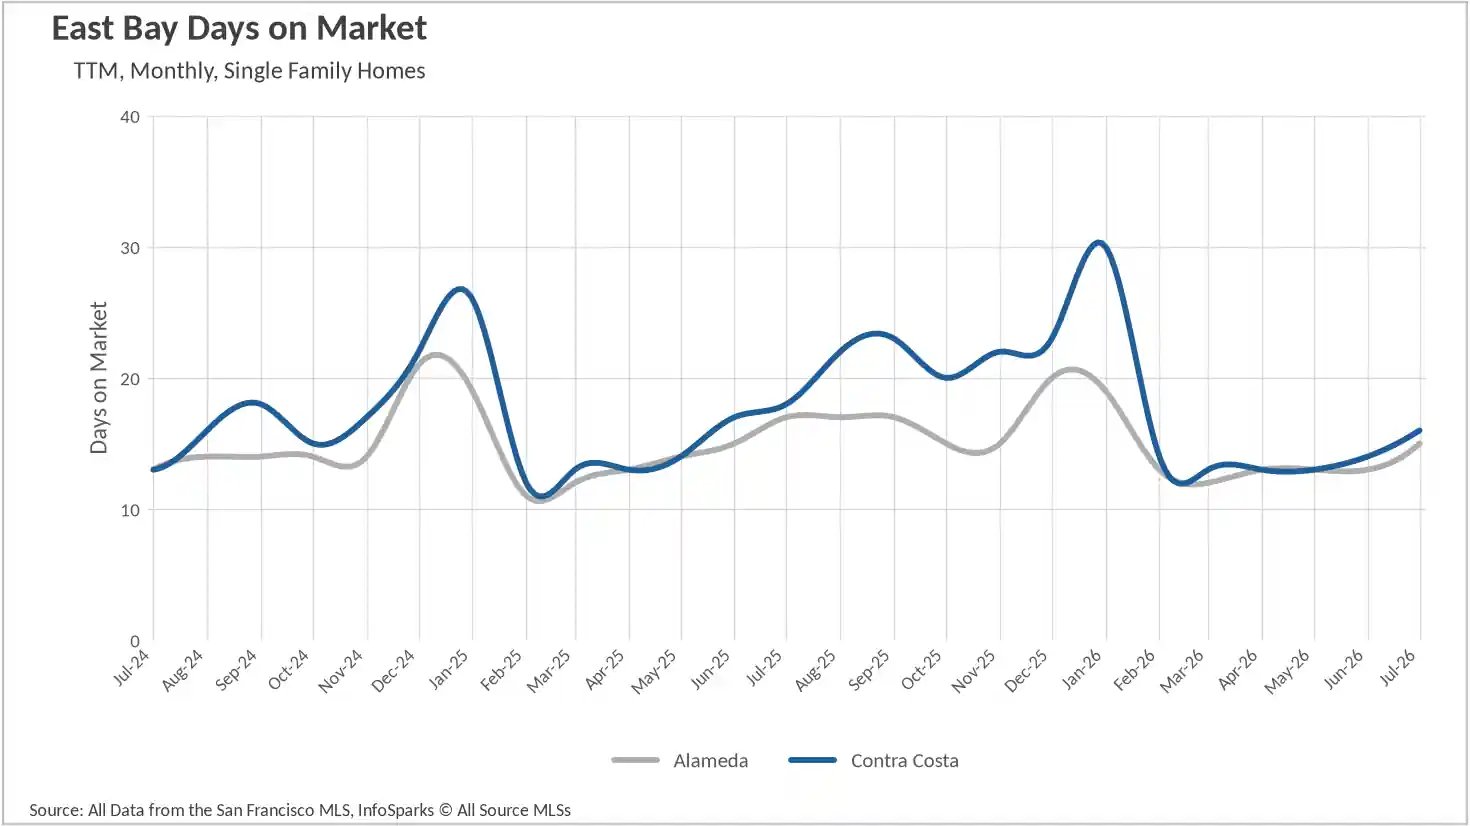
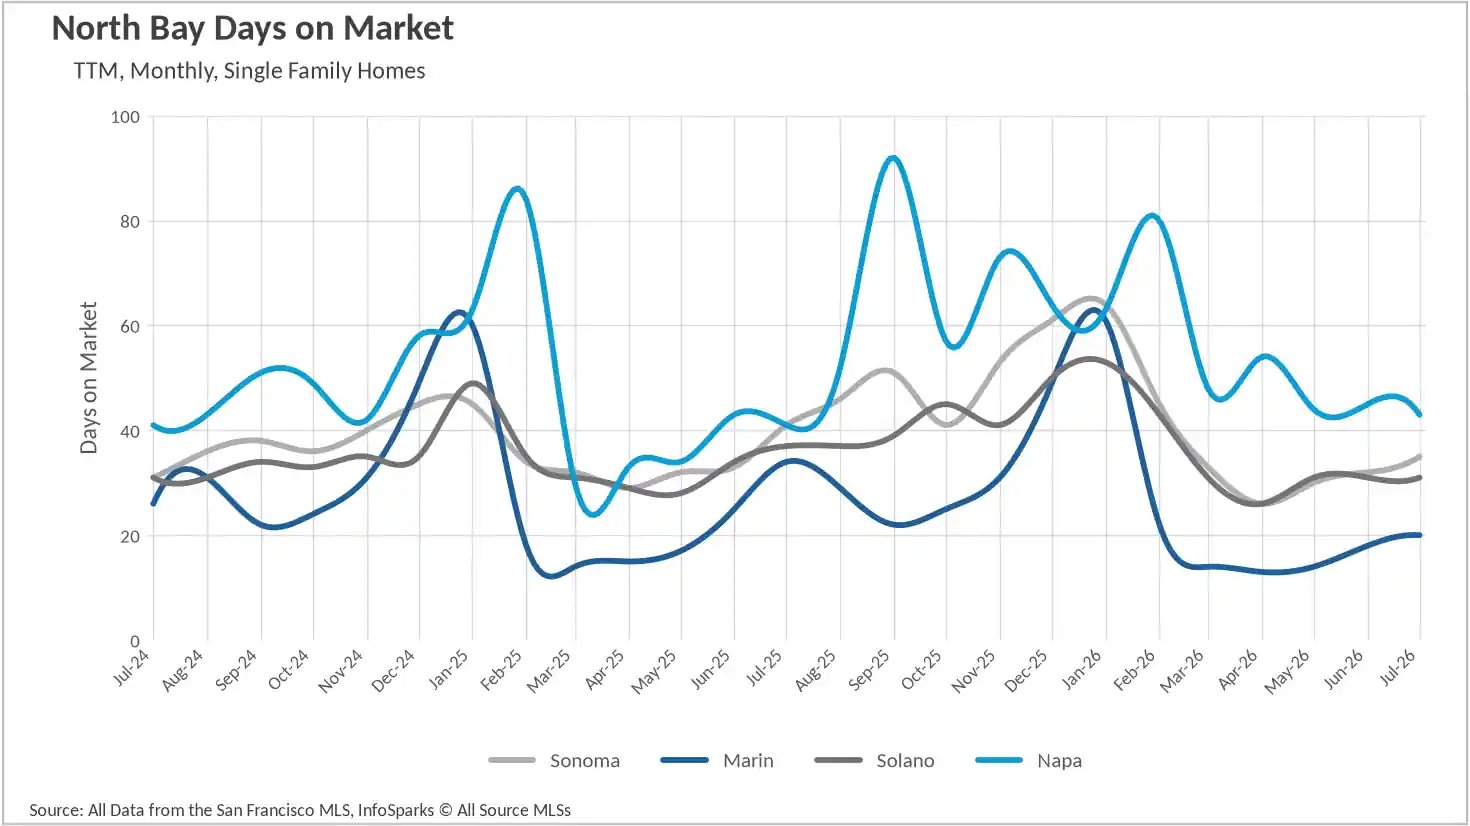
Marketing times form a clean gradient outward from the region's job centers. San Francisco single-family homes averaged 13 days on market, San Mateo and Santa Clara Counties both 14 days, Alameda 15, and Contra Costa 16. Marin County improved dramatically to 20 days, 41.18% faster than the 34 days it required last July. From there the clock stretches: Santa Cruz County at 25 days, Solano at 31, Sonoma at 35, and Napa the slowest in the region at 43 days.
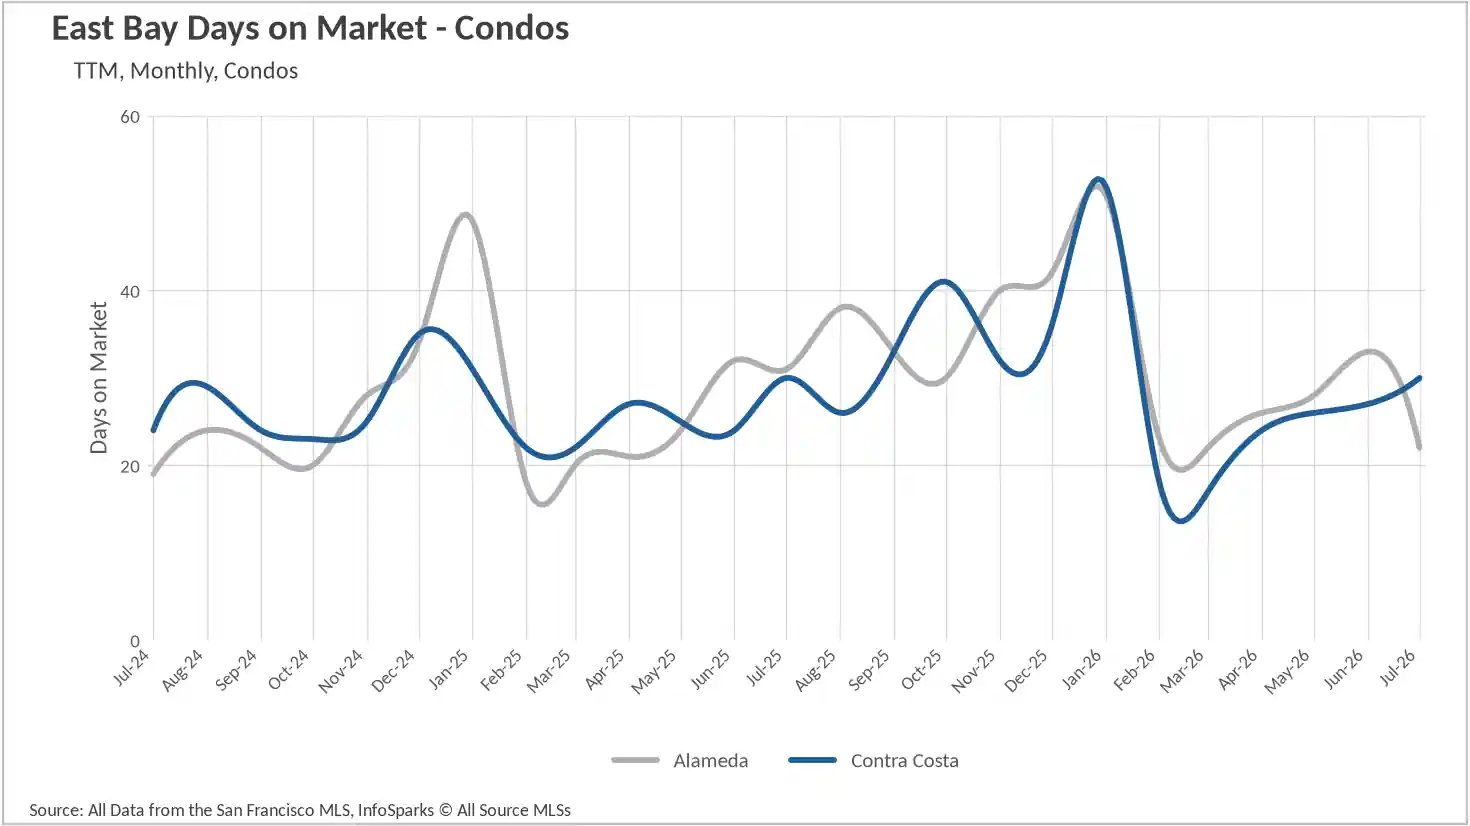
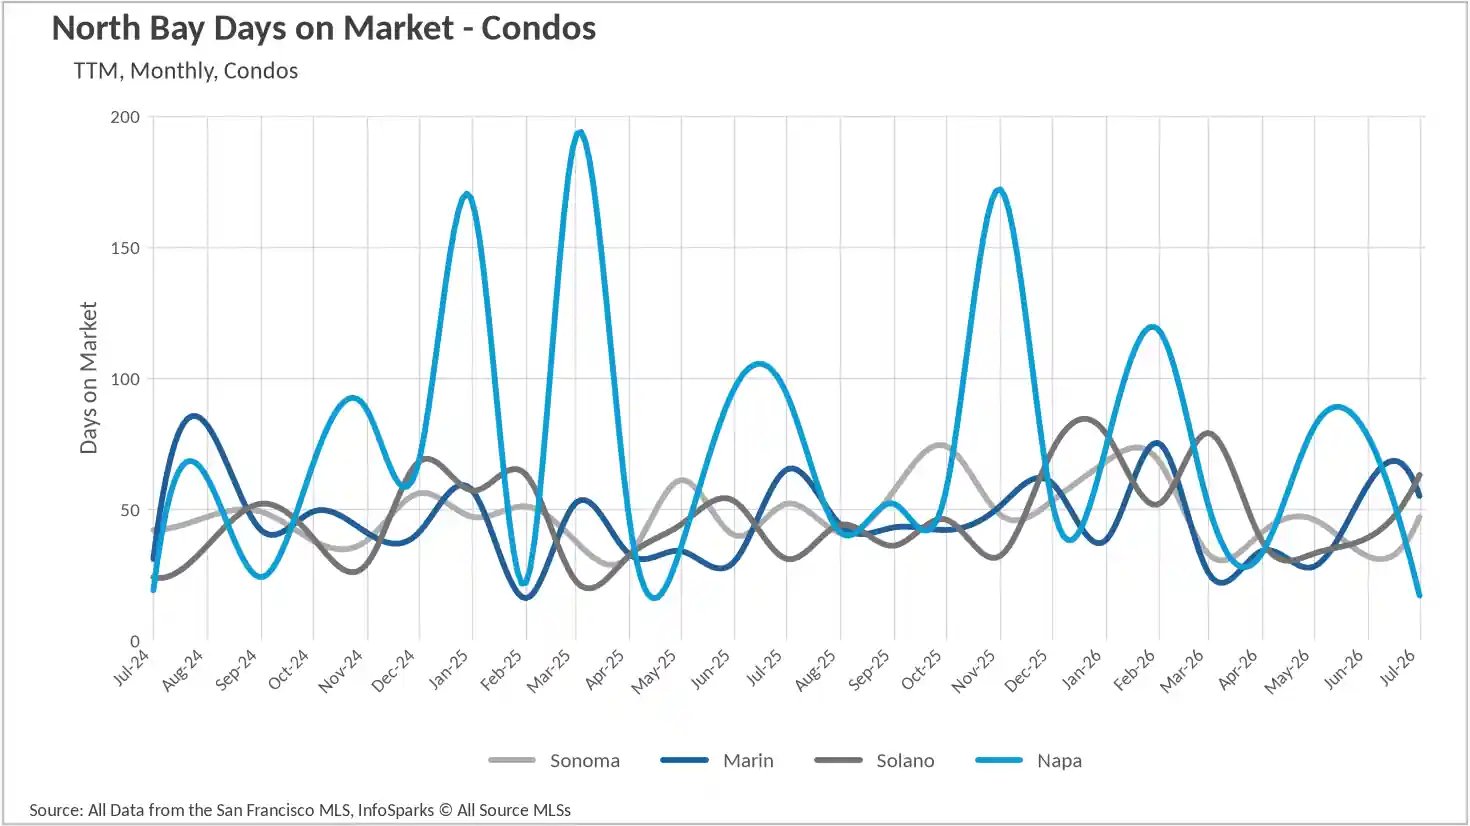
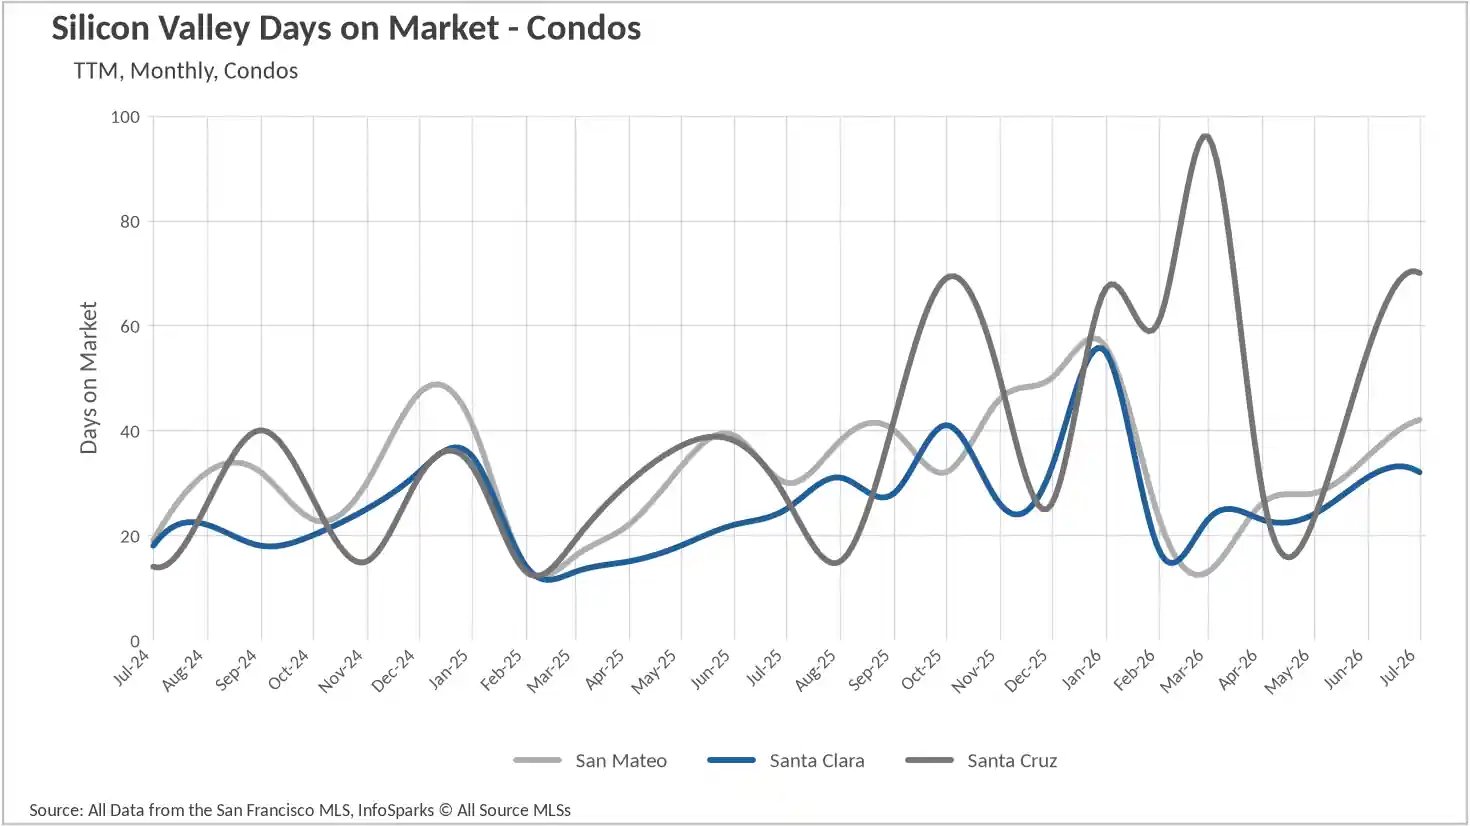
The condo side is where the regional divergence is widest. San Francisco condos averaged 20 days, down 53.49% from 43 days last July, and Alameda County condos improved 29.03% to 22 days, the fastest pace in more than two years there. At the other end, San Mateo County condos slowed to 42 days, Marin to 55, Solano to 63, and Santa Cruz County to 70 days, nearly triple last July's 27. Napa County's 17-day condo figure is the outlier of outliers and remains on very few closings. The practical lesson for sellers is that attached-housing timelines vary far more by location than single-family timelines do, and pricing strategy should reflect the local pace rather than the regional headline.
Sellers hold the cards across almost the entire region
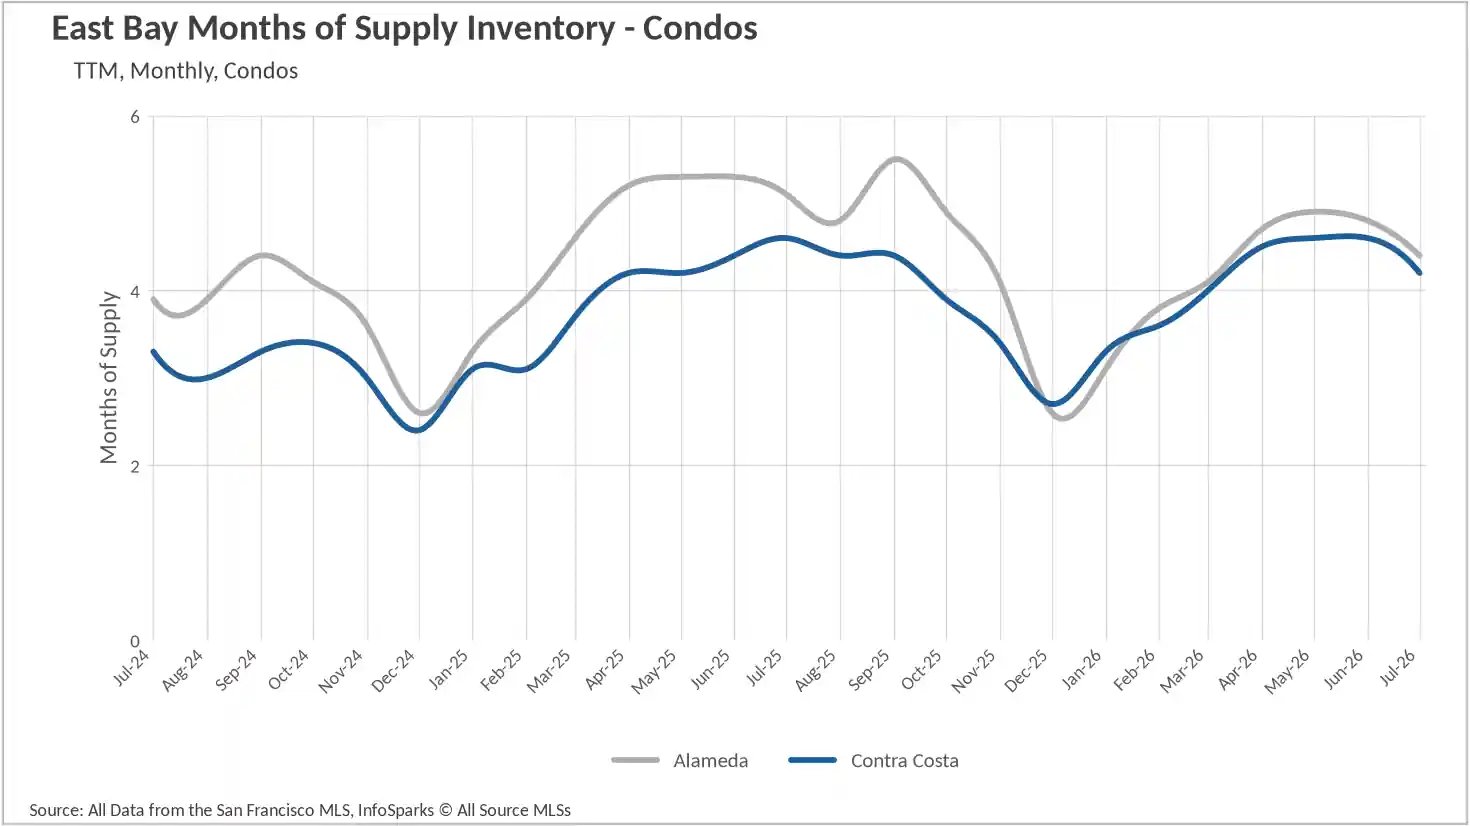
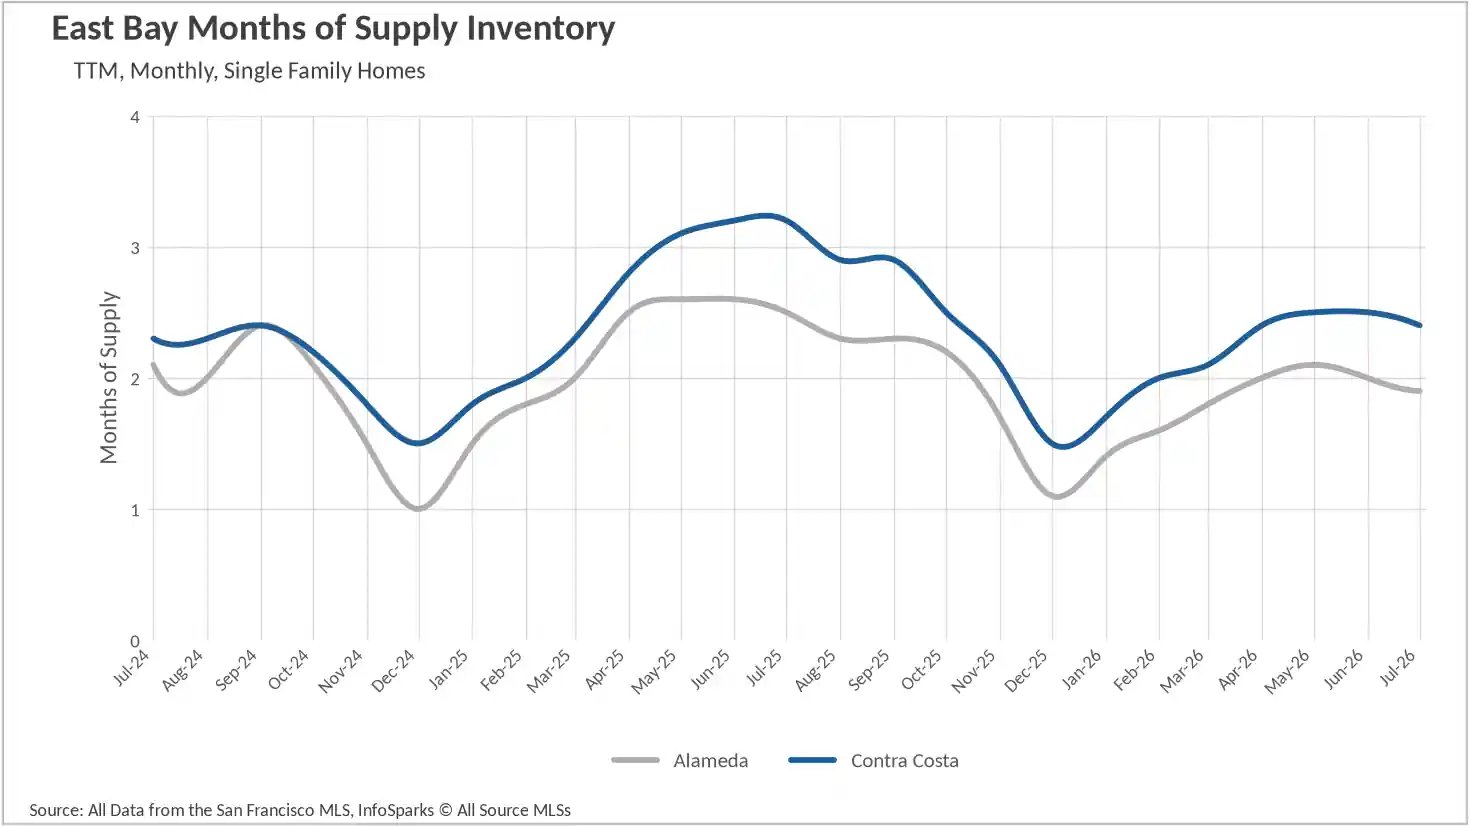
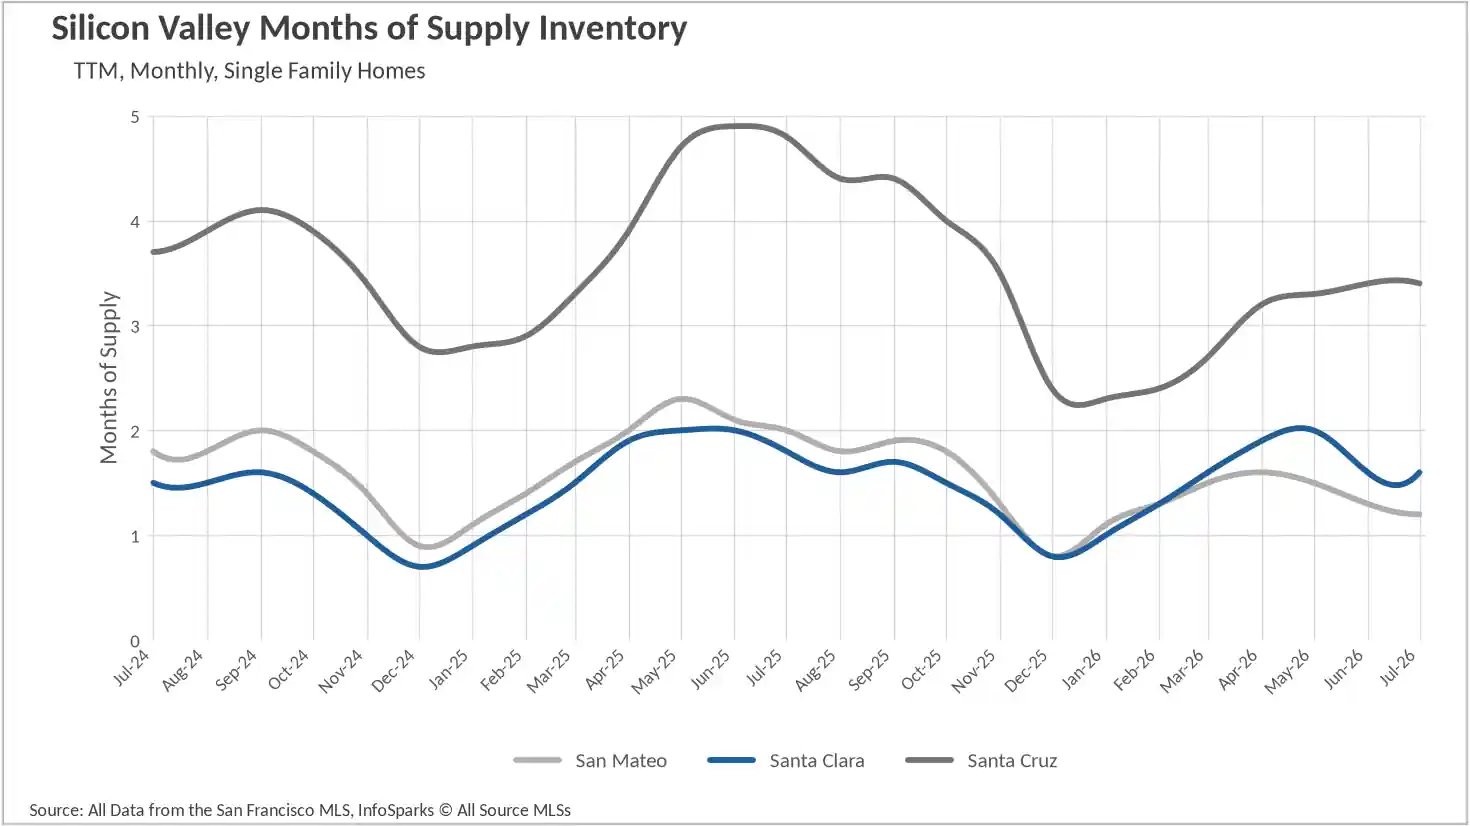
When determining whether a market is a buyers’ market or a sellers’ market, we look at the Months of Supply Inventory (MSI) metric. The state of California has historically averaged around three months of MSI, so any area with at or around three months of MSI is considered a balanced market. Any market that has less than three months of MSI is considered a seller's market, whereas markets with more than three months of MSI are considered buyers' markets.
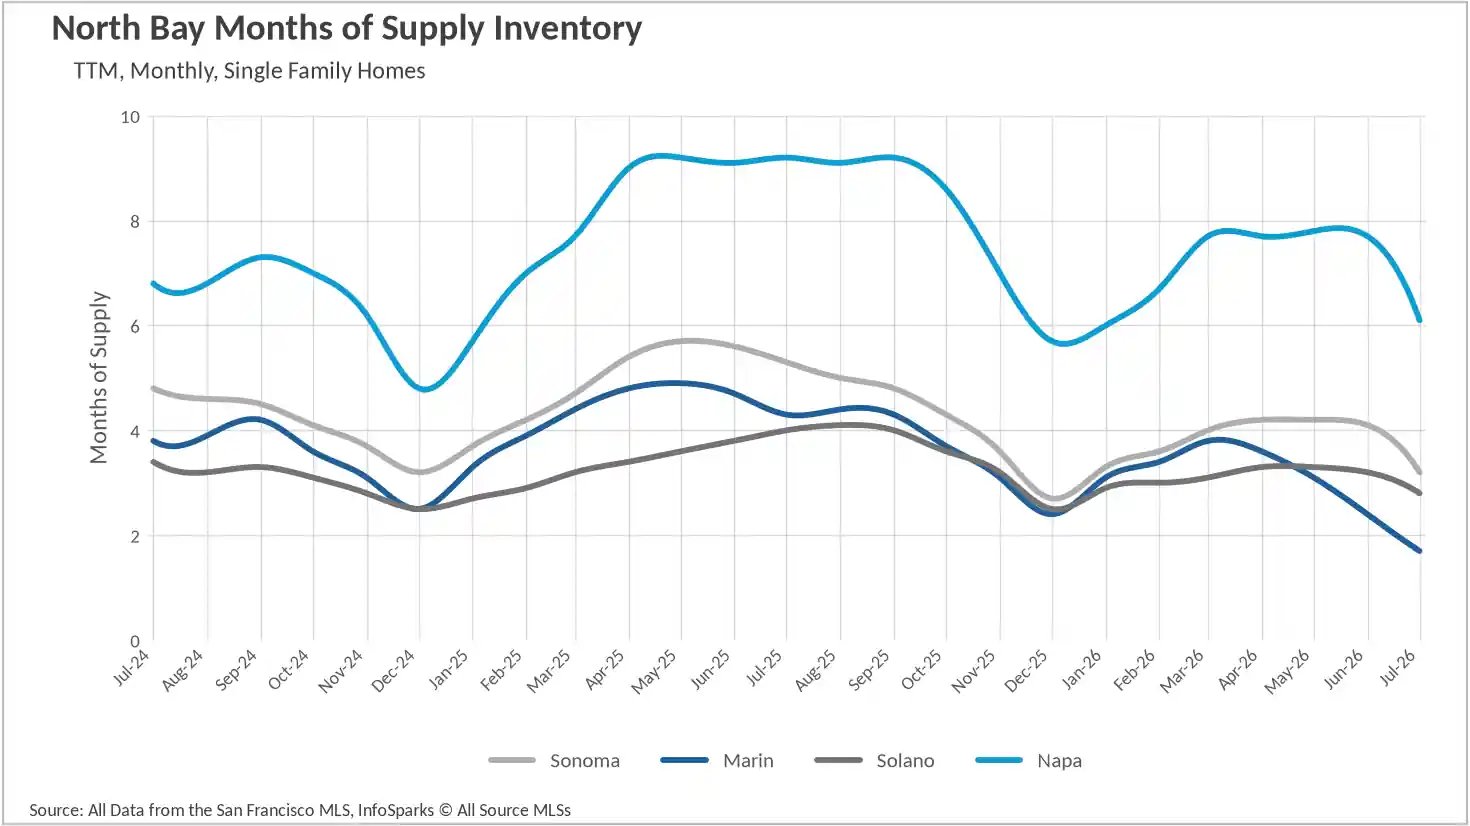
Measured that way, the Bay Area's single-family market is a seller's market almost without exception. San Francisco leads at 0.8 months of supply, down 42.86% year over year, followed by San Mateo at 1.2, Santa Clara at 1.6, Marin at 1.7, Alameda at 1.9, Contra Costa at 2.4, and Solano at 2.8 months. Sonoma County at 3.2 months and Santa Cruz County at 3.4 months sit right at the balanced threshold, both having compressed sharply from last July. Napa County, at 6.1 months, is the region's only true single-family buyers' market, and even that is down 33.70% from 9.2 months a year ago.
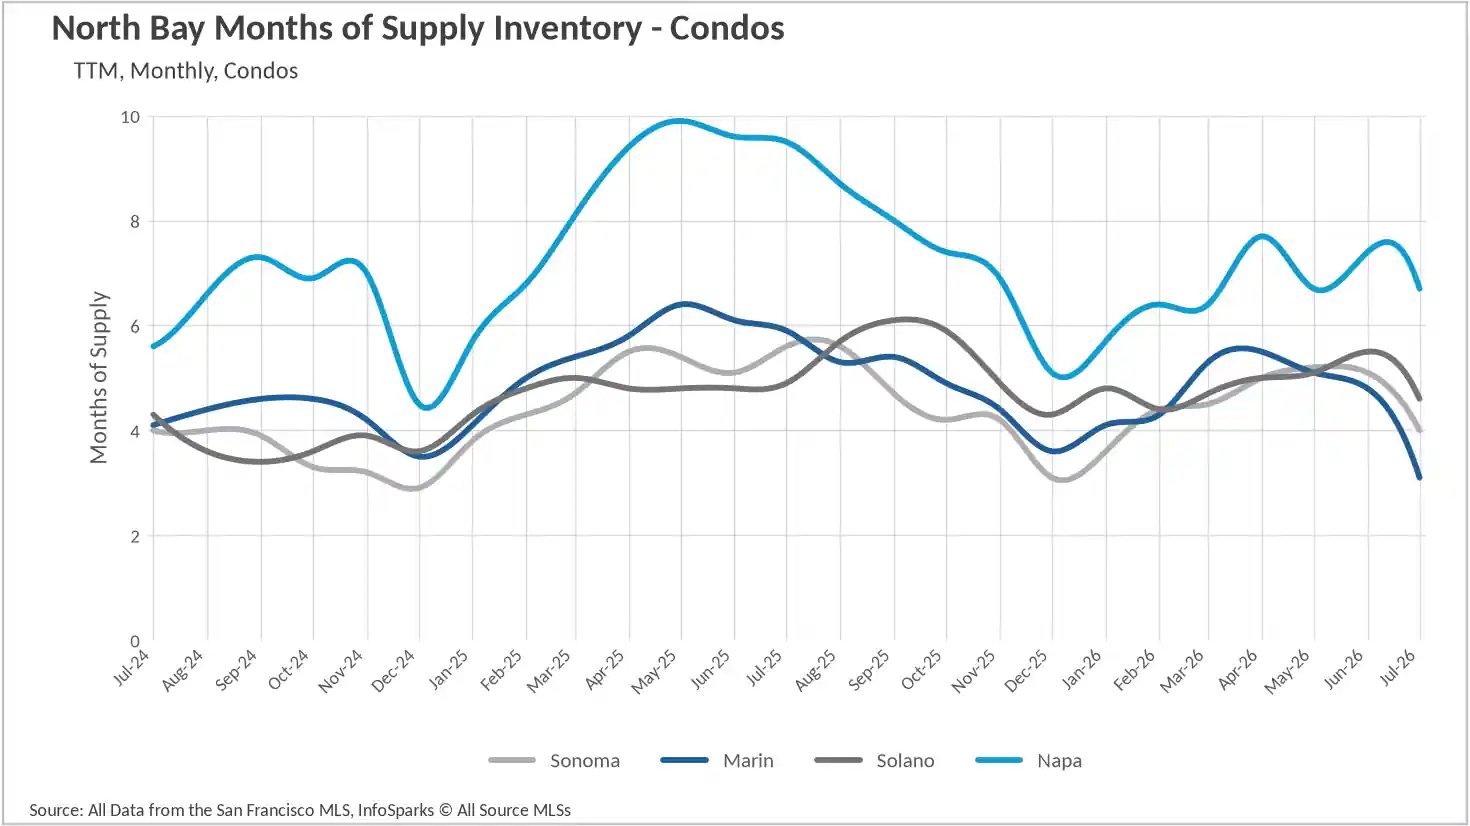
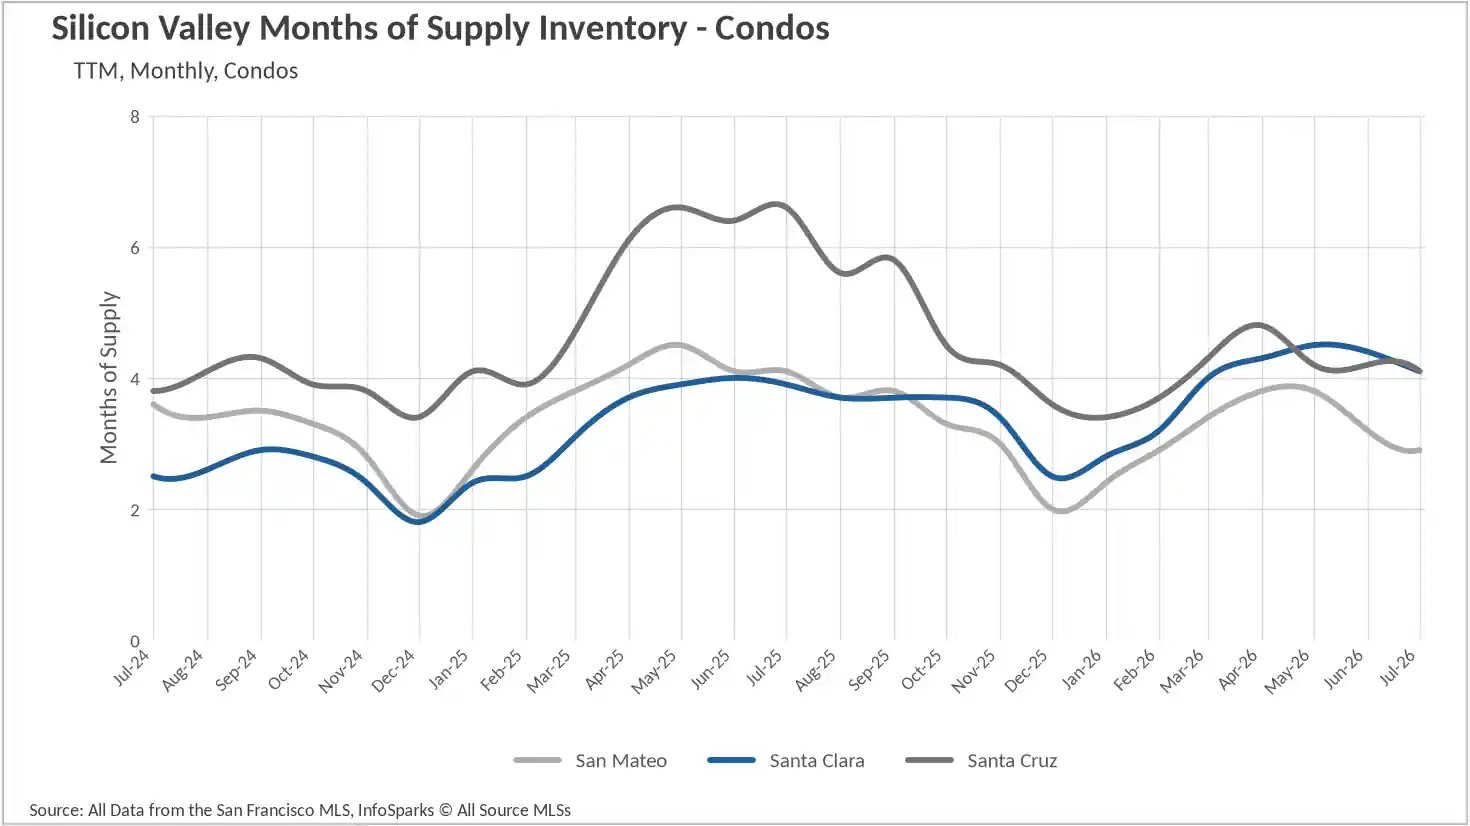
The condo segment still offers buyers more room, but the gap is narrowing quickly. San Francisco condos have moved all the way from 3.6 months of supply last July to 1.7 months now, and San Mateo County condos have tightened to 2.9 months. Marin County condos, at 3.1 months, are effectively balanced after sitting near 5.9 months a year ago. Buyers looking for genuine negotiating leverage will find it in Alameda County at 4.4 months, Solano at 4.6, Napa at 6.7, and in the 4.0 to 4.2 month range across Sonoma, Santa Clara, Santa Cruz, and Contra Costa Counties. Heading into the fall, the message for the region is consistent: single-family sellers are negotiating from strength, and condo buyers should act on the leverage they still have, because it has been eroding all summer.
Local Lowdown Data
```