The Local Lowdown
Quick Take:
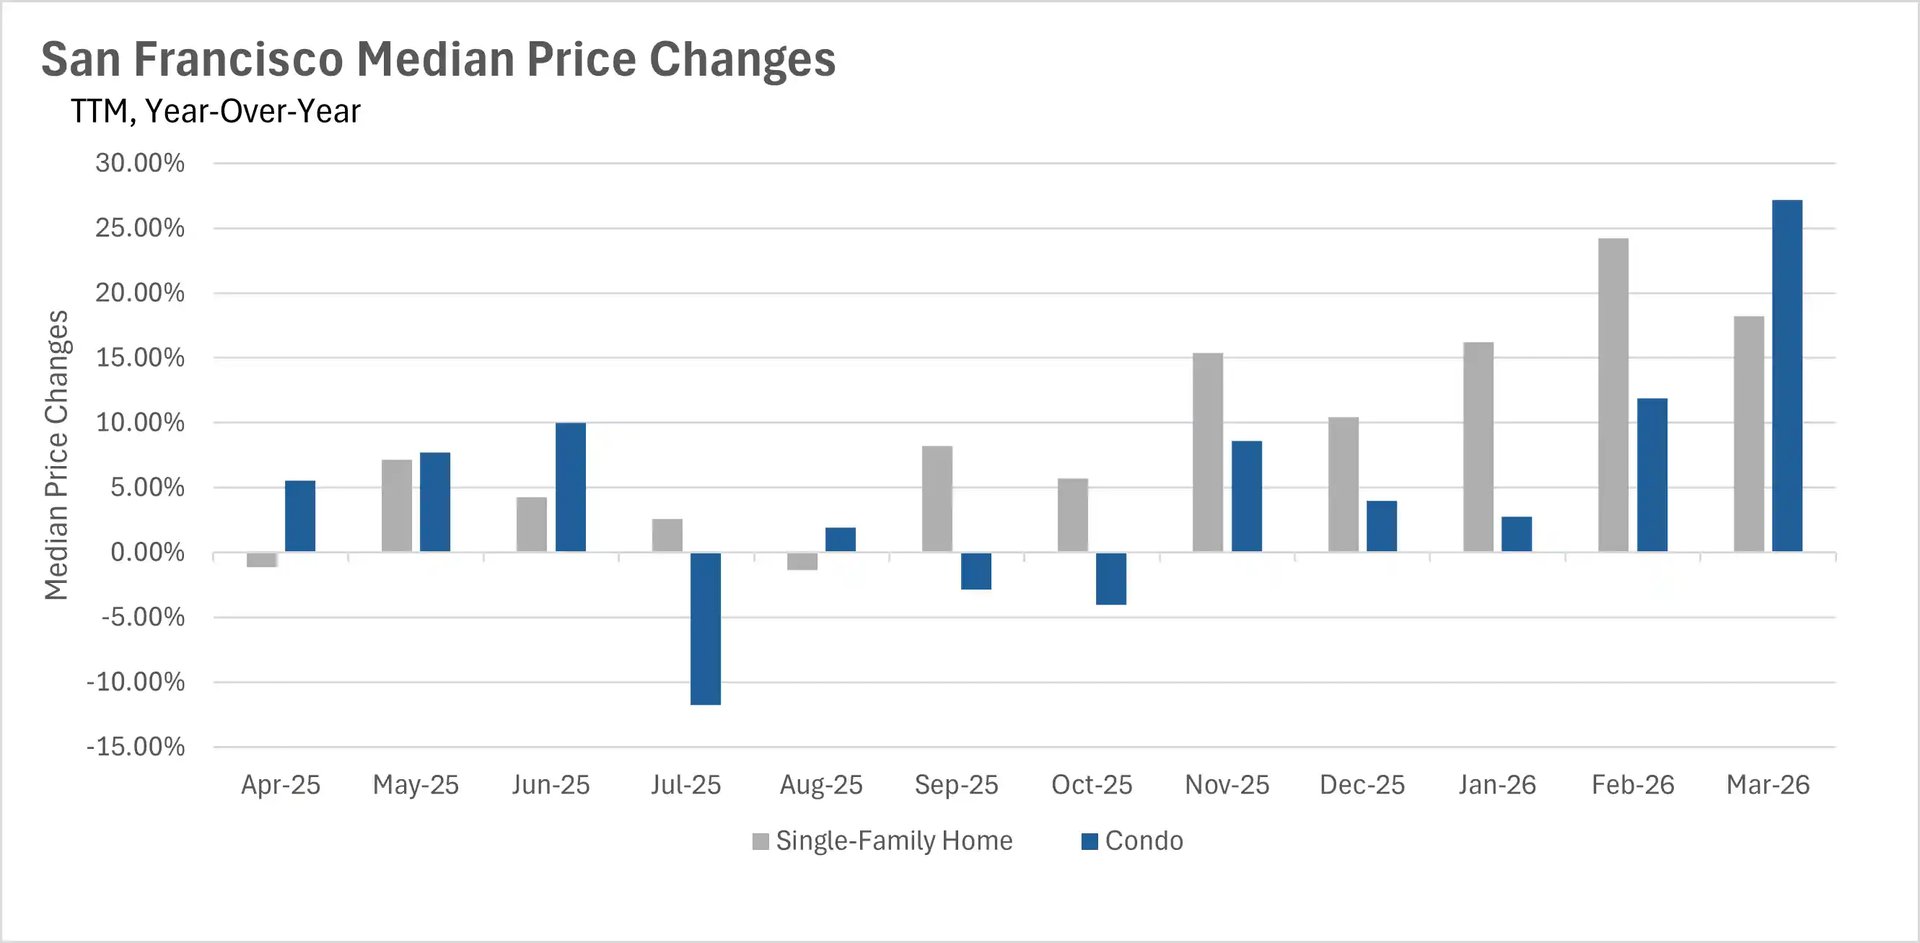
- San Francisco led the Bay Area with explosive price growth in March, as single-family homes climbed more than 18% and condos surged more than 27% on a year-over-year basis.
- Inventory levels remain well below last year across every corner of the Bay Area, with year-over-year declines ranging from roughly 10% in Silicon Valley to more than 41% in the North Bay.
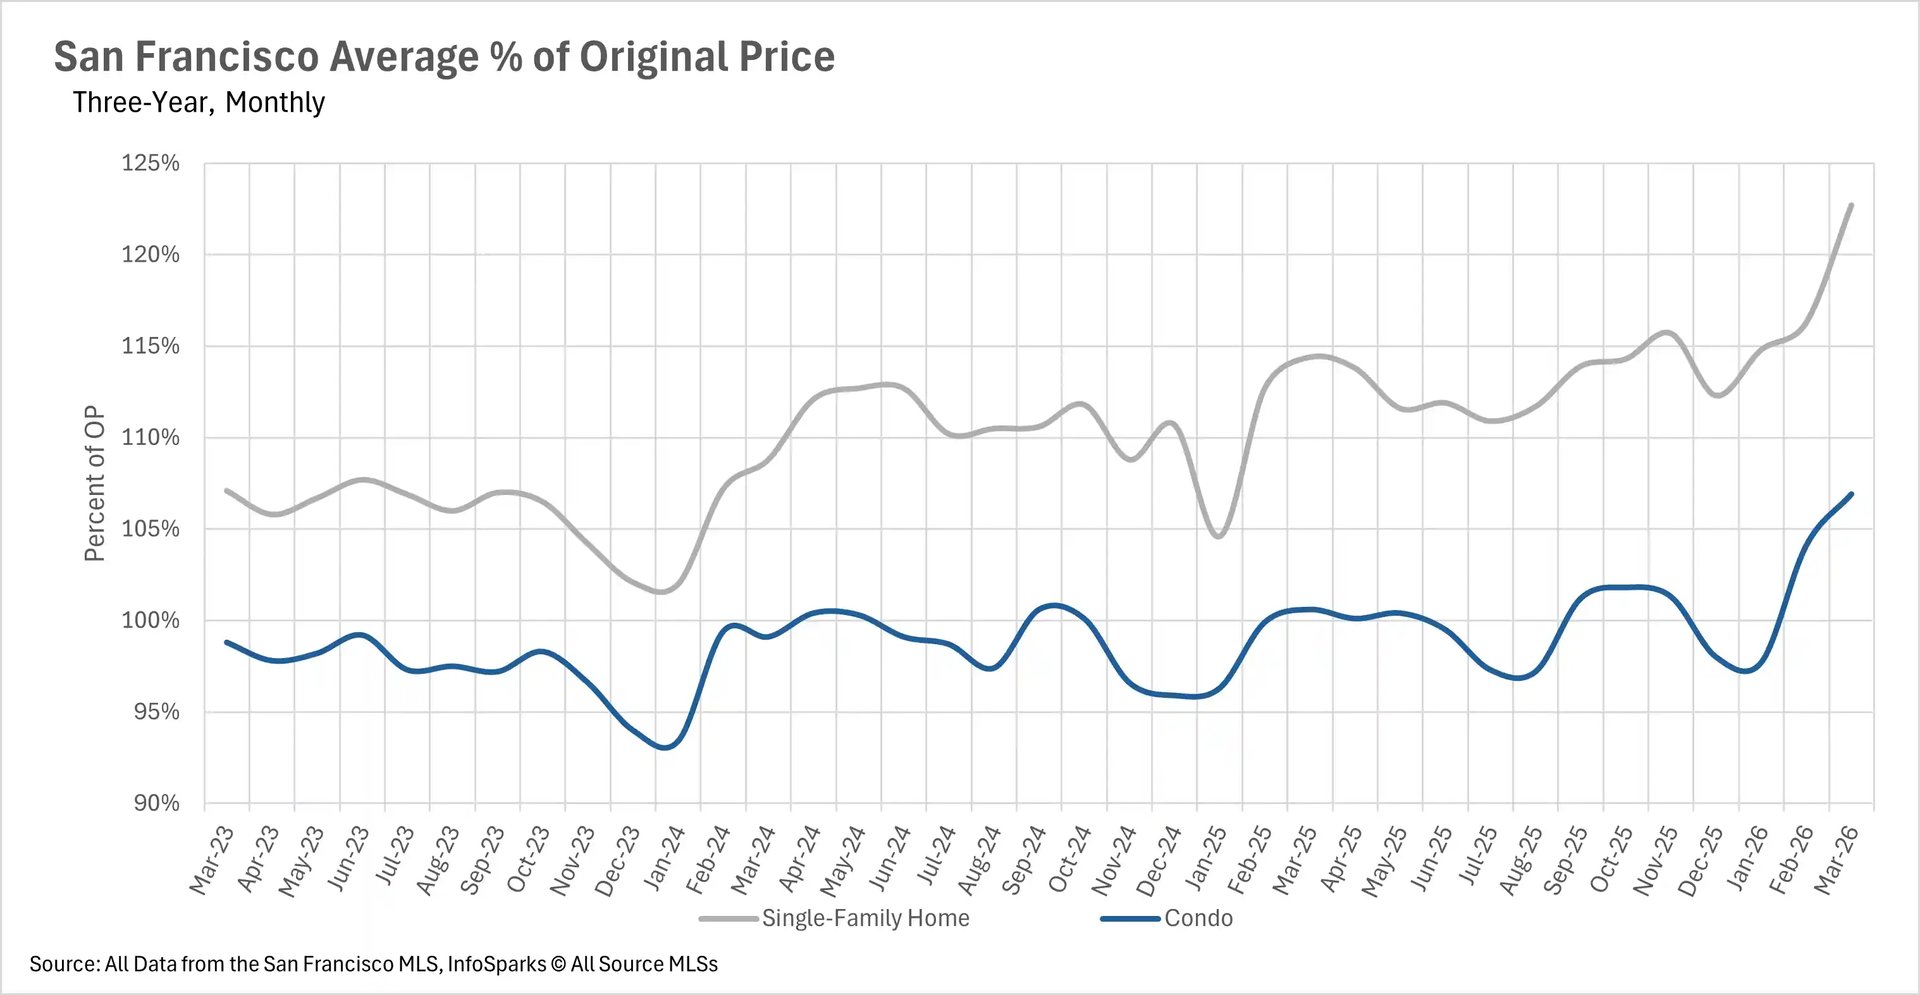
- Single-family homes are selling at a blistering pace, with the average listing in Santa Clara County moving in just 8 days and San Francisco homes selling for nearly 23% over the original asking price.
- The Bay Area's single-family home market is overwhelmingly a seller's market, while the condo market is offering more balance, with several East Bay and North Bay counties sitting firmly in buyer's market territory.
Note: You can find the charts/graphs for the Local Lowdown at the end of this section.
San Francisco steals the spotlight as prices diverge across the region
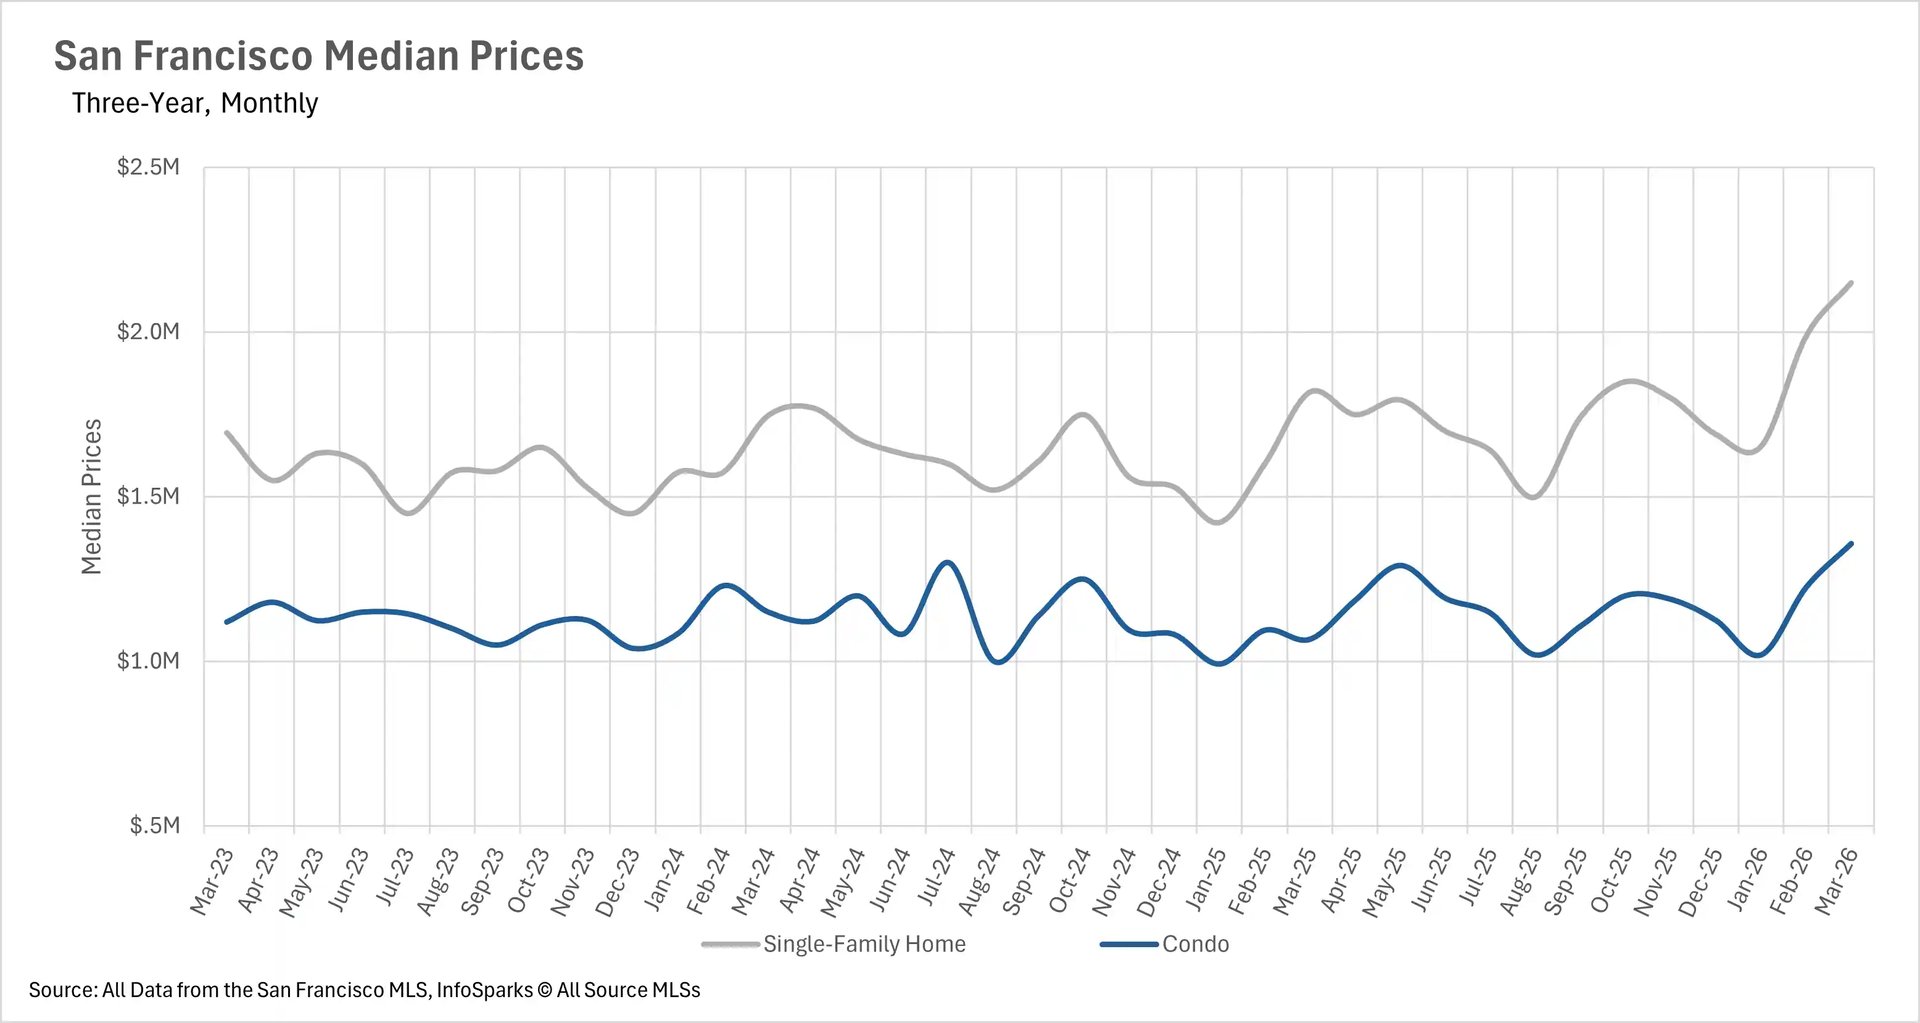
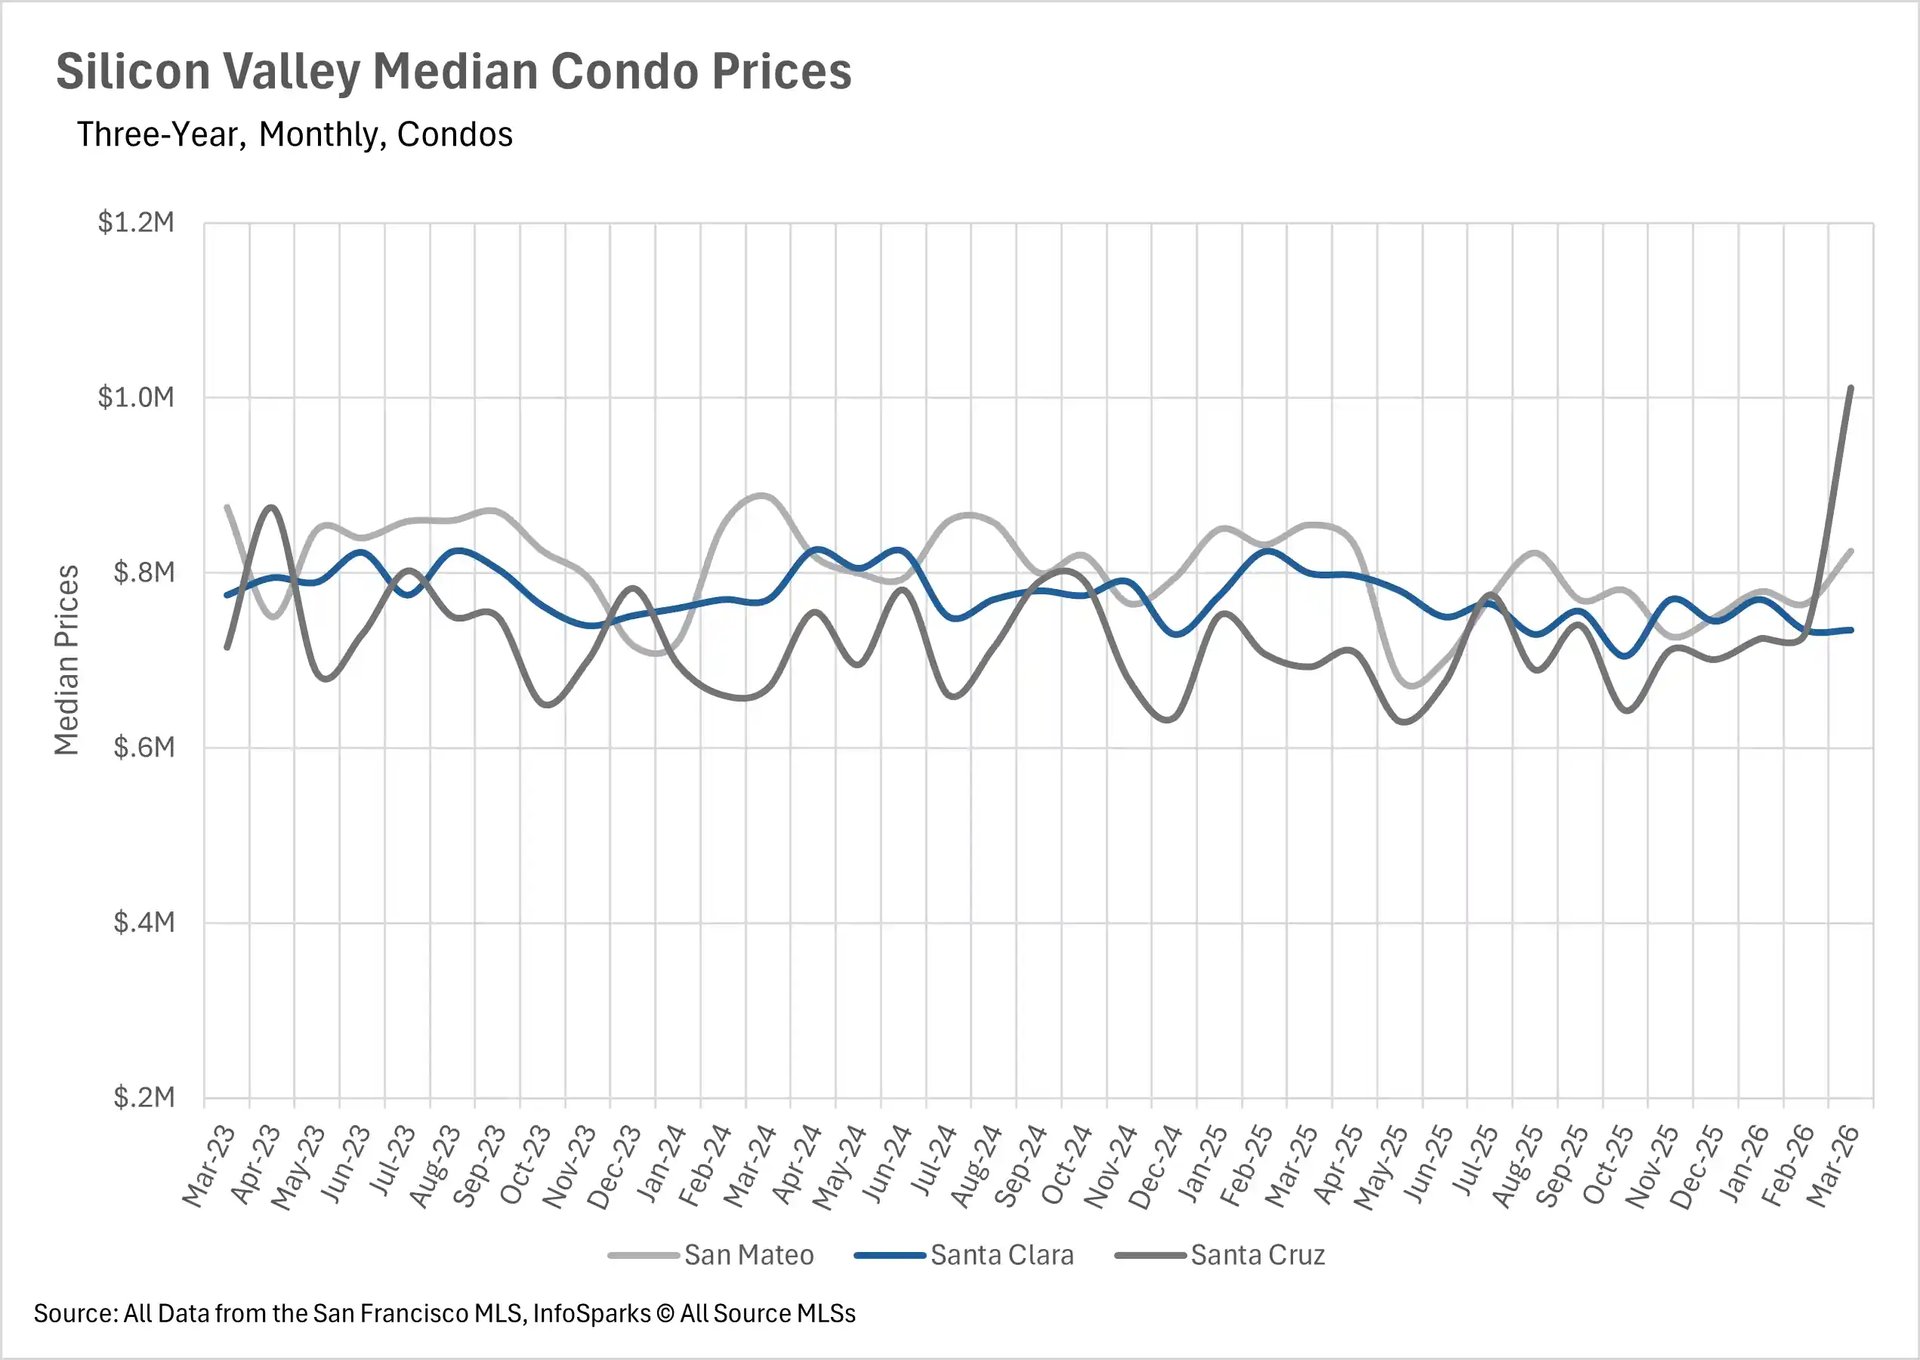
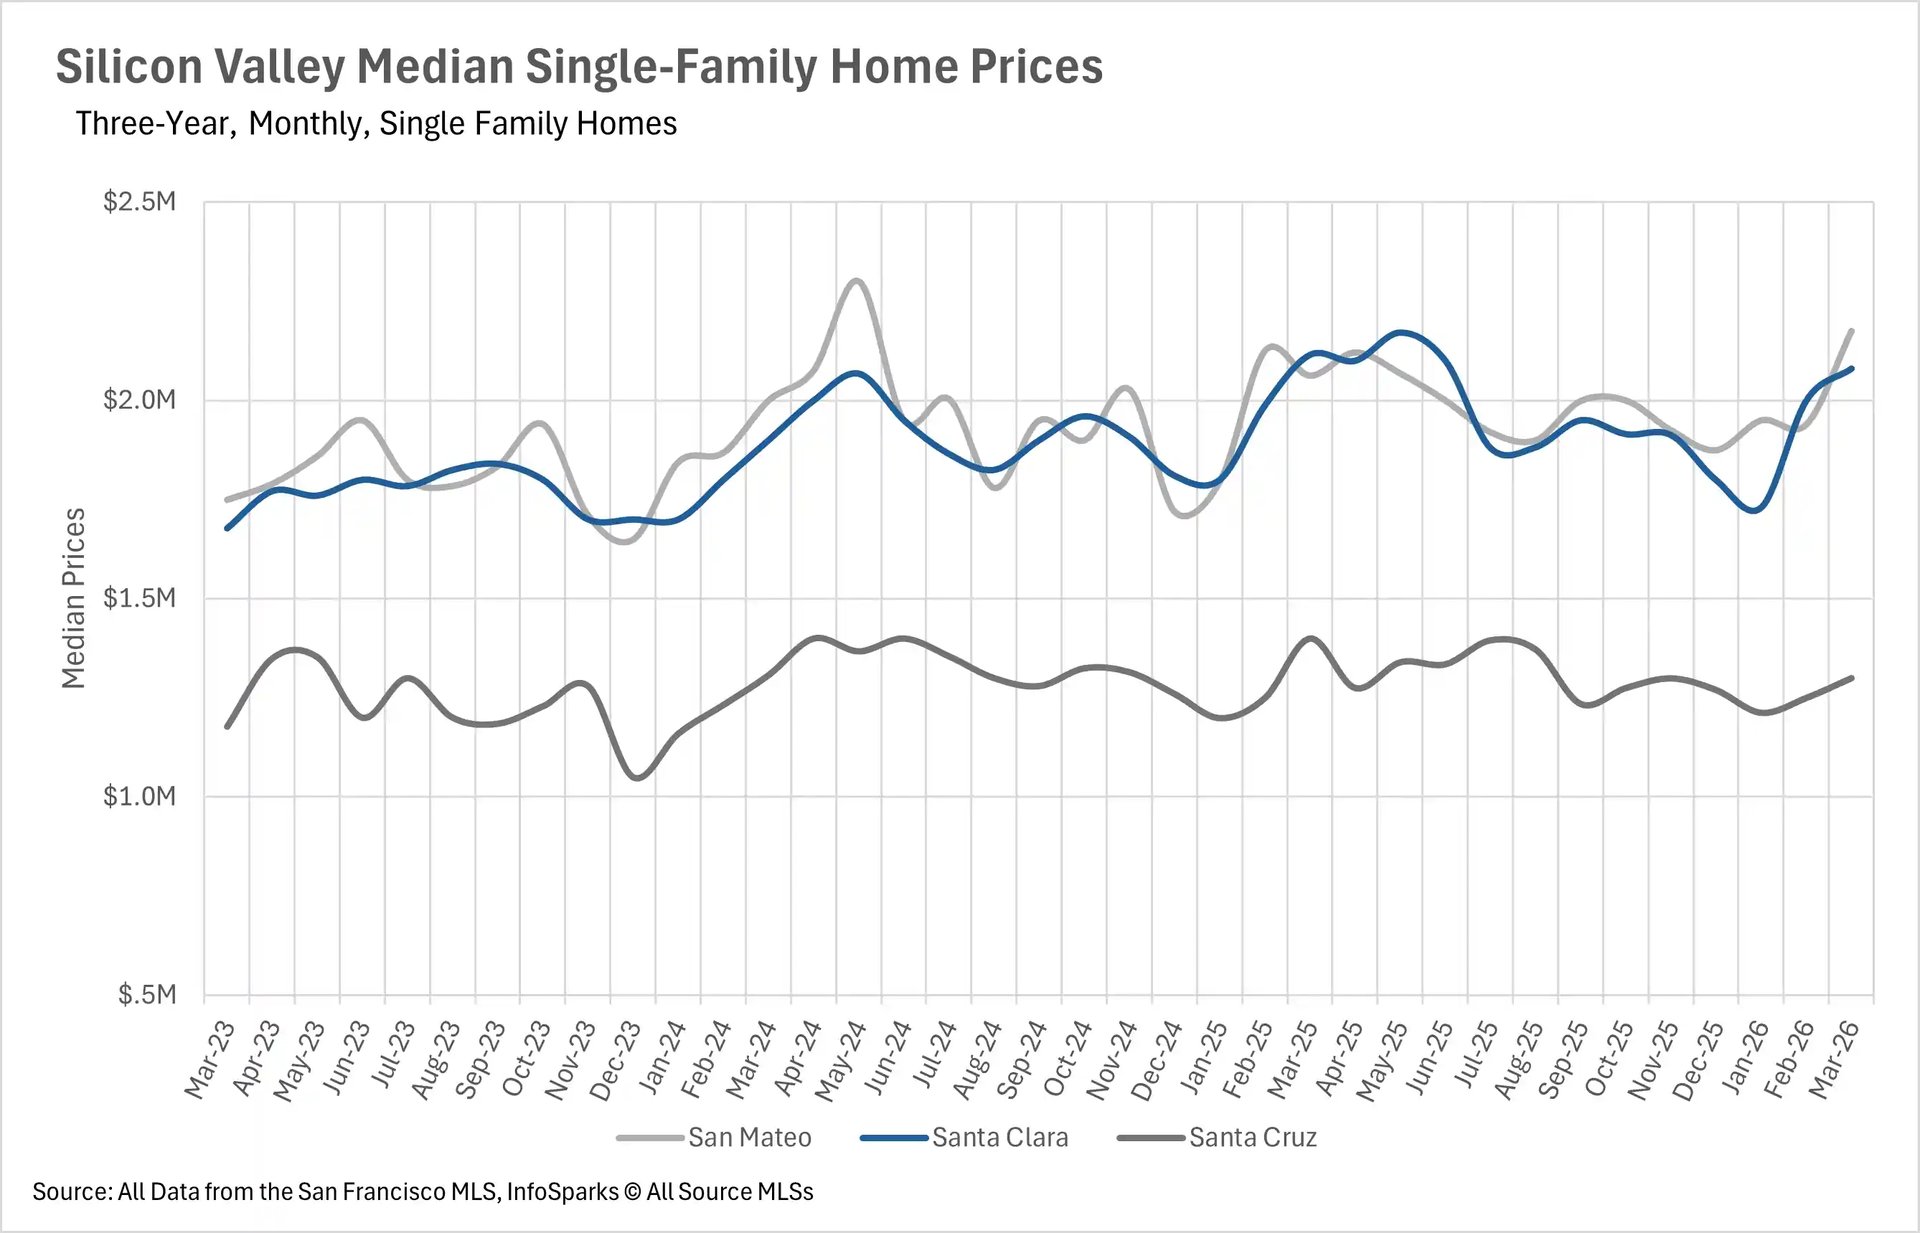
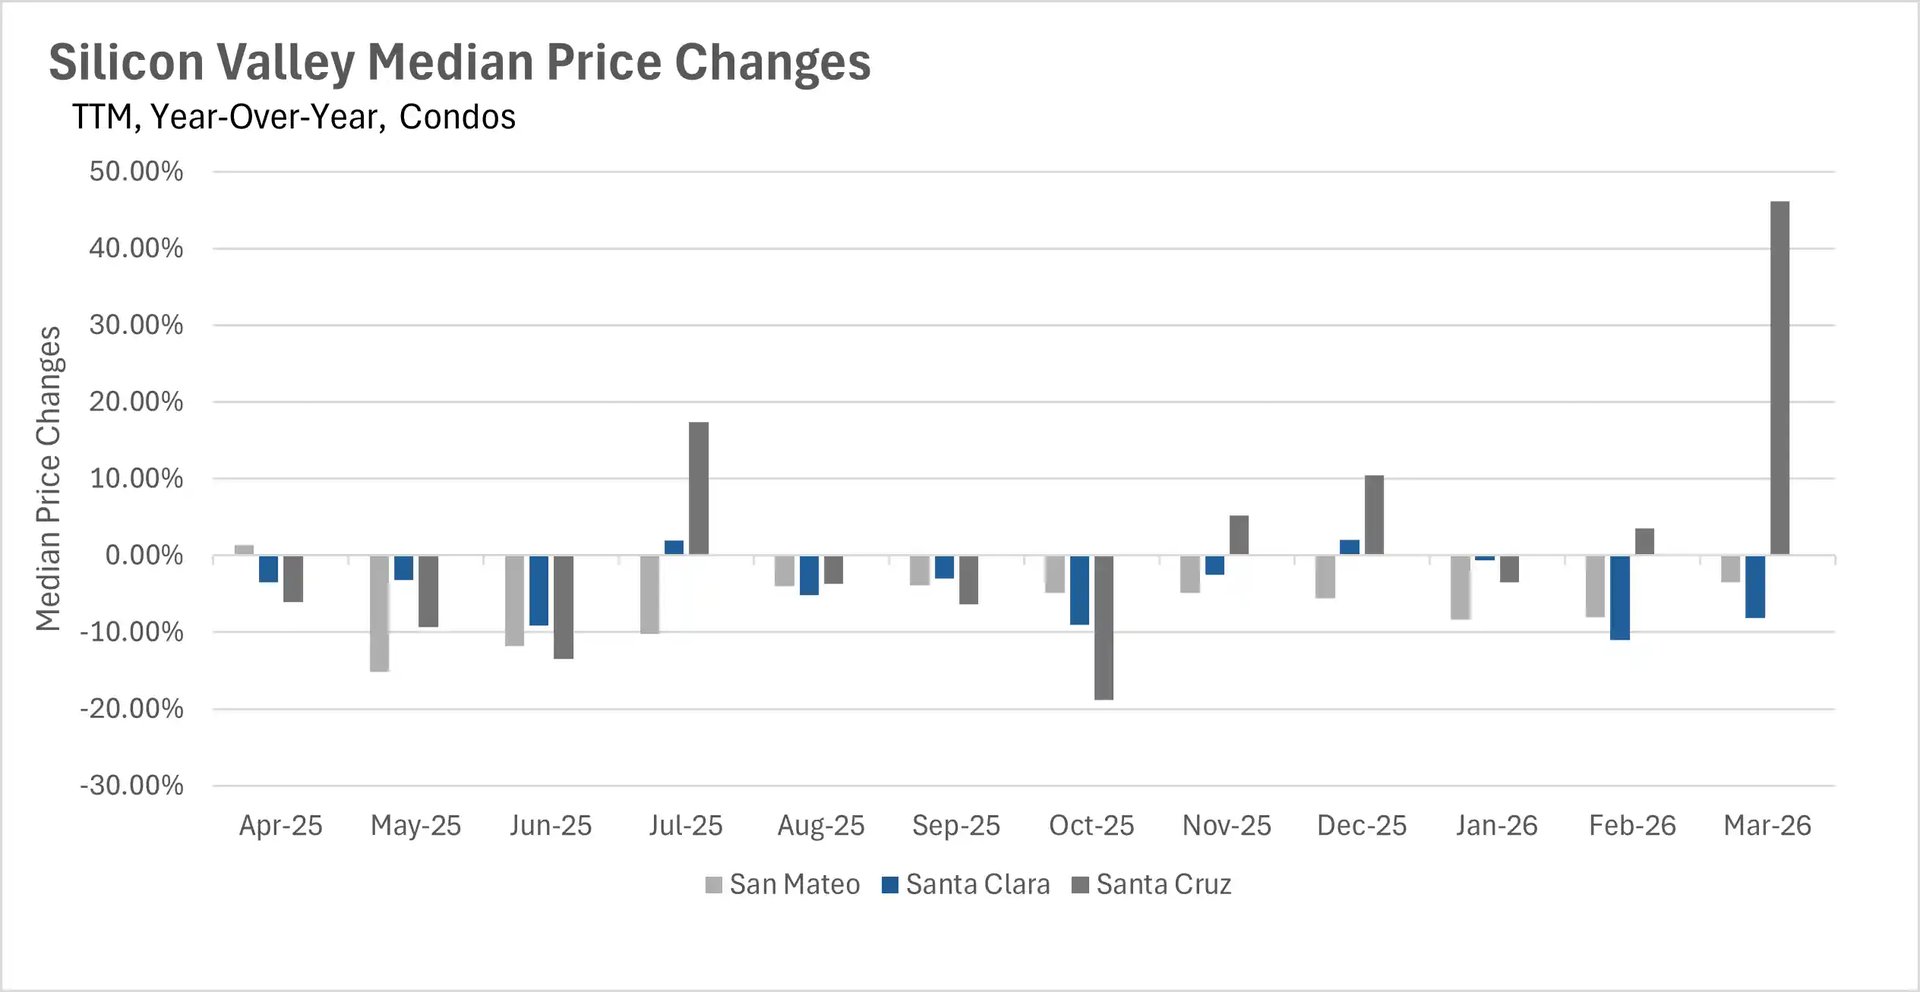
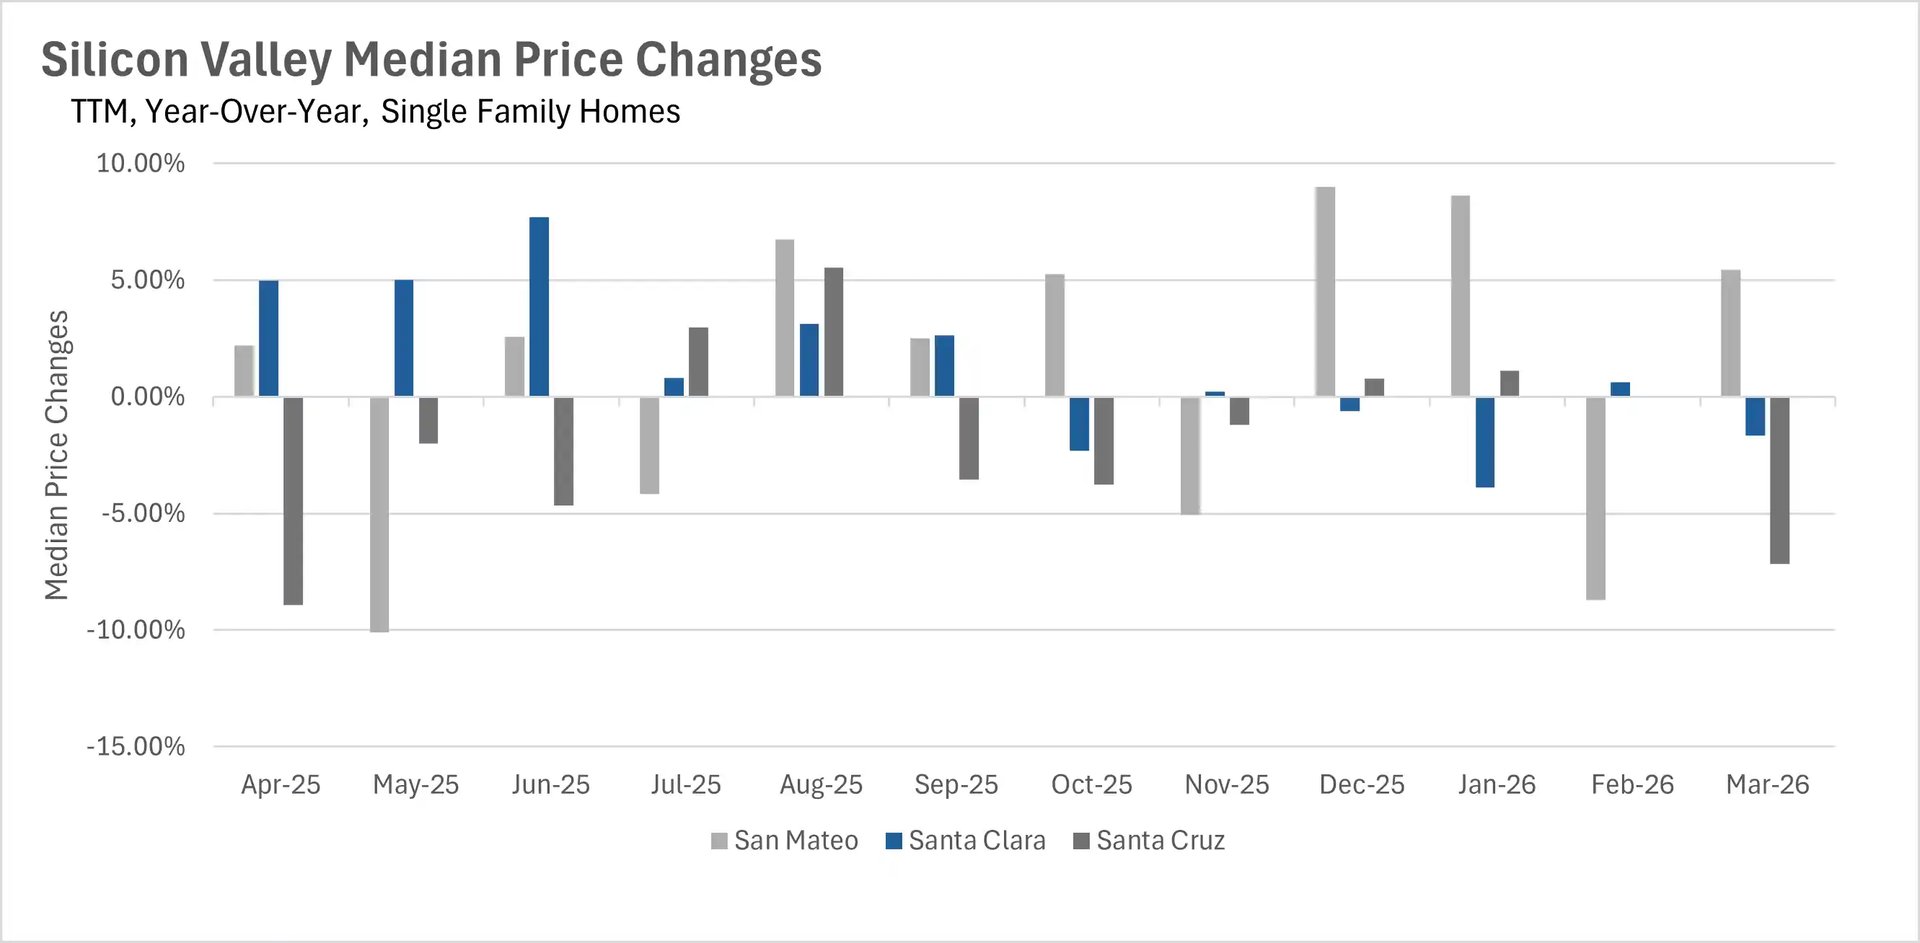
March delivered a wide range of price action across the Bay Area, with San Francisco clearly leading the pack. The median single-family home in San Francisco sold for $2,150,000, representing an 18.24% year-over-year increase, while the condo market posted a remarkable 27.17% surge to a median sale price of $1,357,500. Silicon Valley saw more mixed results, as San Mateo County single-family homes climbed 5.45% year-over-year to $2,175,000, while Santa Clara County dipped 1.65% to $2,080,188 and Santa Cruz County dropped 7.14% to $1,300,000.
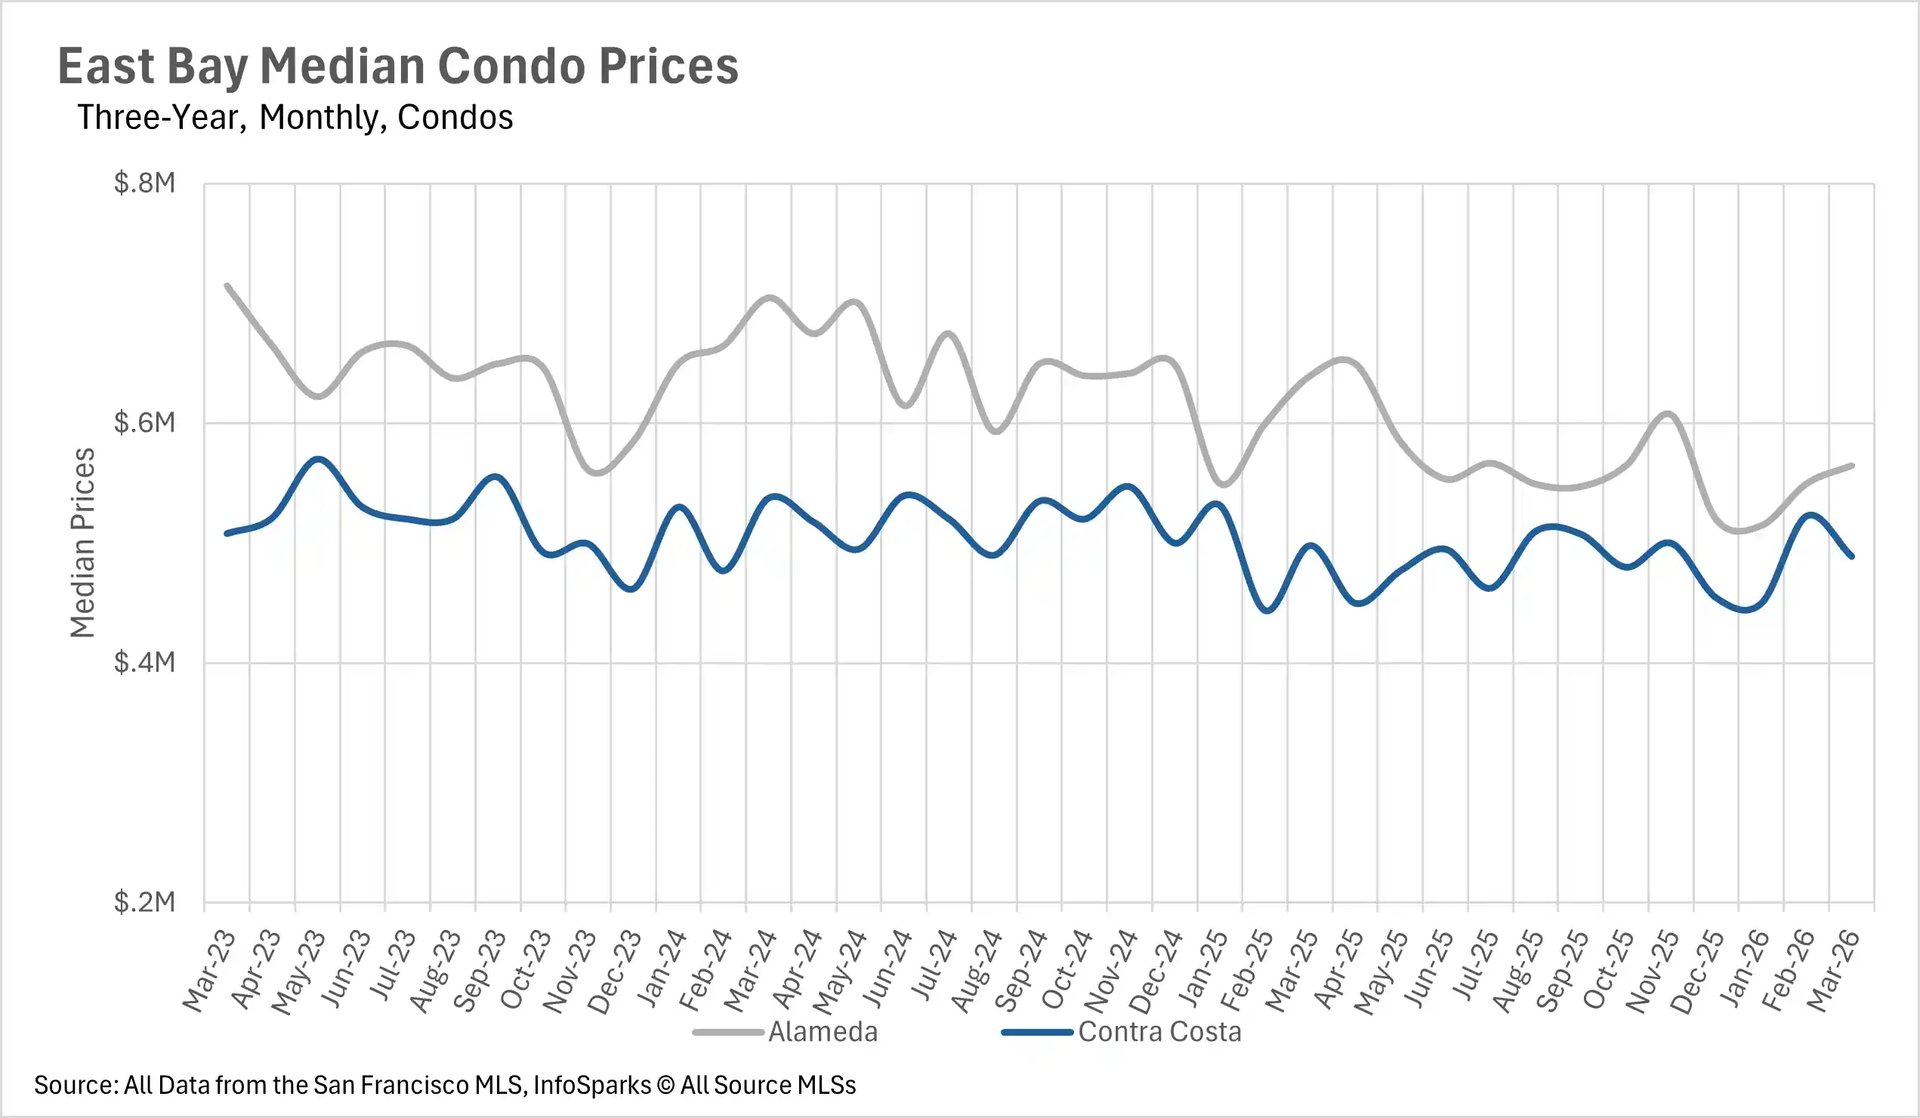
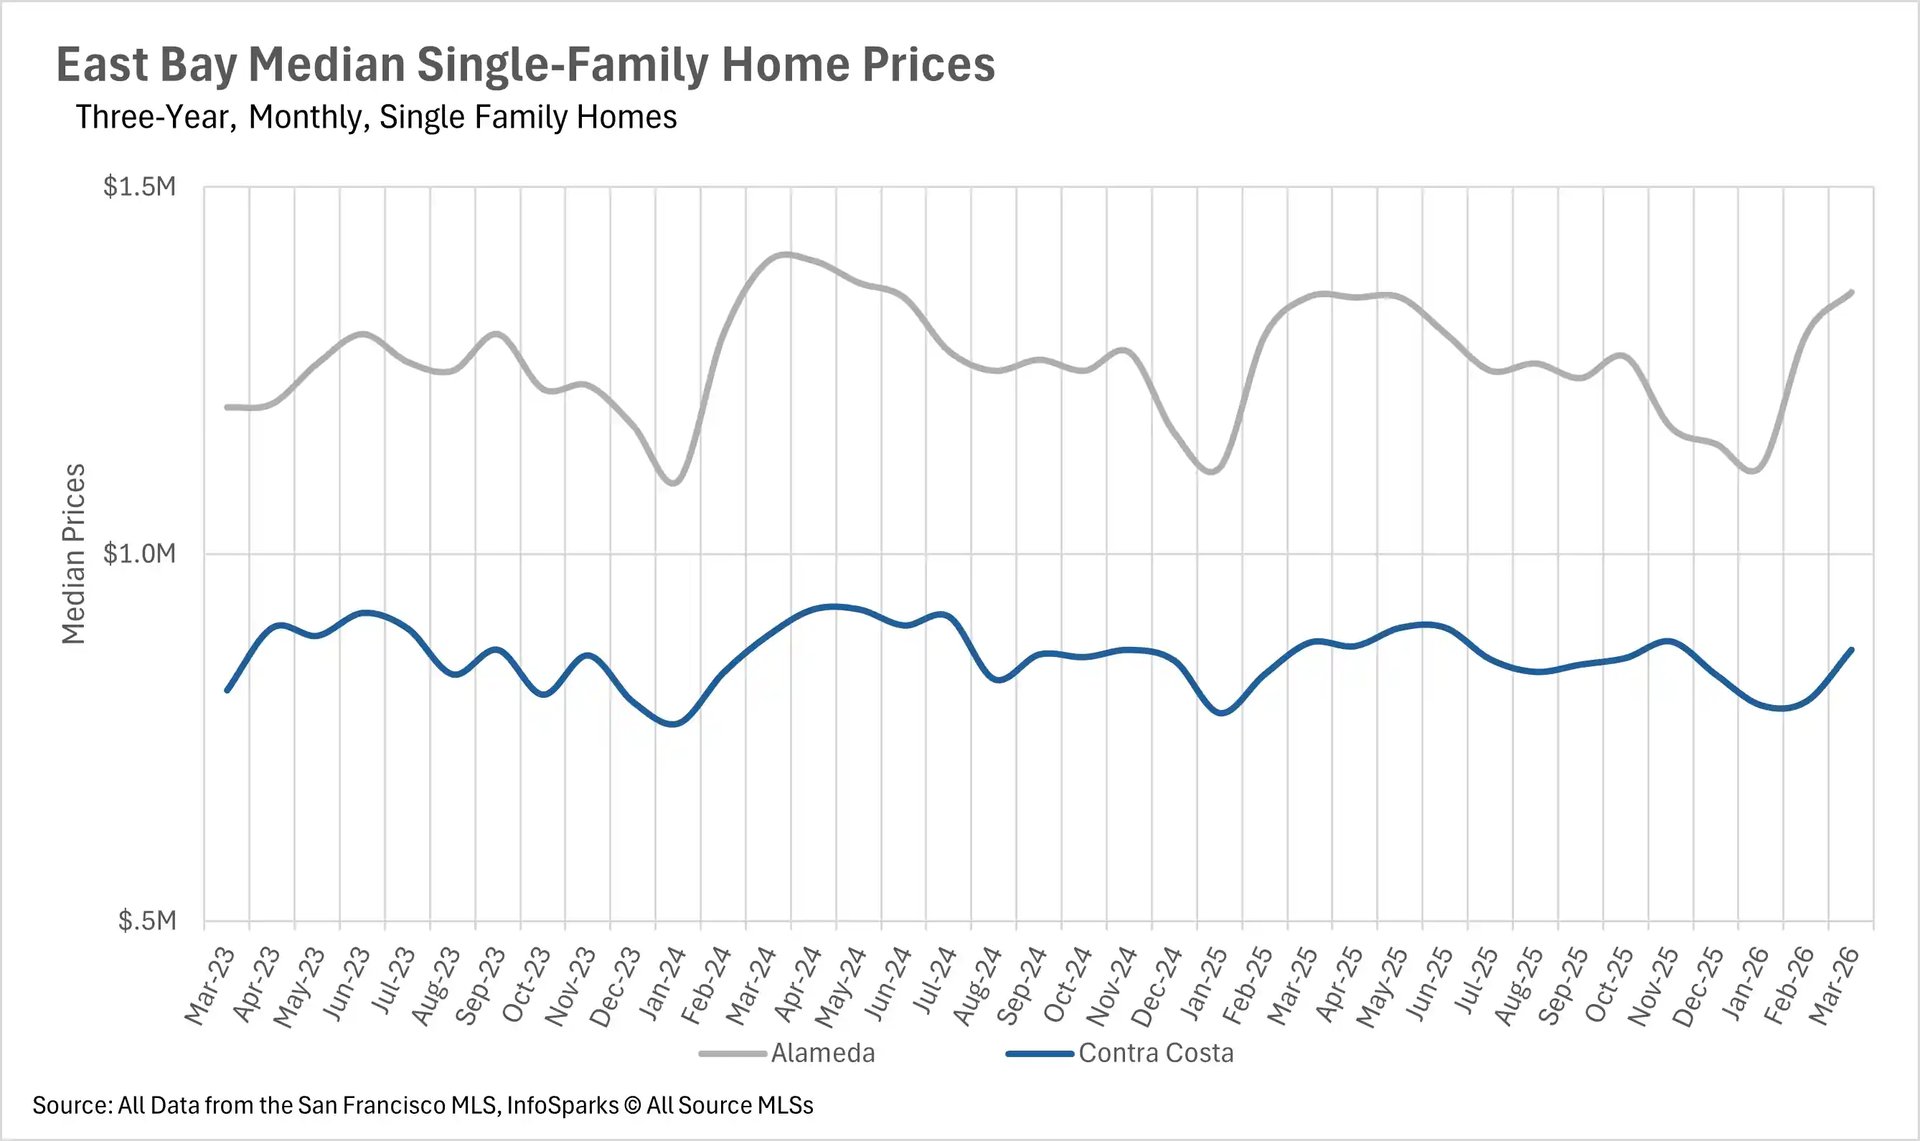
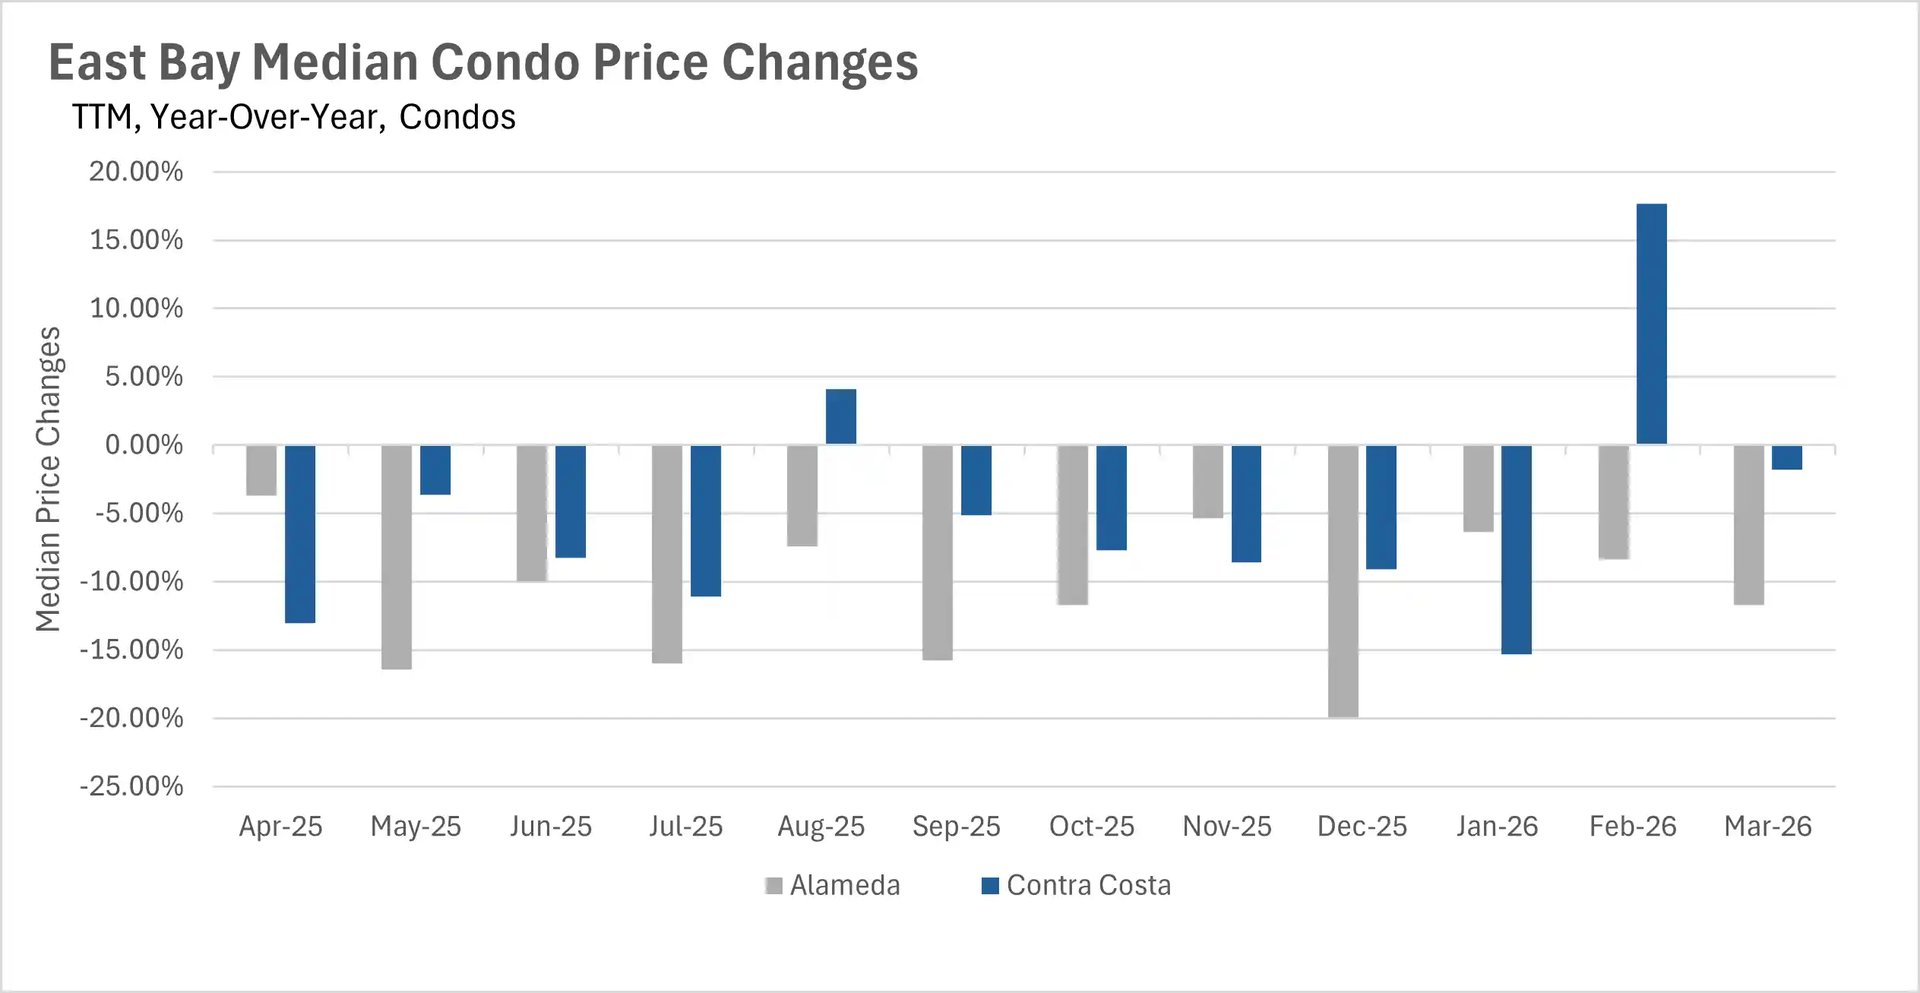
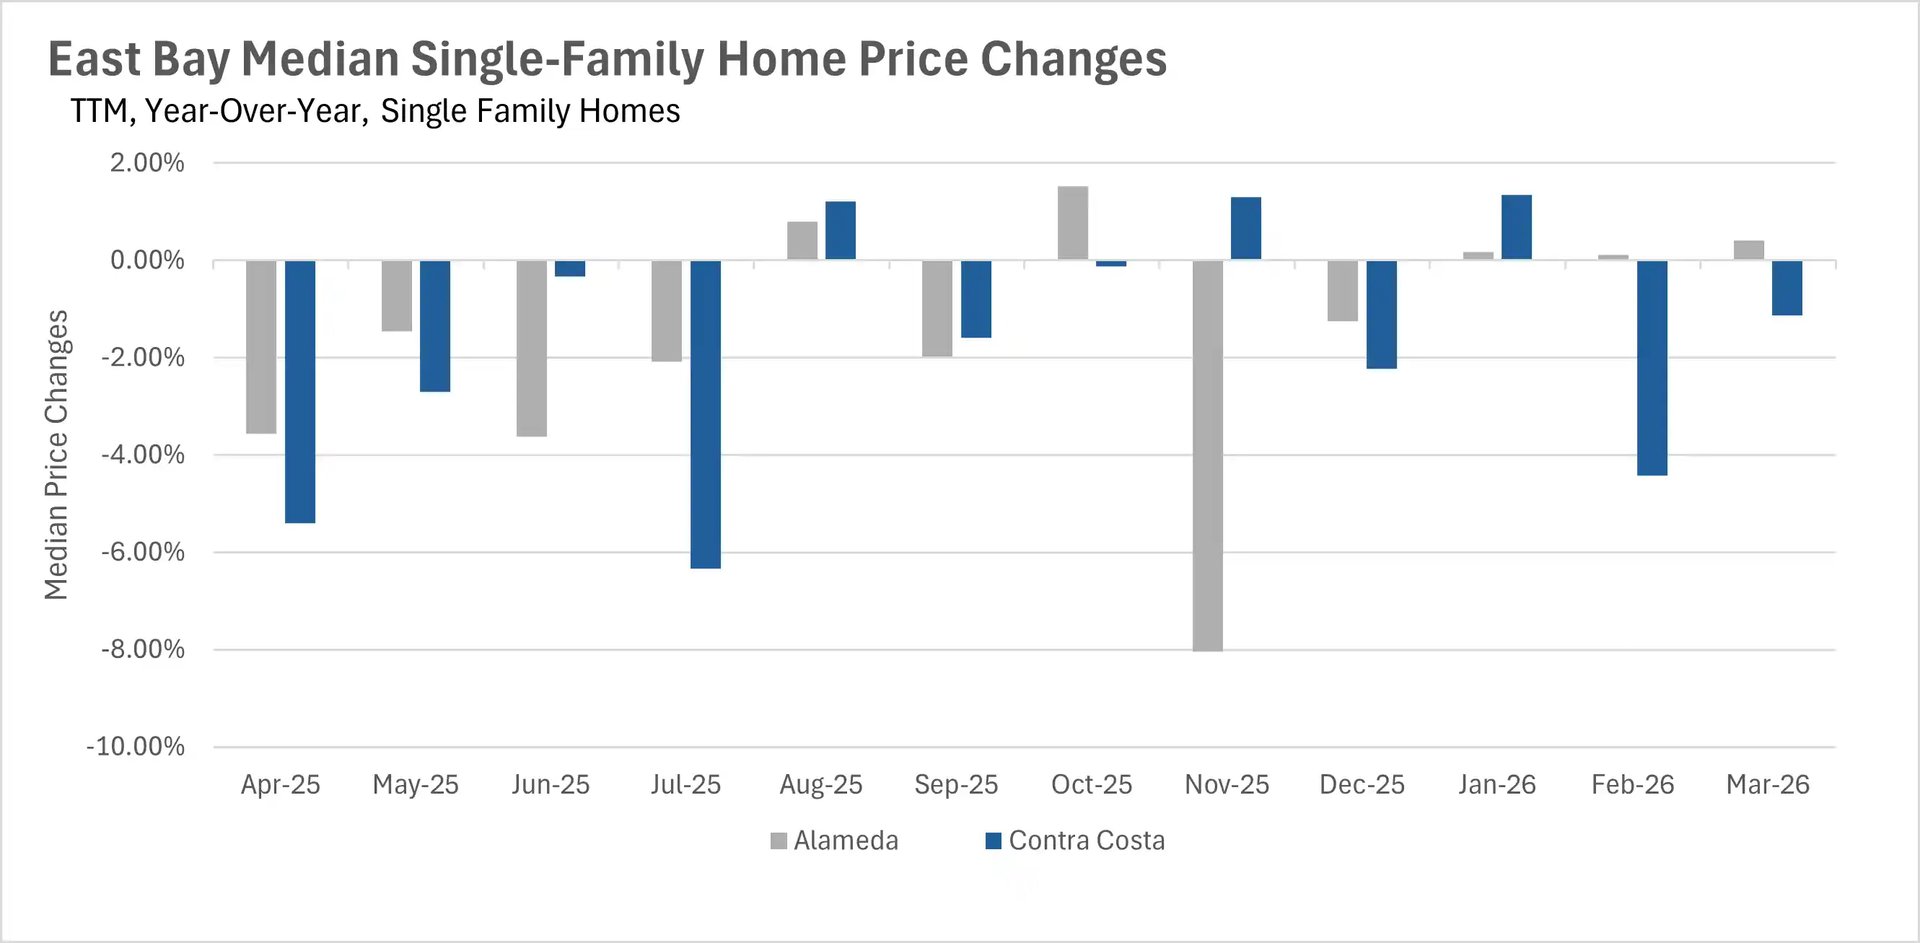
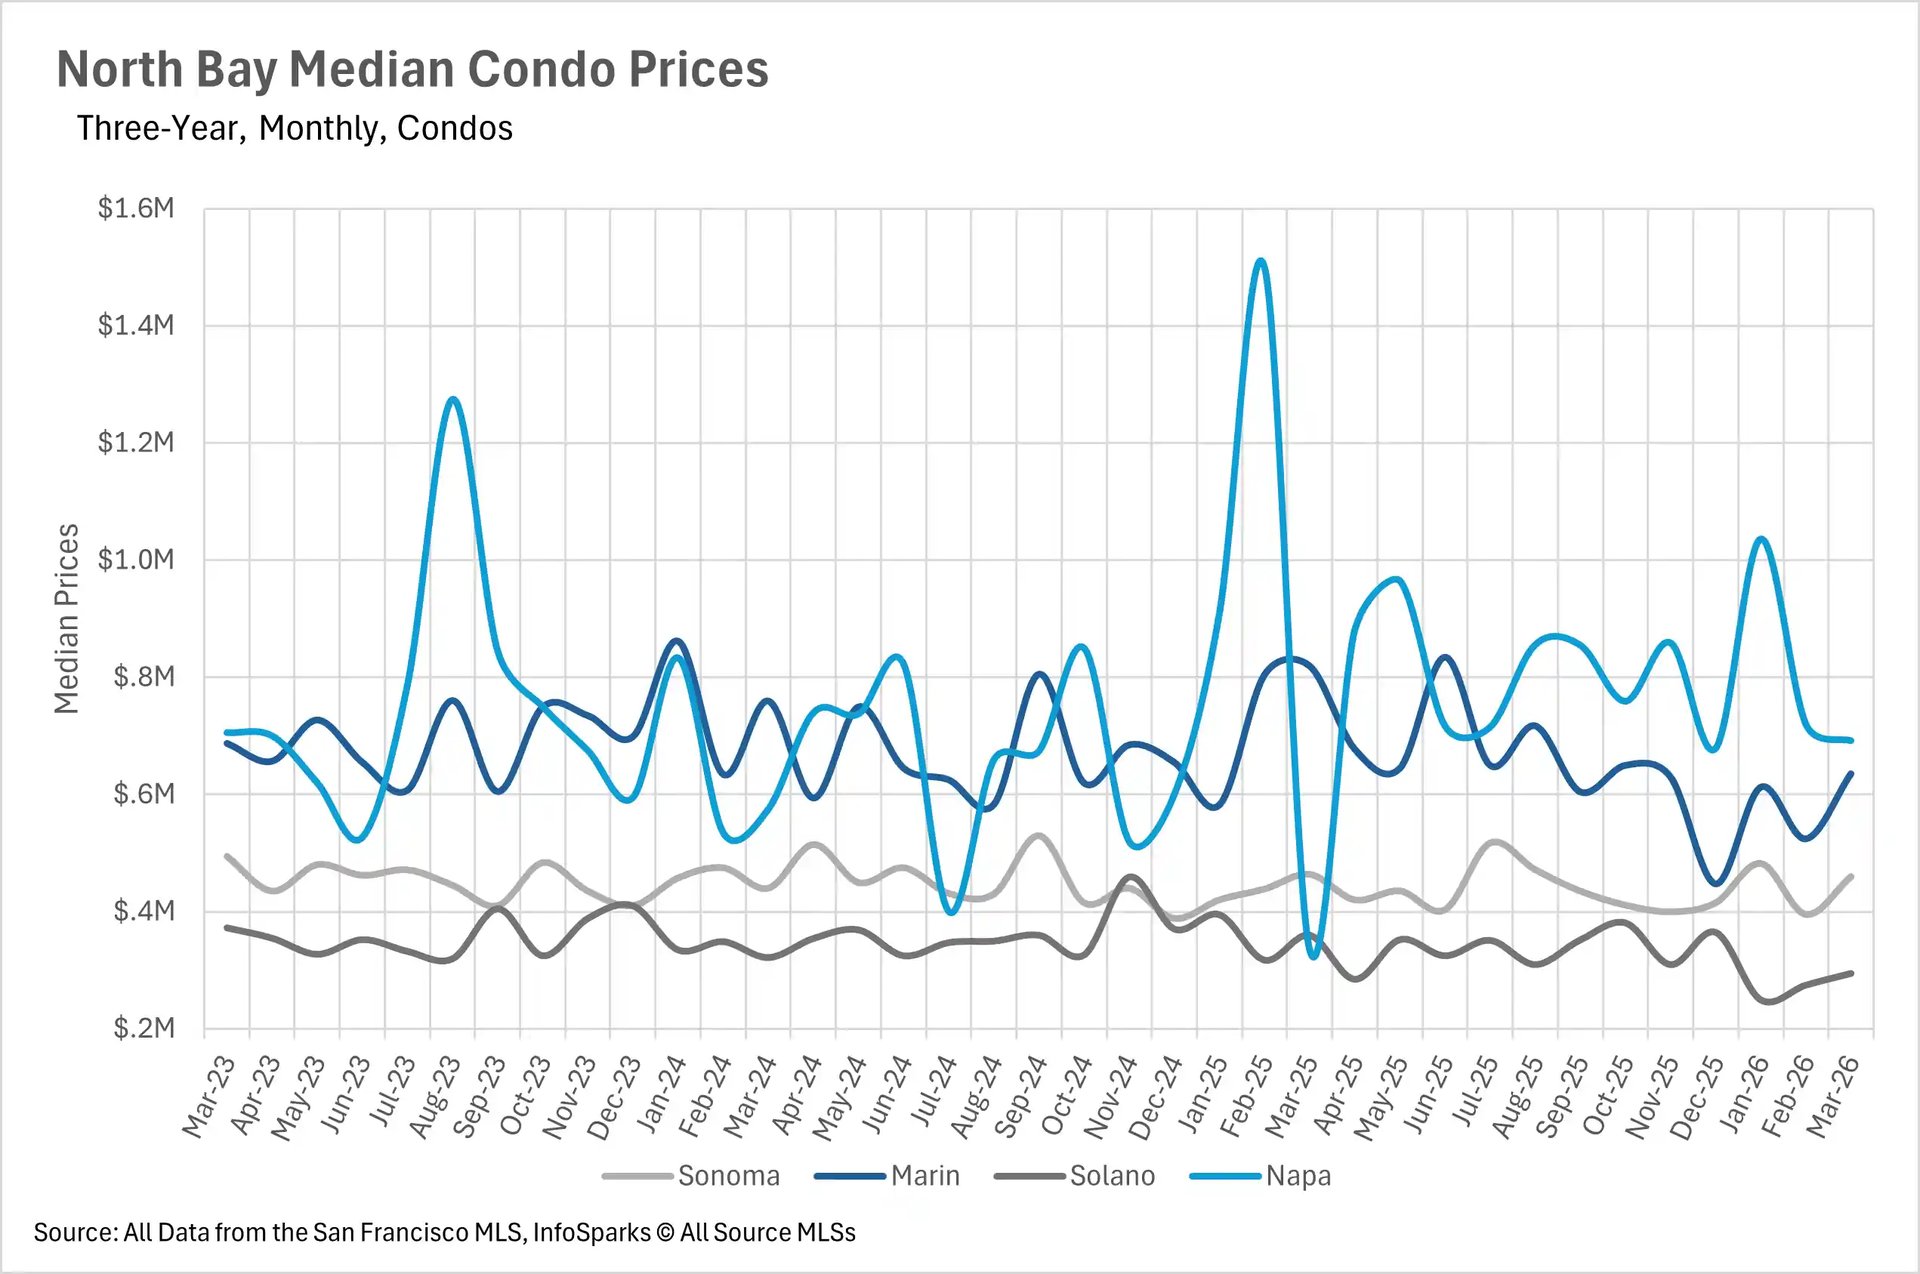
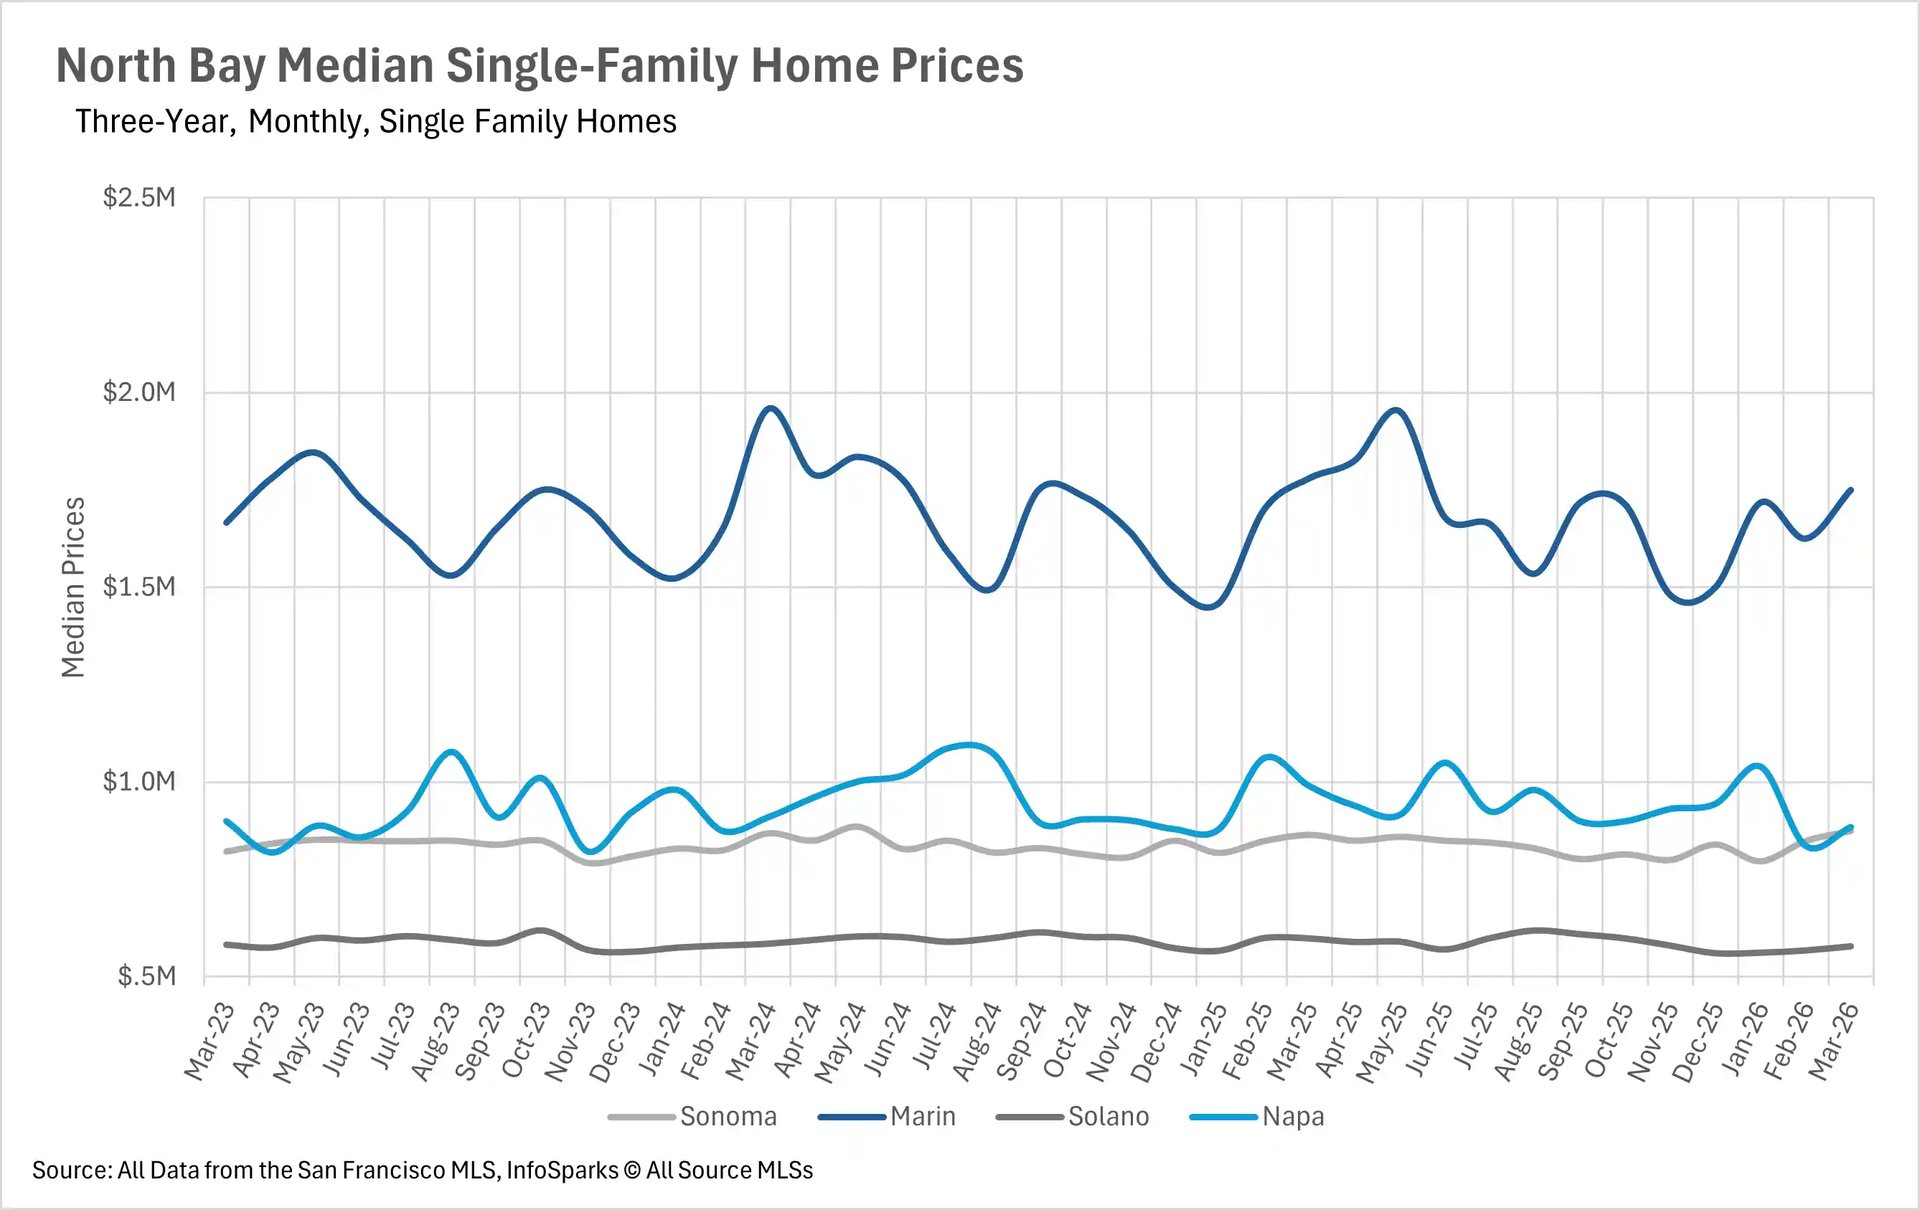
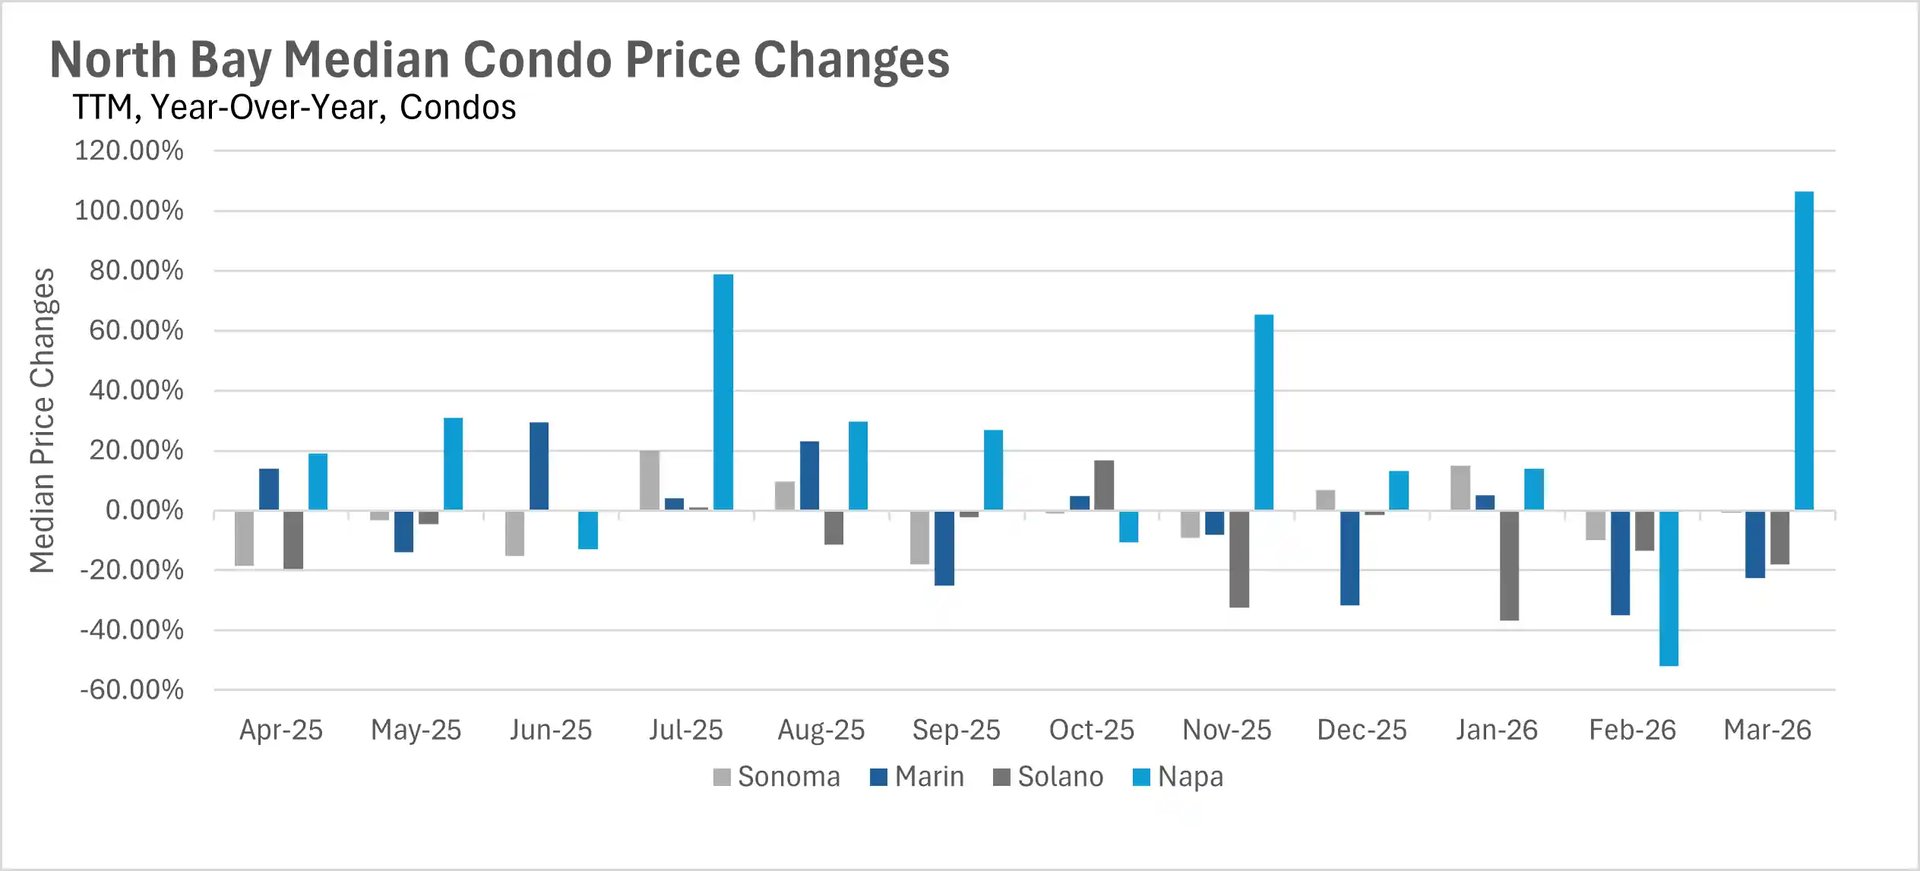
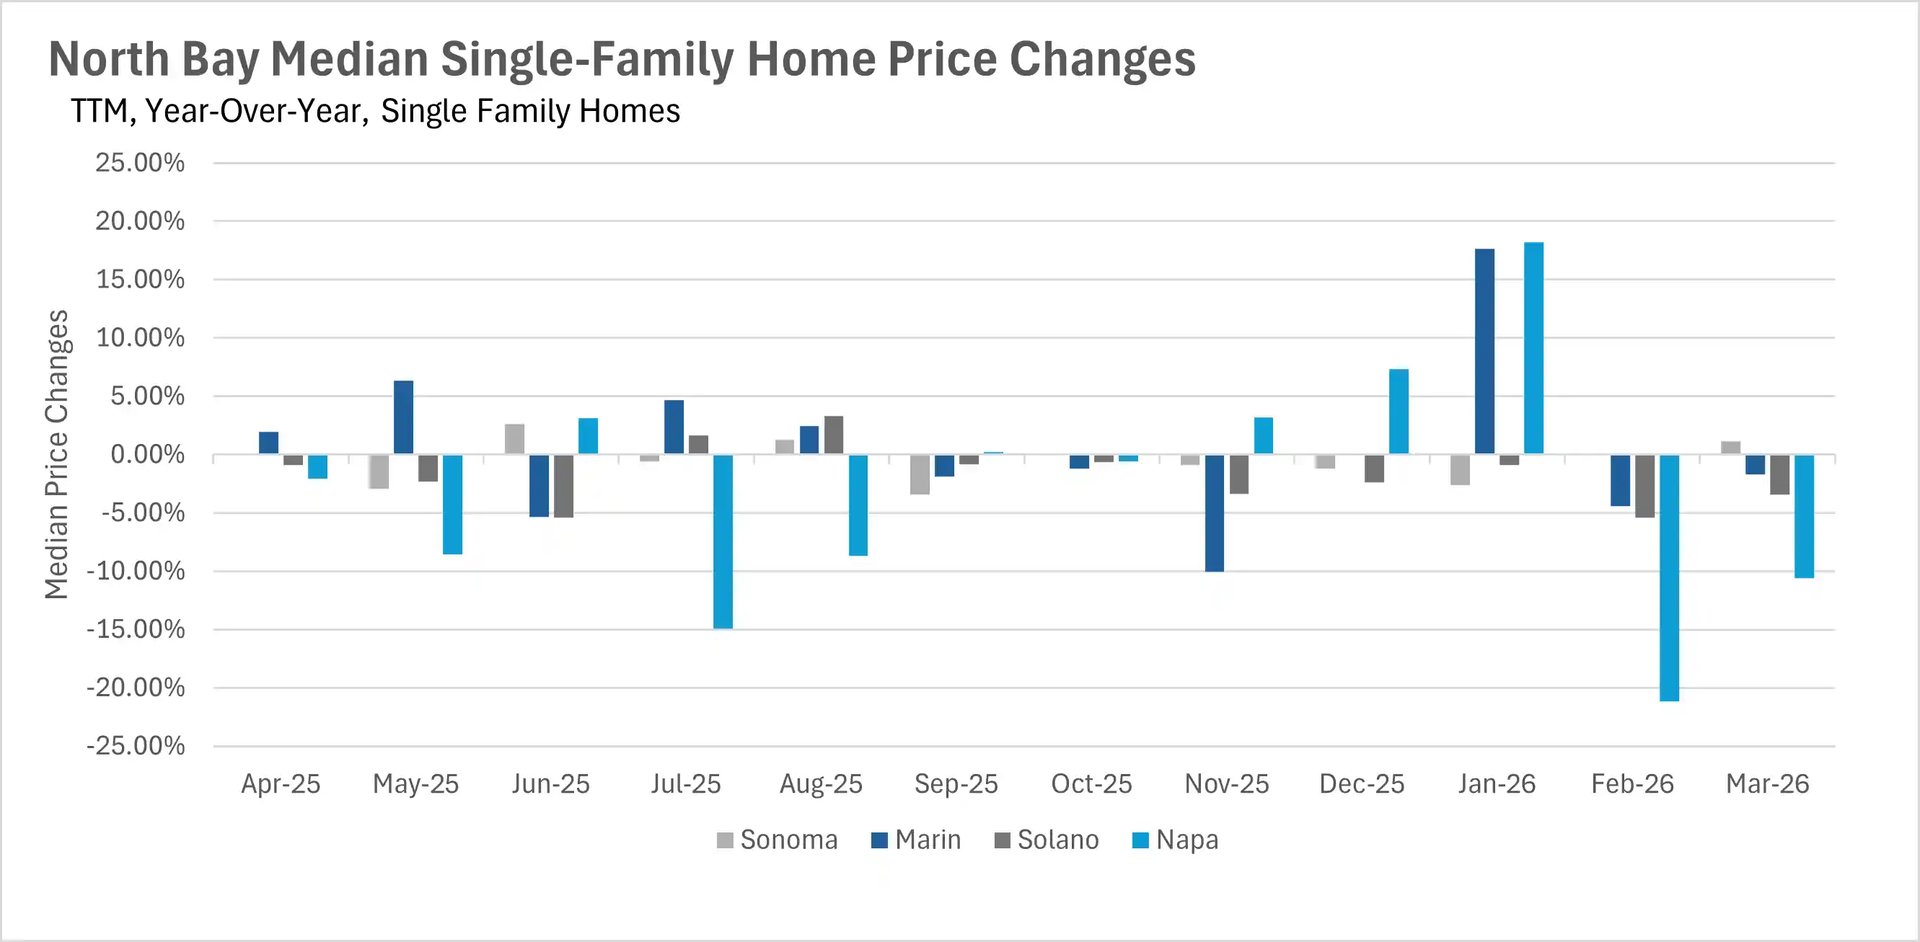
The East Bay remained remarkably stable on the single-family side, with Alameda County essentially flat at $1,357,000 and Contra Costa County down just 1.14% to $870,000. The North Bay told a more challenging story, as Napa County single-family homes declined 10.61% to $885,000 and Marin and Solano Counties posted modest pullbacks. However, Sonoma County was a bright spot, posting a 1.16% year-over-year gain to $875,000. The condo market was characteristically volatile, with double-digit declines in several counties offset by eye-popping gains in Santa Cruz and Napa Counties.
Inventory remains severely constrained across the Bay Area
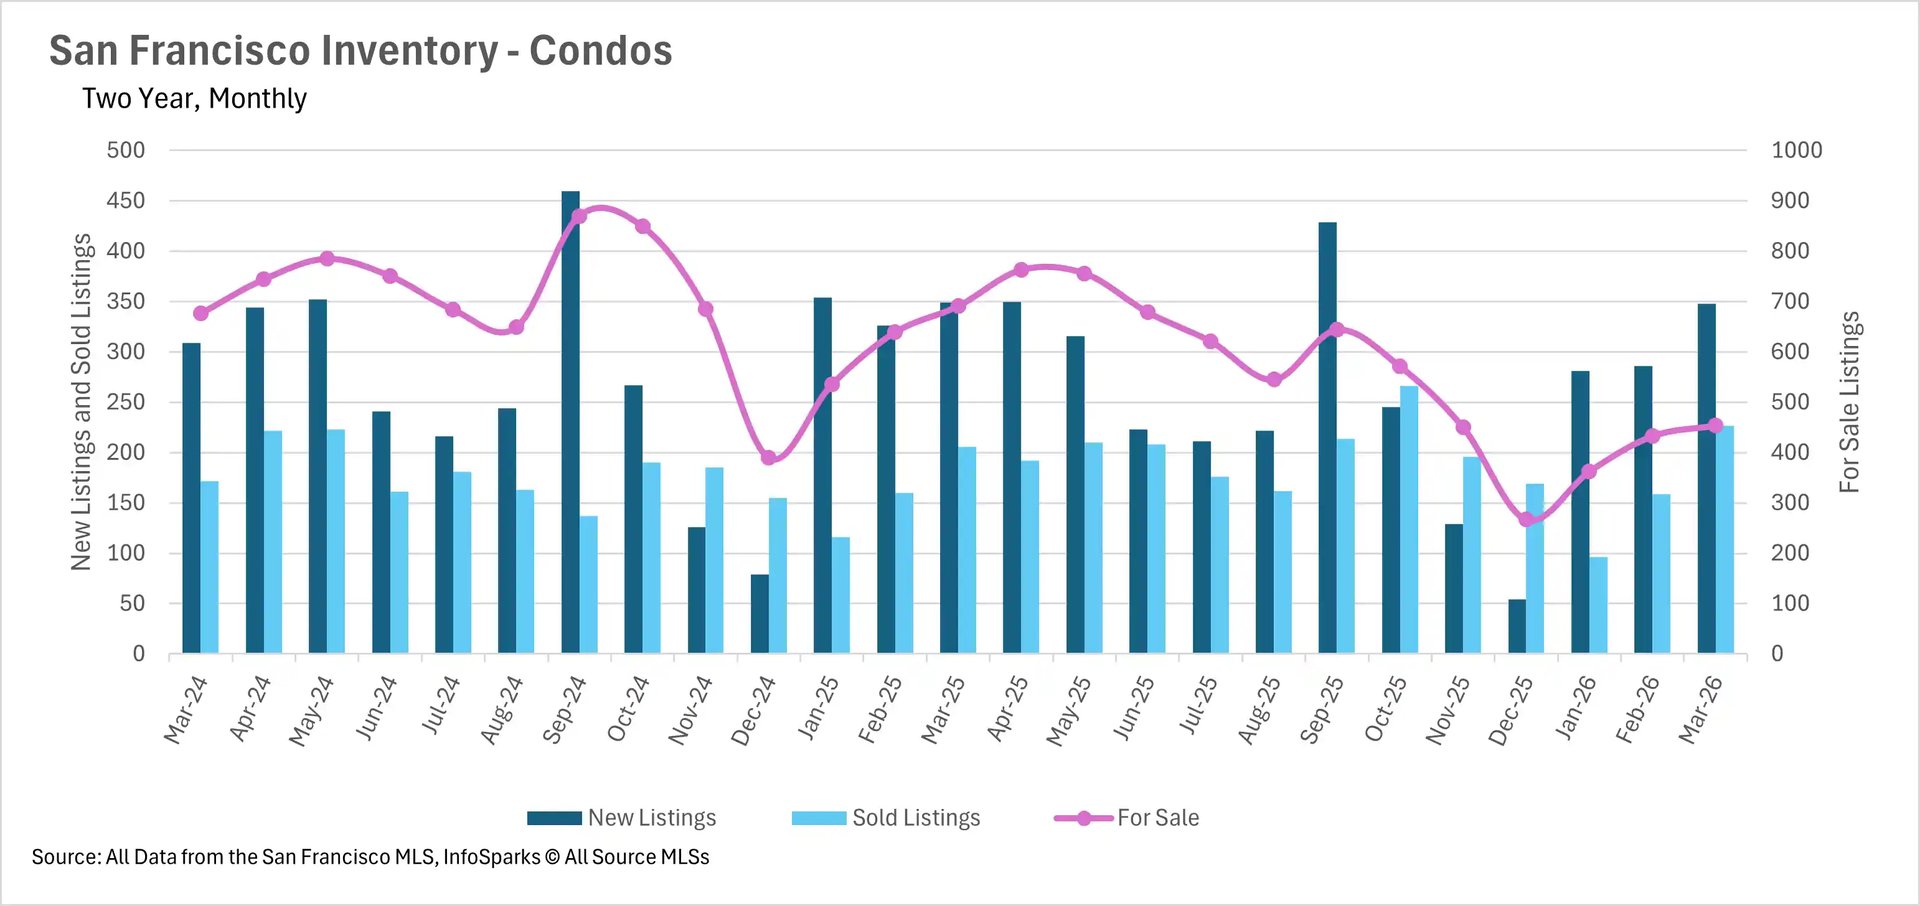
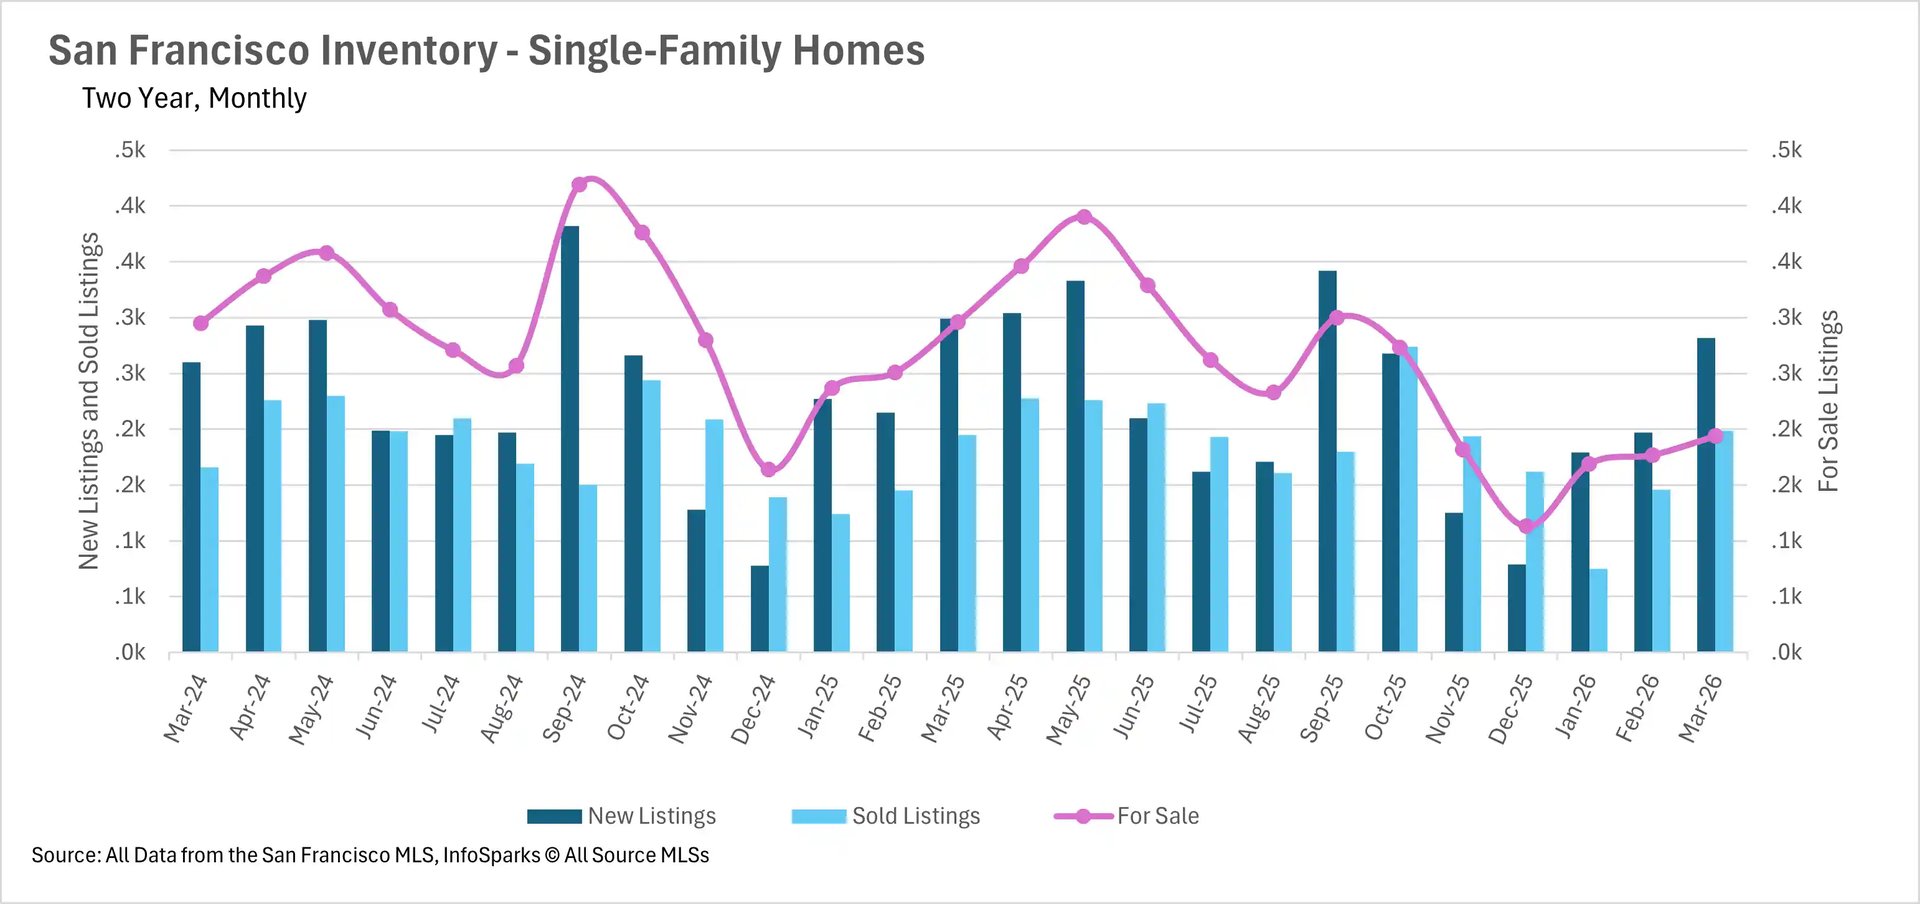
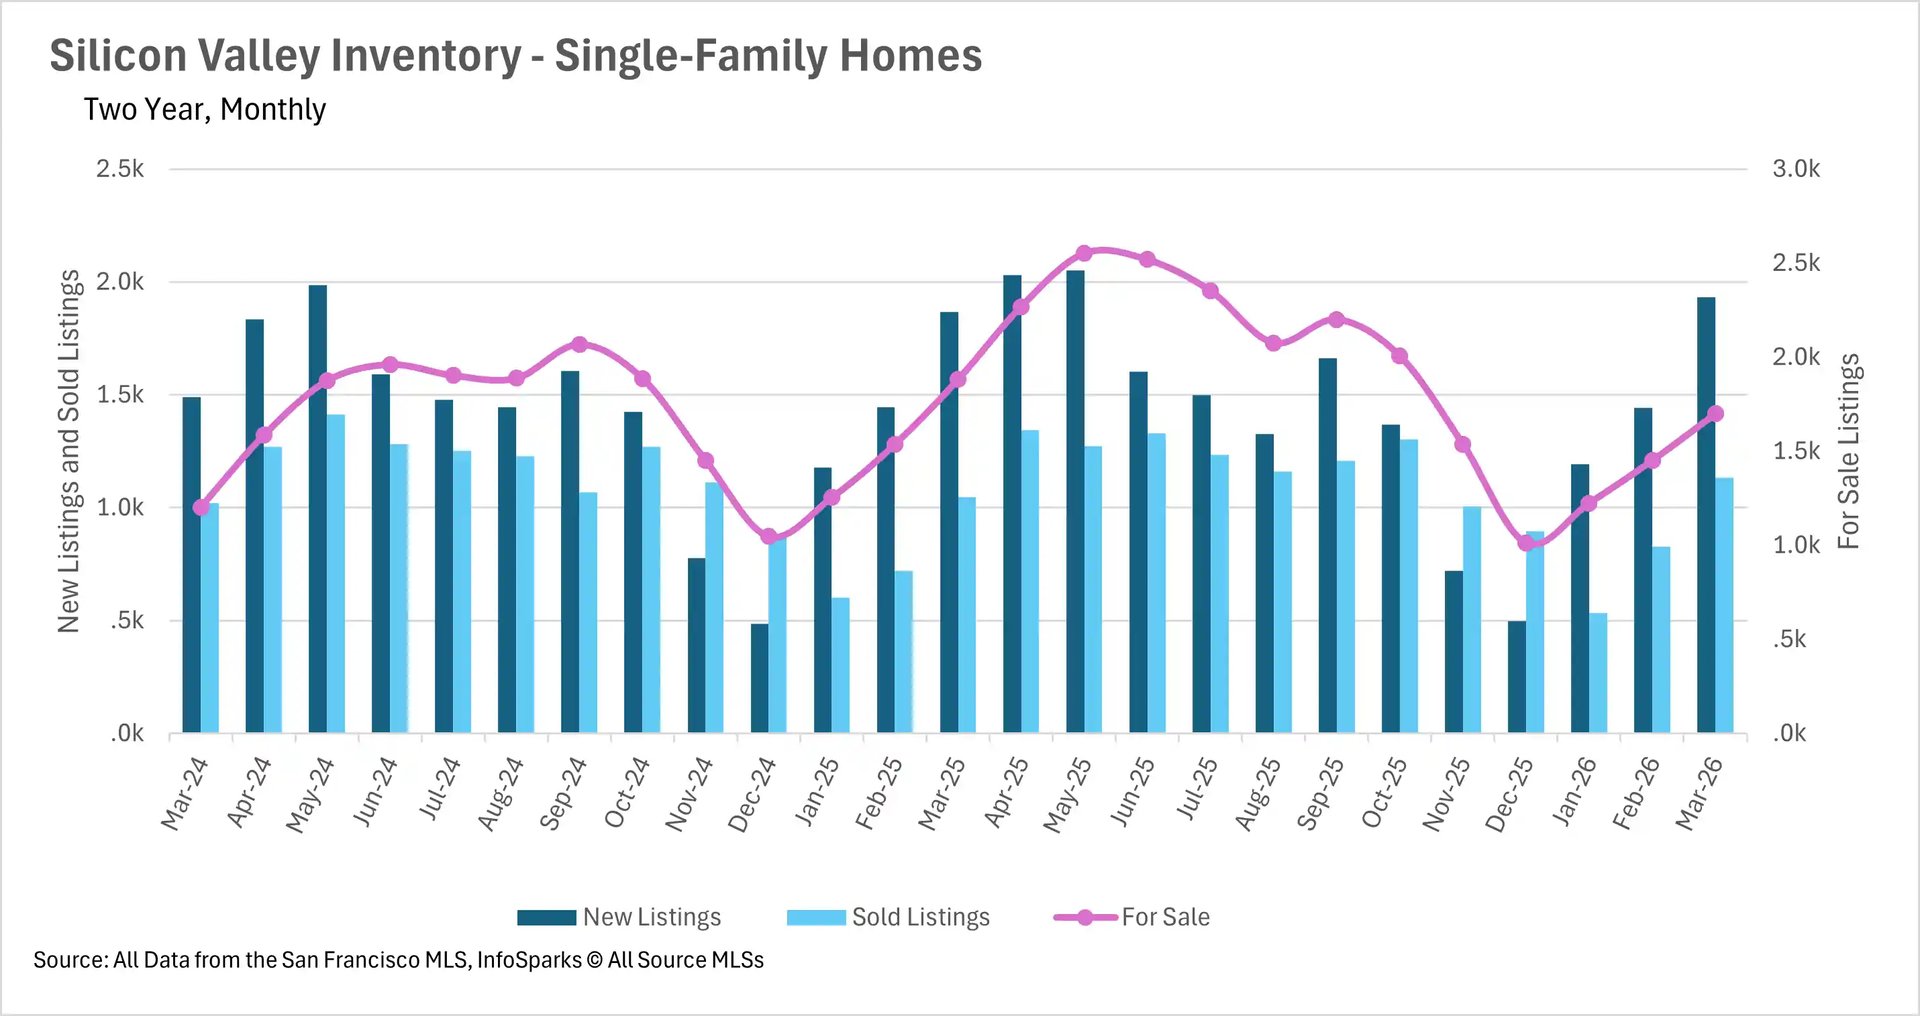
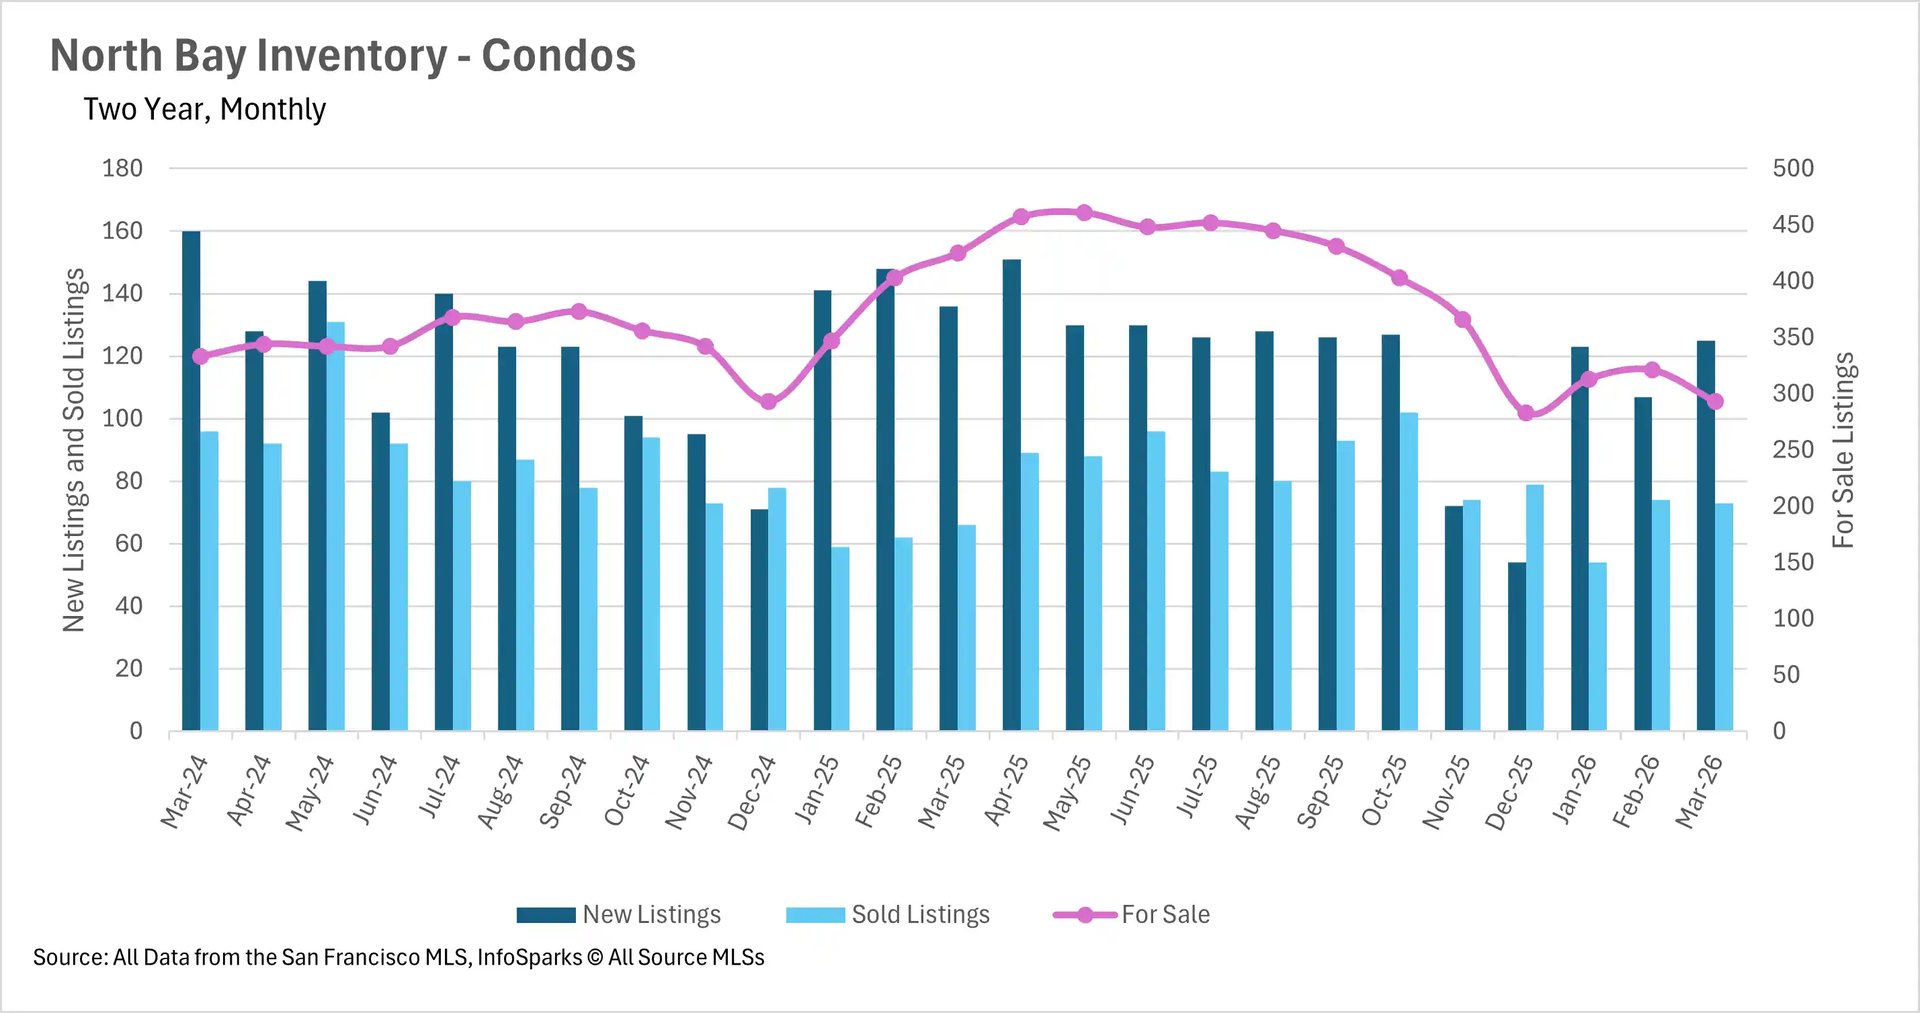
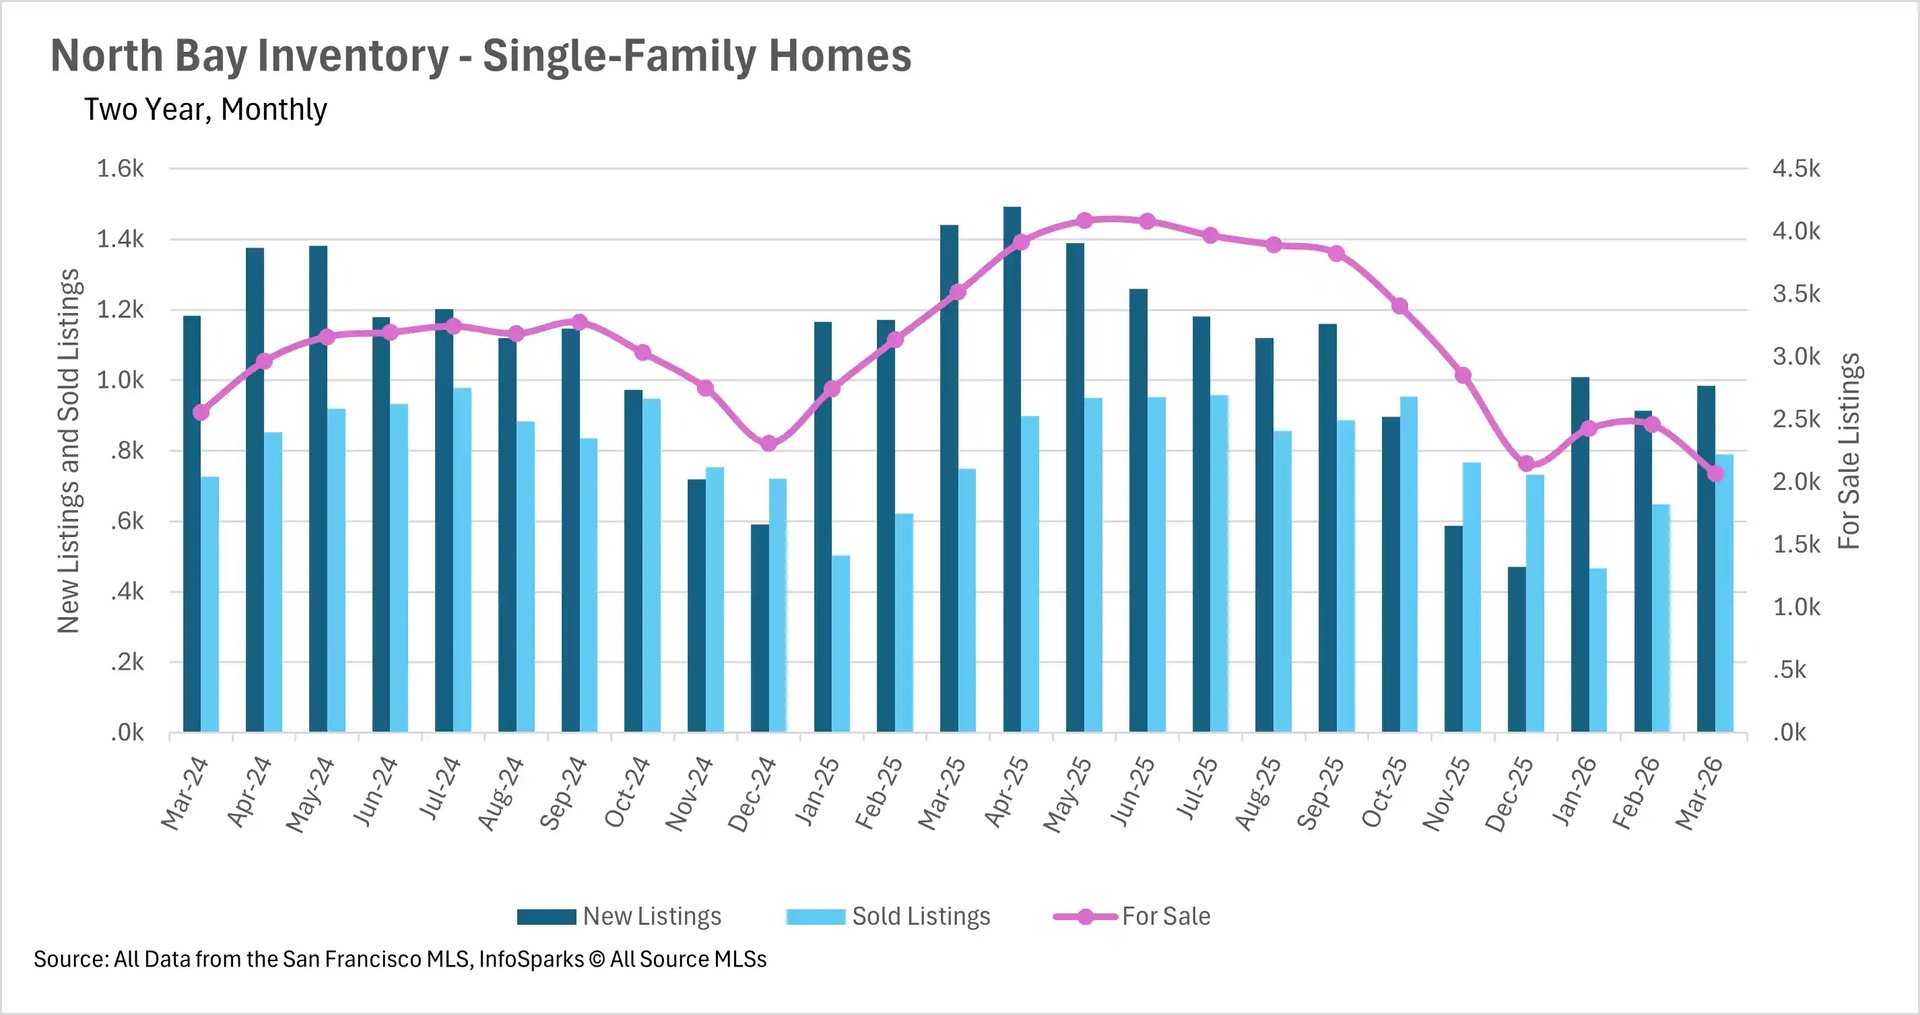
Despite the arrival of the spring selling season, inventory levels across the Bay Area remain well below where they were a year ago. The North Bay continues to experience the most severe shortage, with single-family home inventory down 41.16% year-over-year and condo inventory down 31.06%. San Francisco isn't far behind, with single-family inventory down 34.46% and condo inventory down 34.30%, leaving fewer than 650 homes available for sale in the entire city.
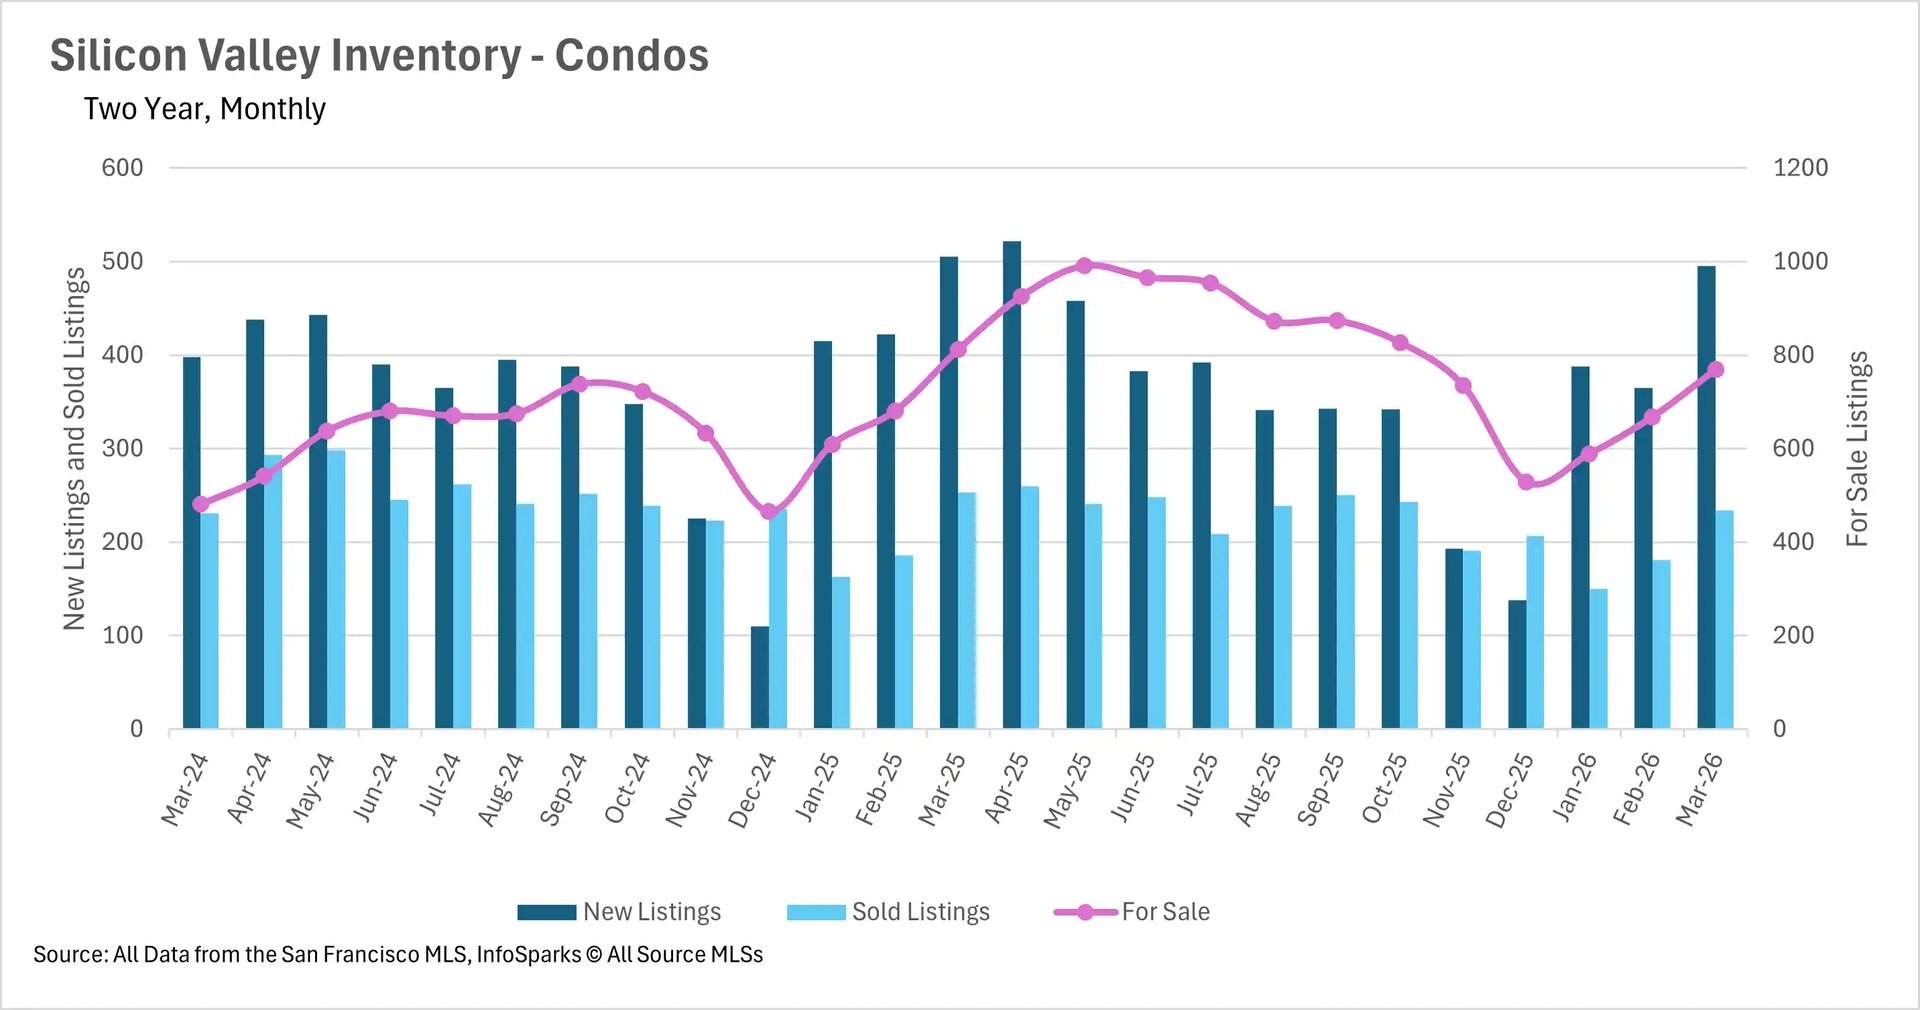
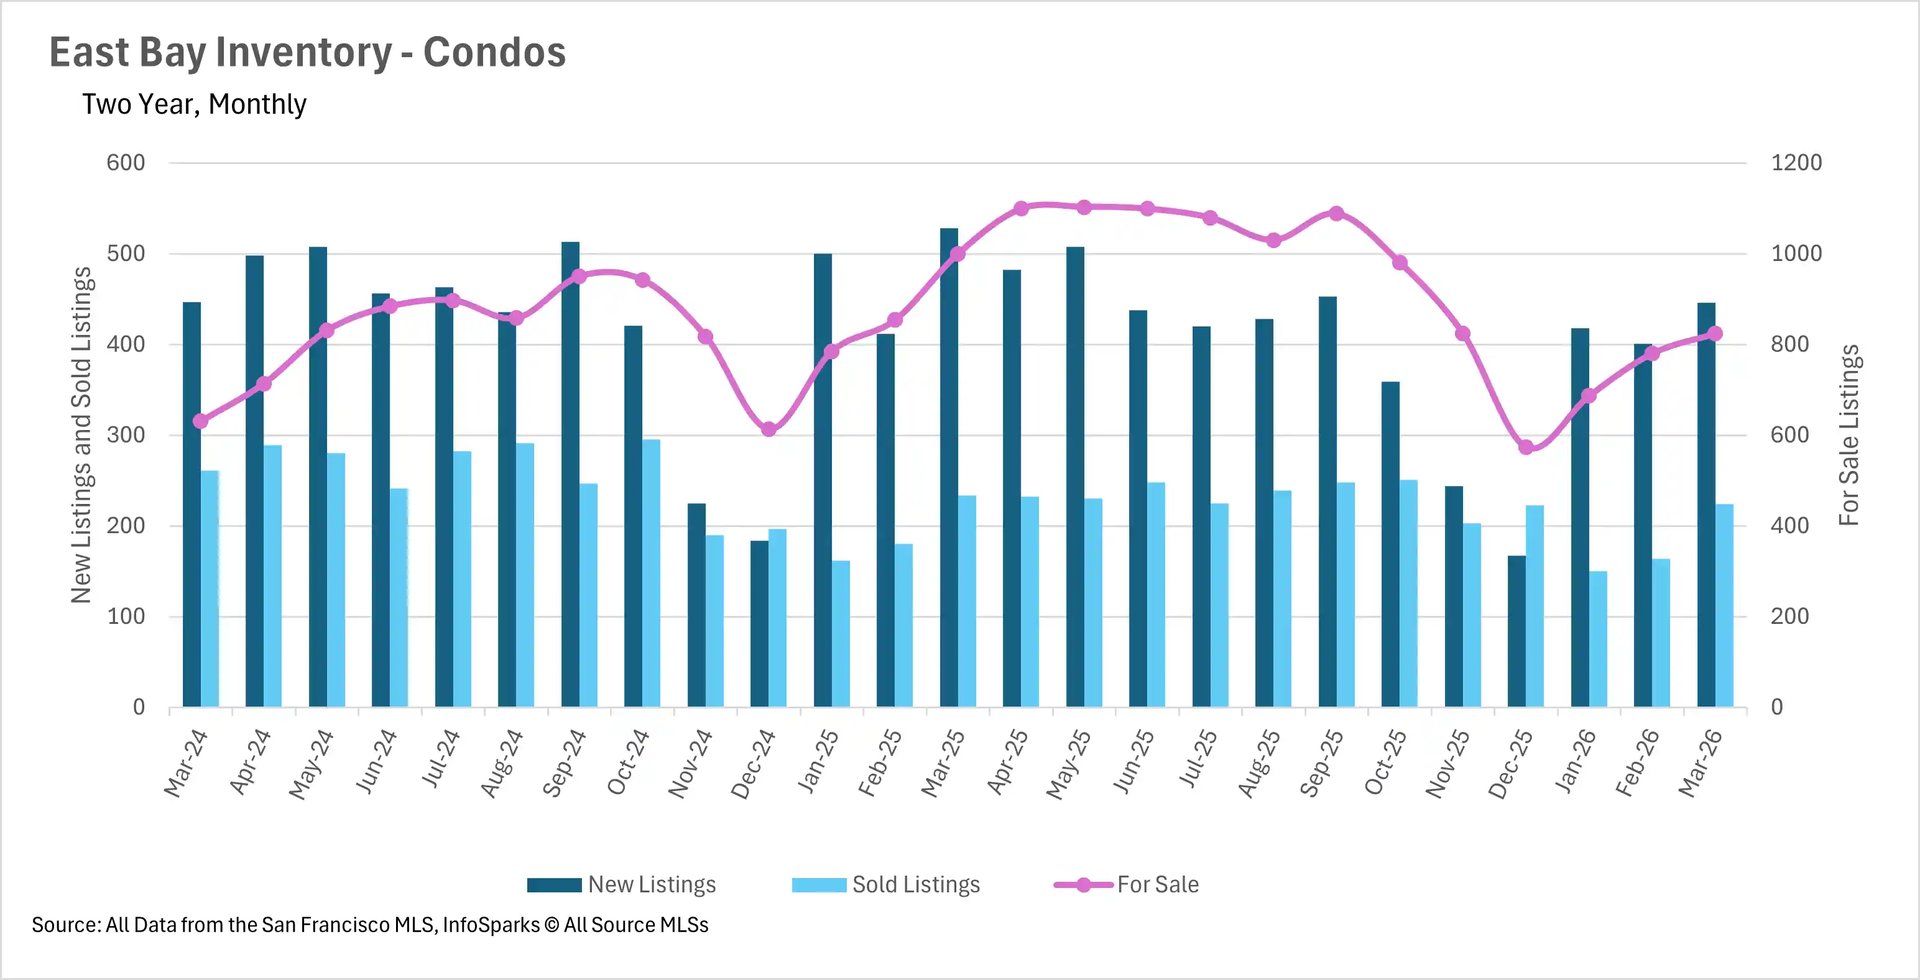
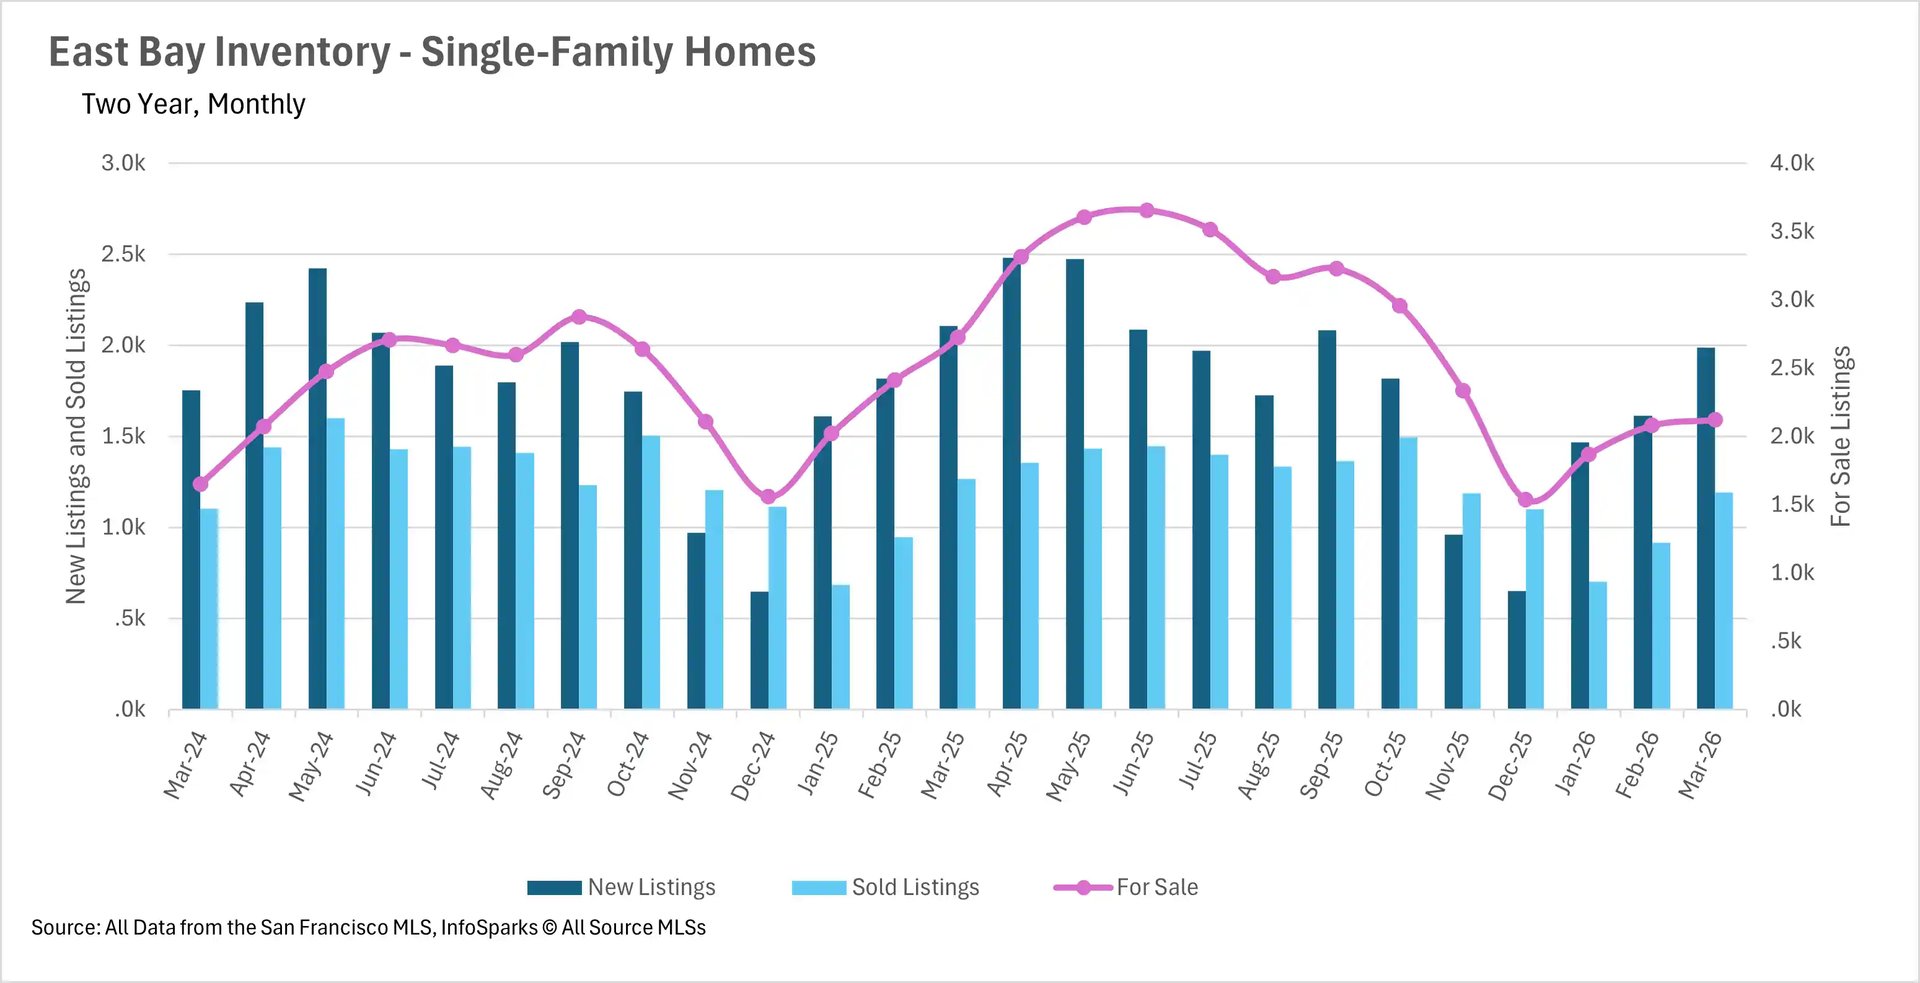
The East Bay has seen single-family inventory decline by 22.23% and condo inventory drop by 17.60%, while Silicon Valley rounds out the picture with single-family inventory down 9.68% and condo inventory down just 5.30%. The good news is that new listings and sold listings are picking up across the region as the spring market heats up. Silicon Valley saw new single-family listings jump 34.14% month-over-month, and most North Bay counties posted meaningful month-over-month improvements as well. However, with buyer demand still outpacing new supply in most markets, inventory levels are likely to remain suppressed in the near term.
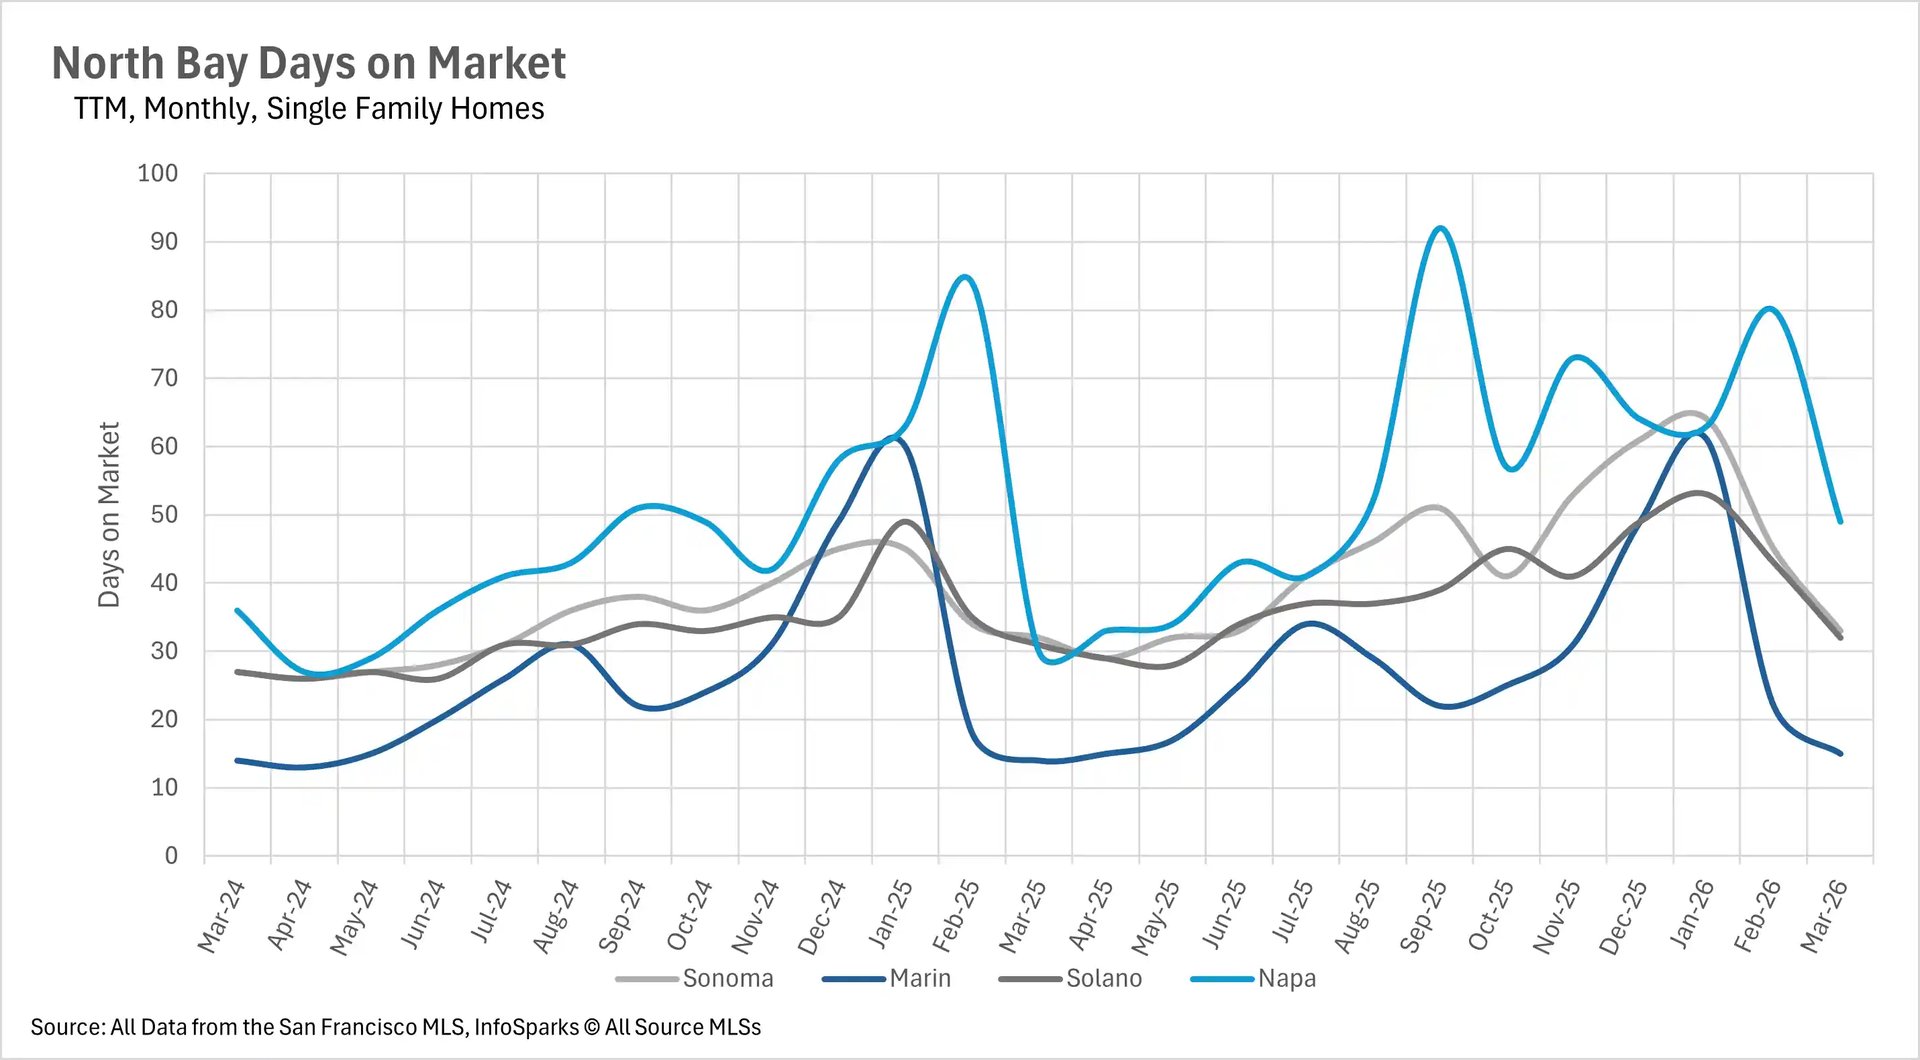
Single-family homes are flying off the shelves across the region
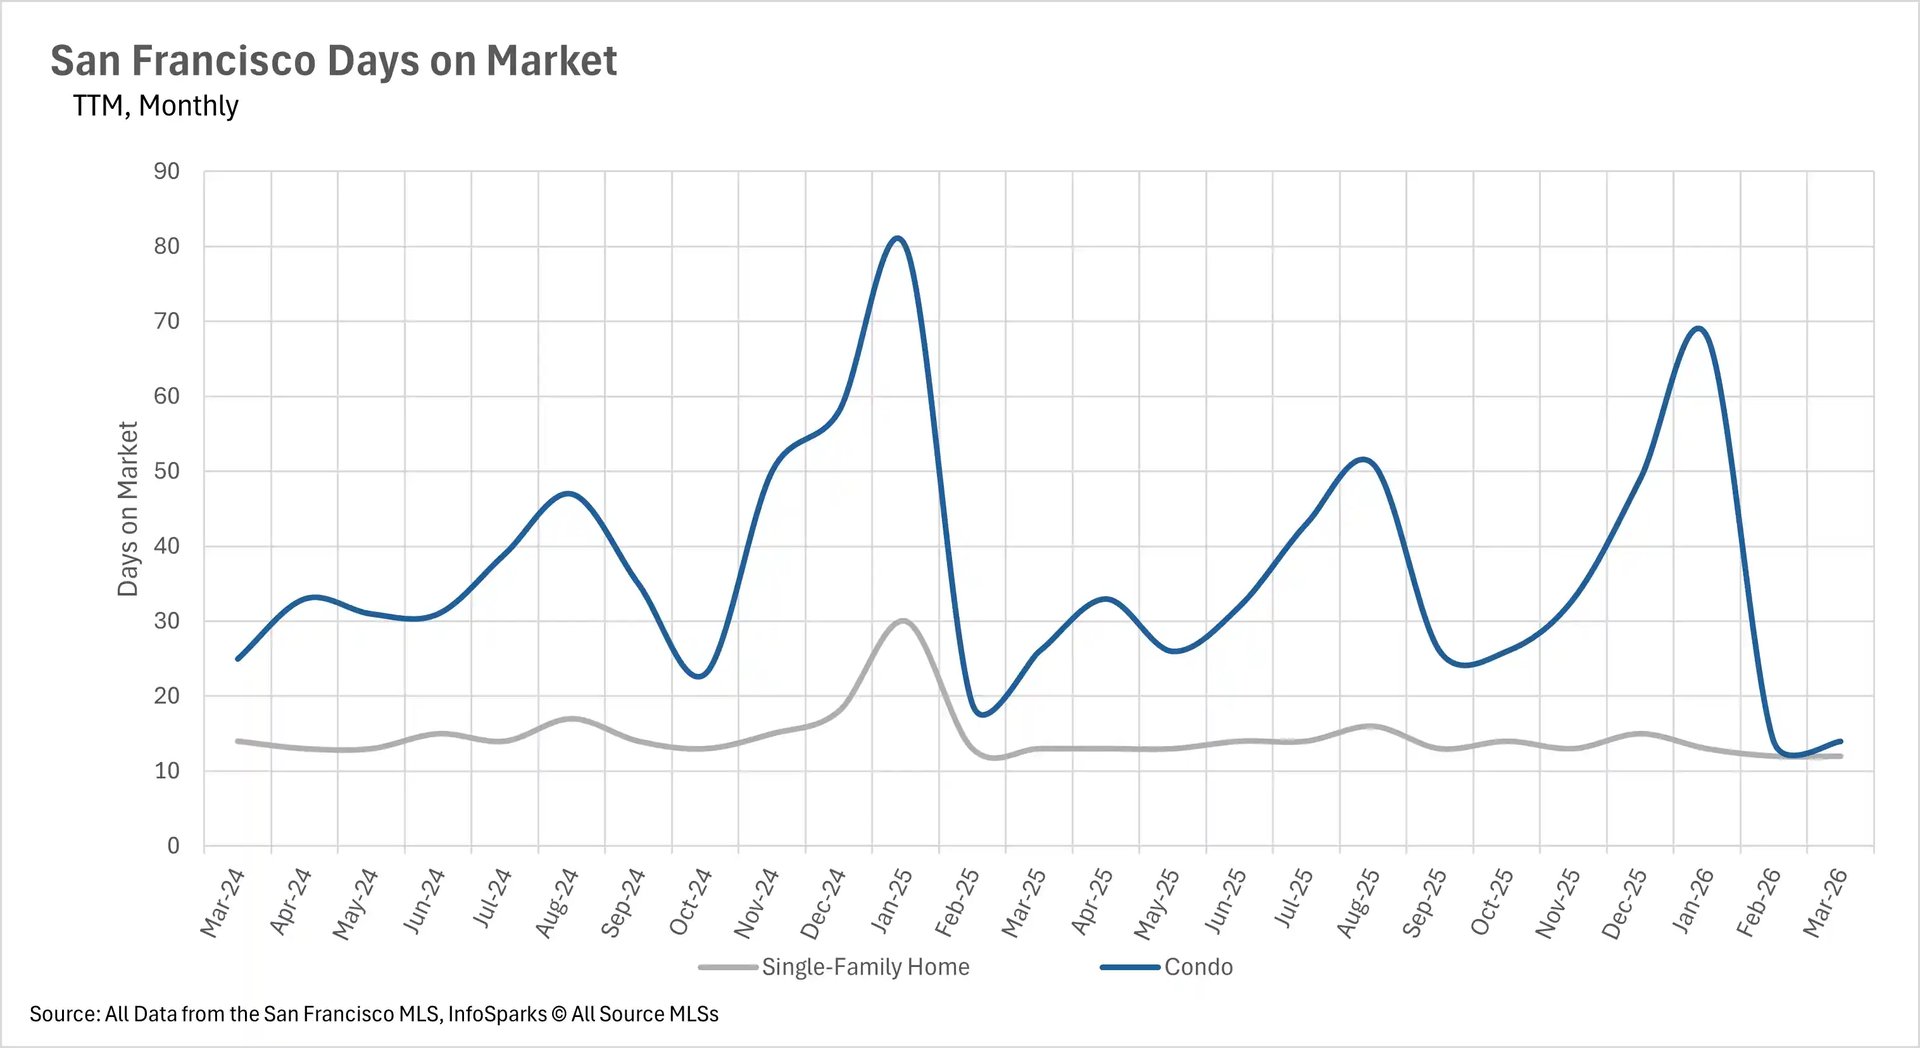
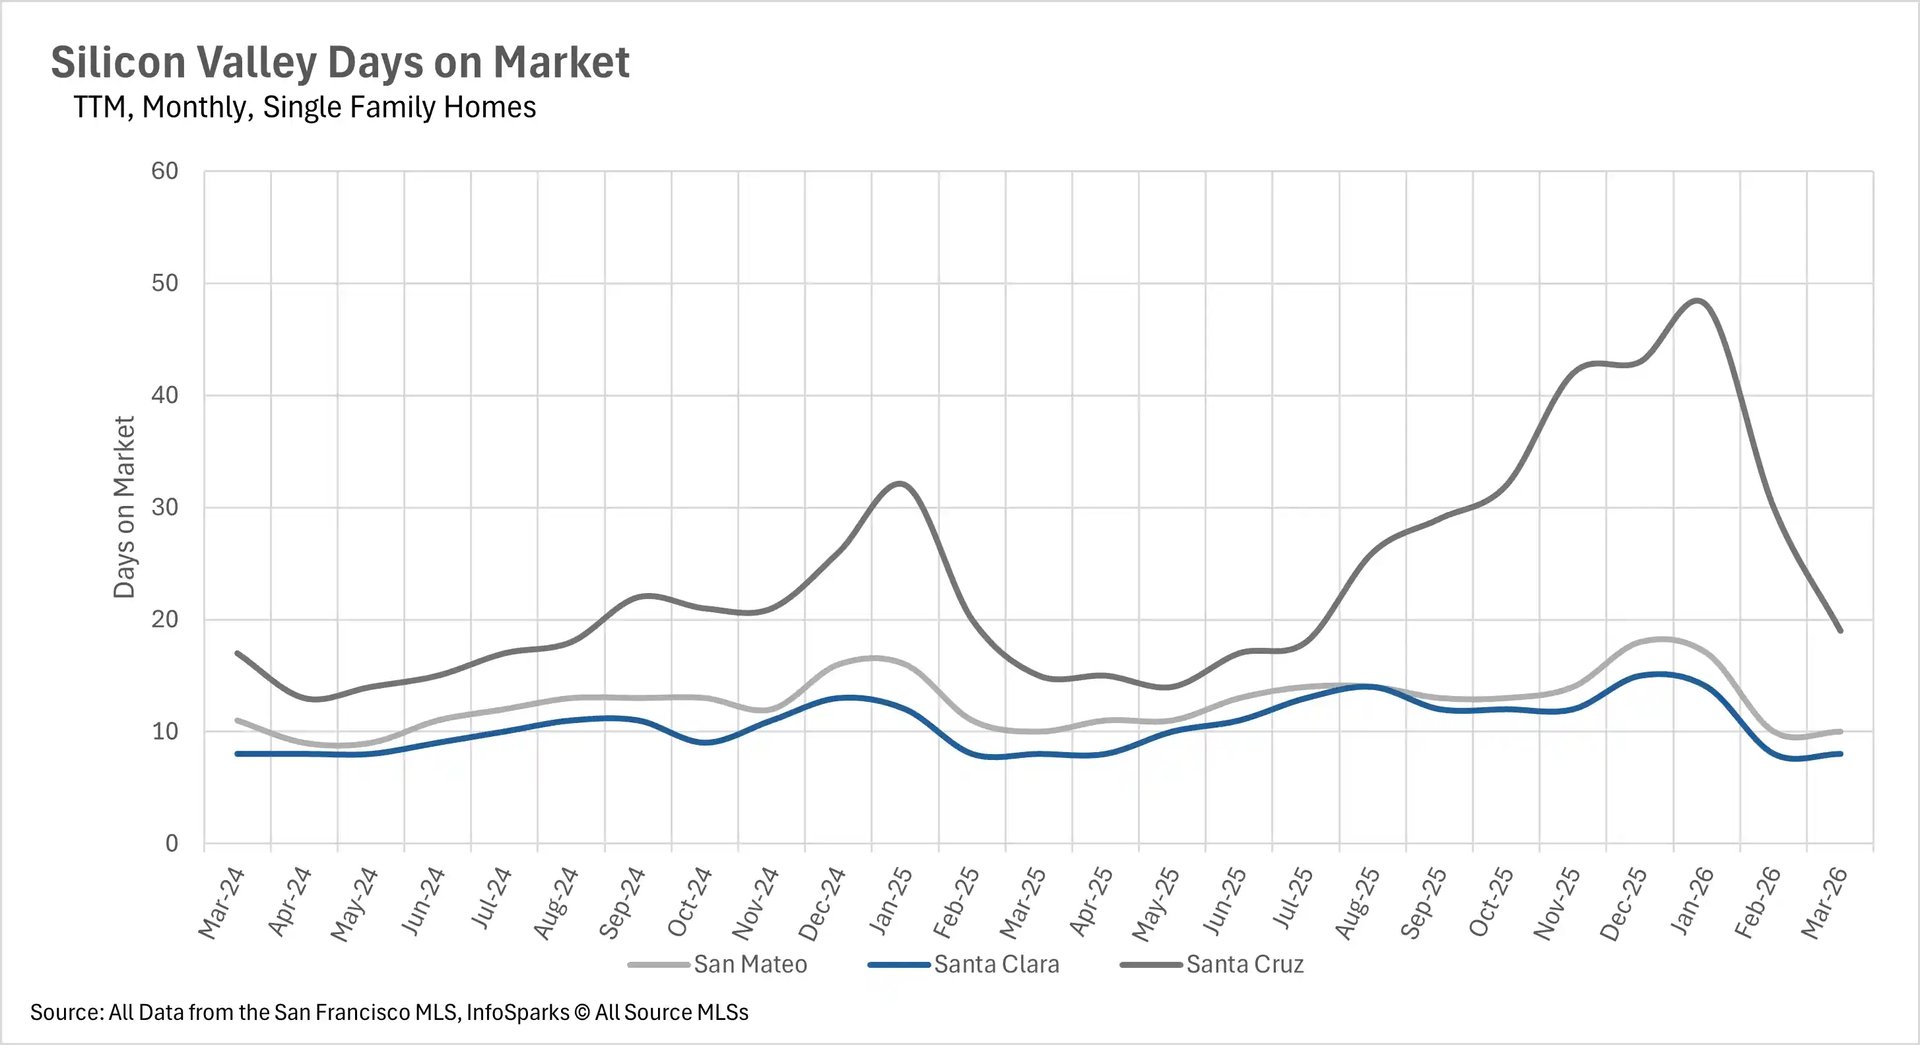
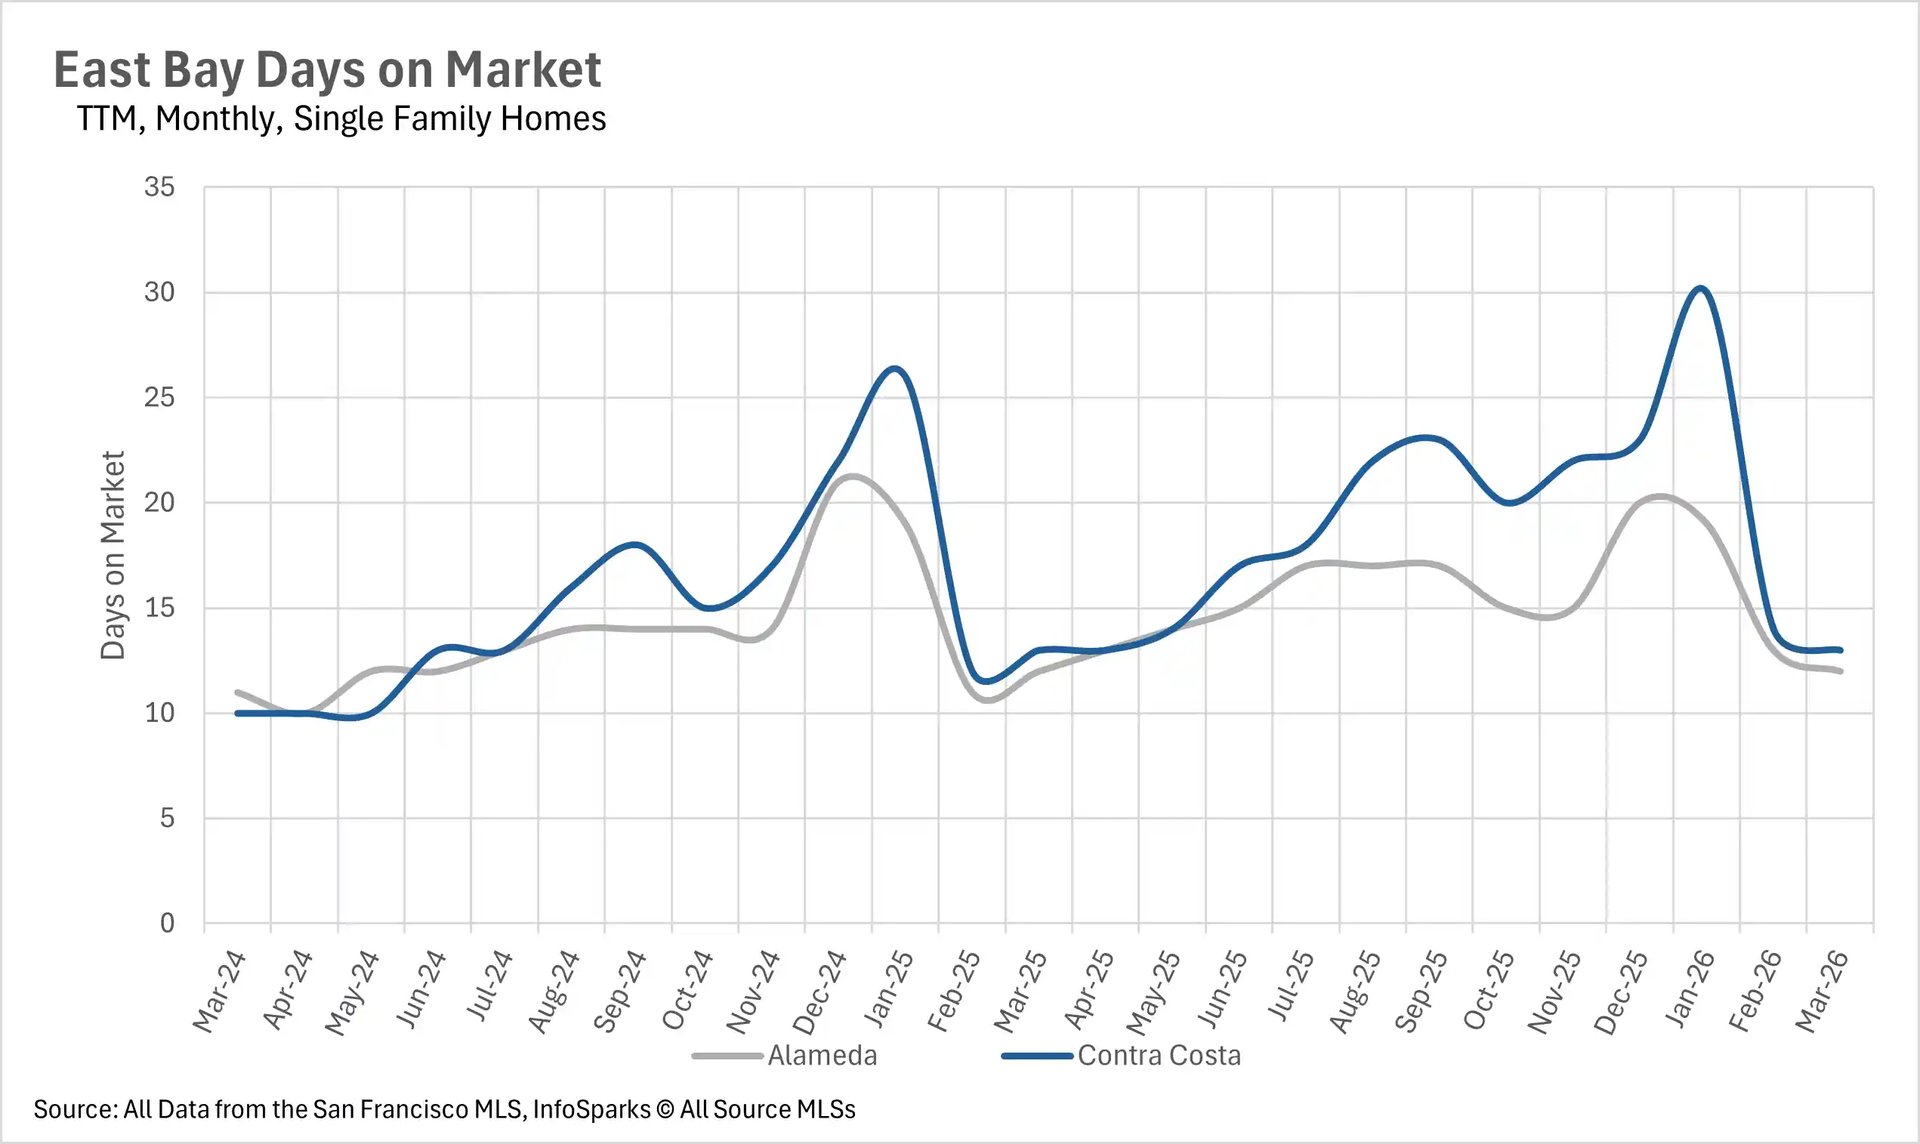
The pace of sales for single-family homes across the Bay Area is nothing short of remarkable as the spring market kicks into high gear. In Santa Clara County, the average home is selling in just 8 days, while San Mateo County homes are moving in 10 days. San Francisco single-family homes are selling in just 12 days, and East Bay listings are closing in 12 and 13 days in Alameda and Contra Costa Counties, respectively.
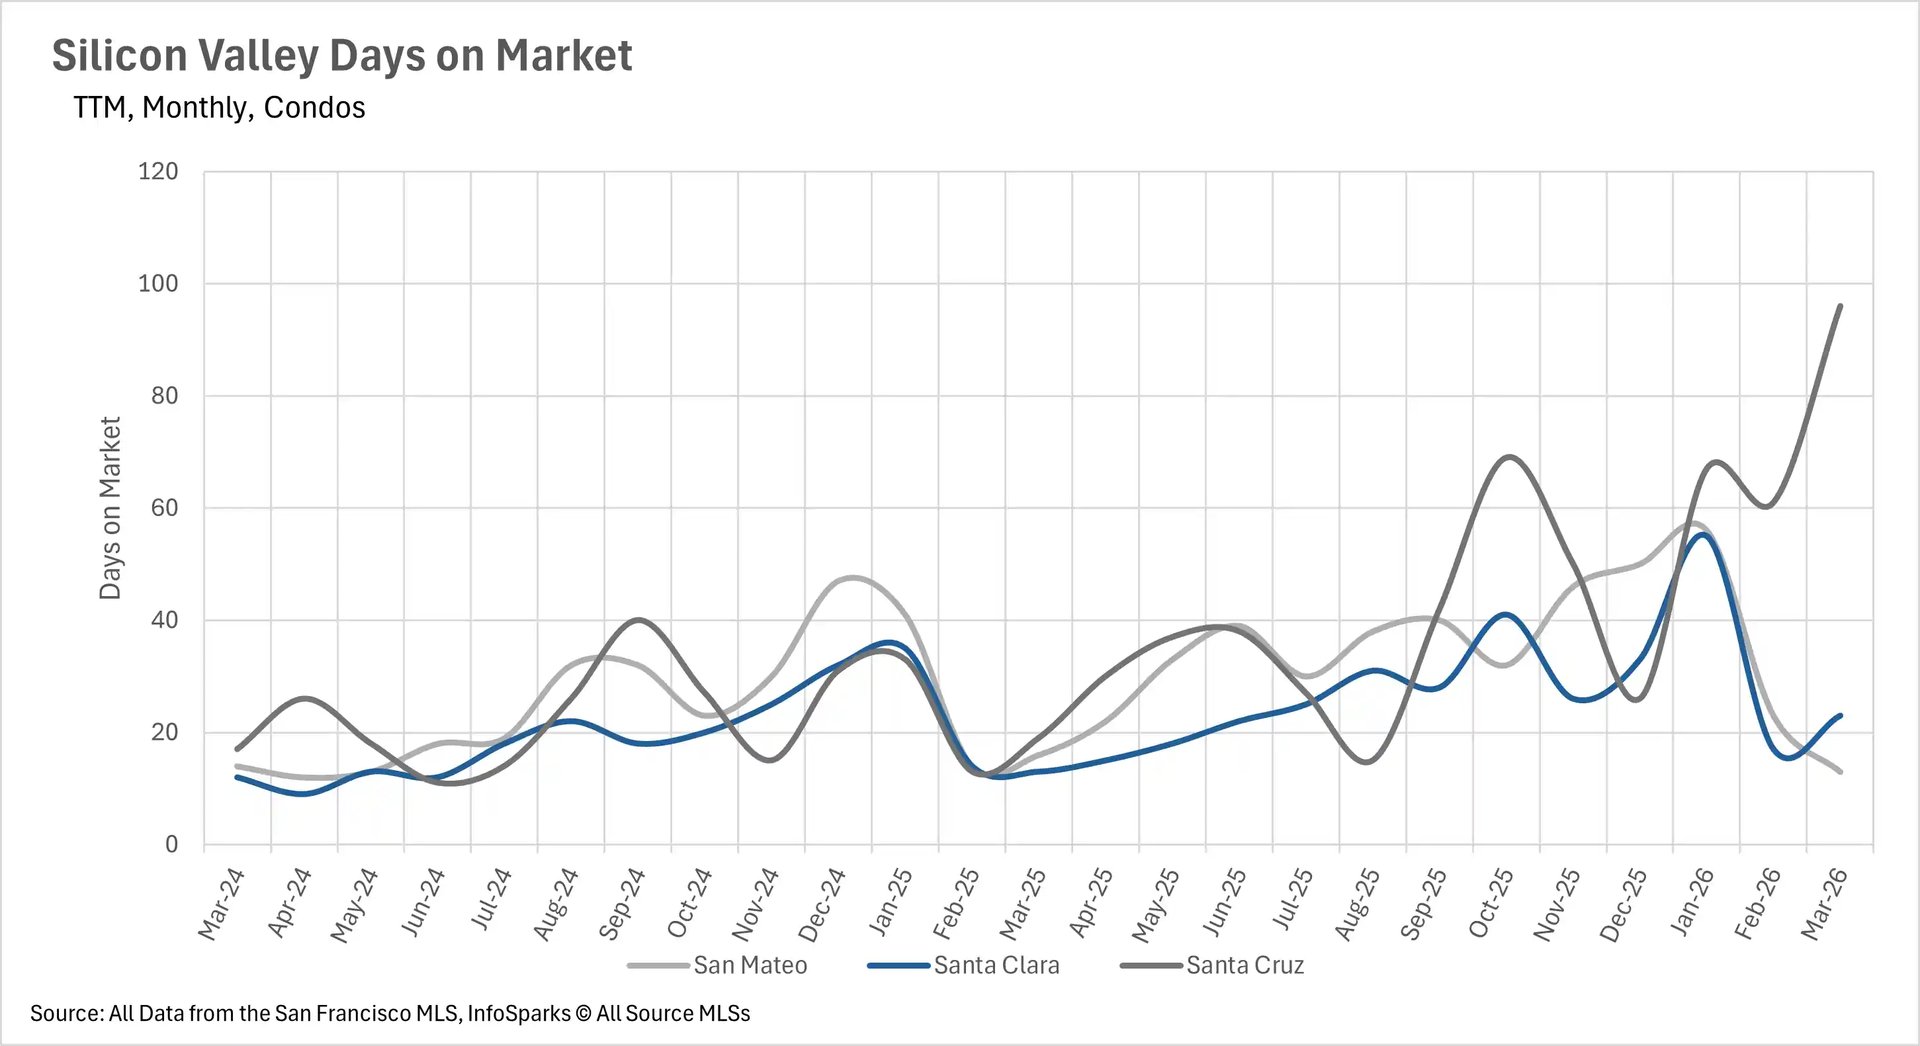
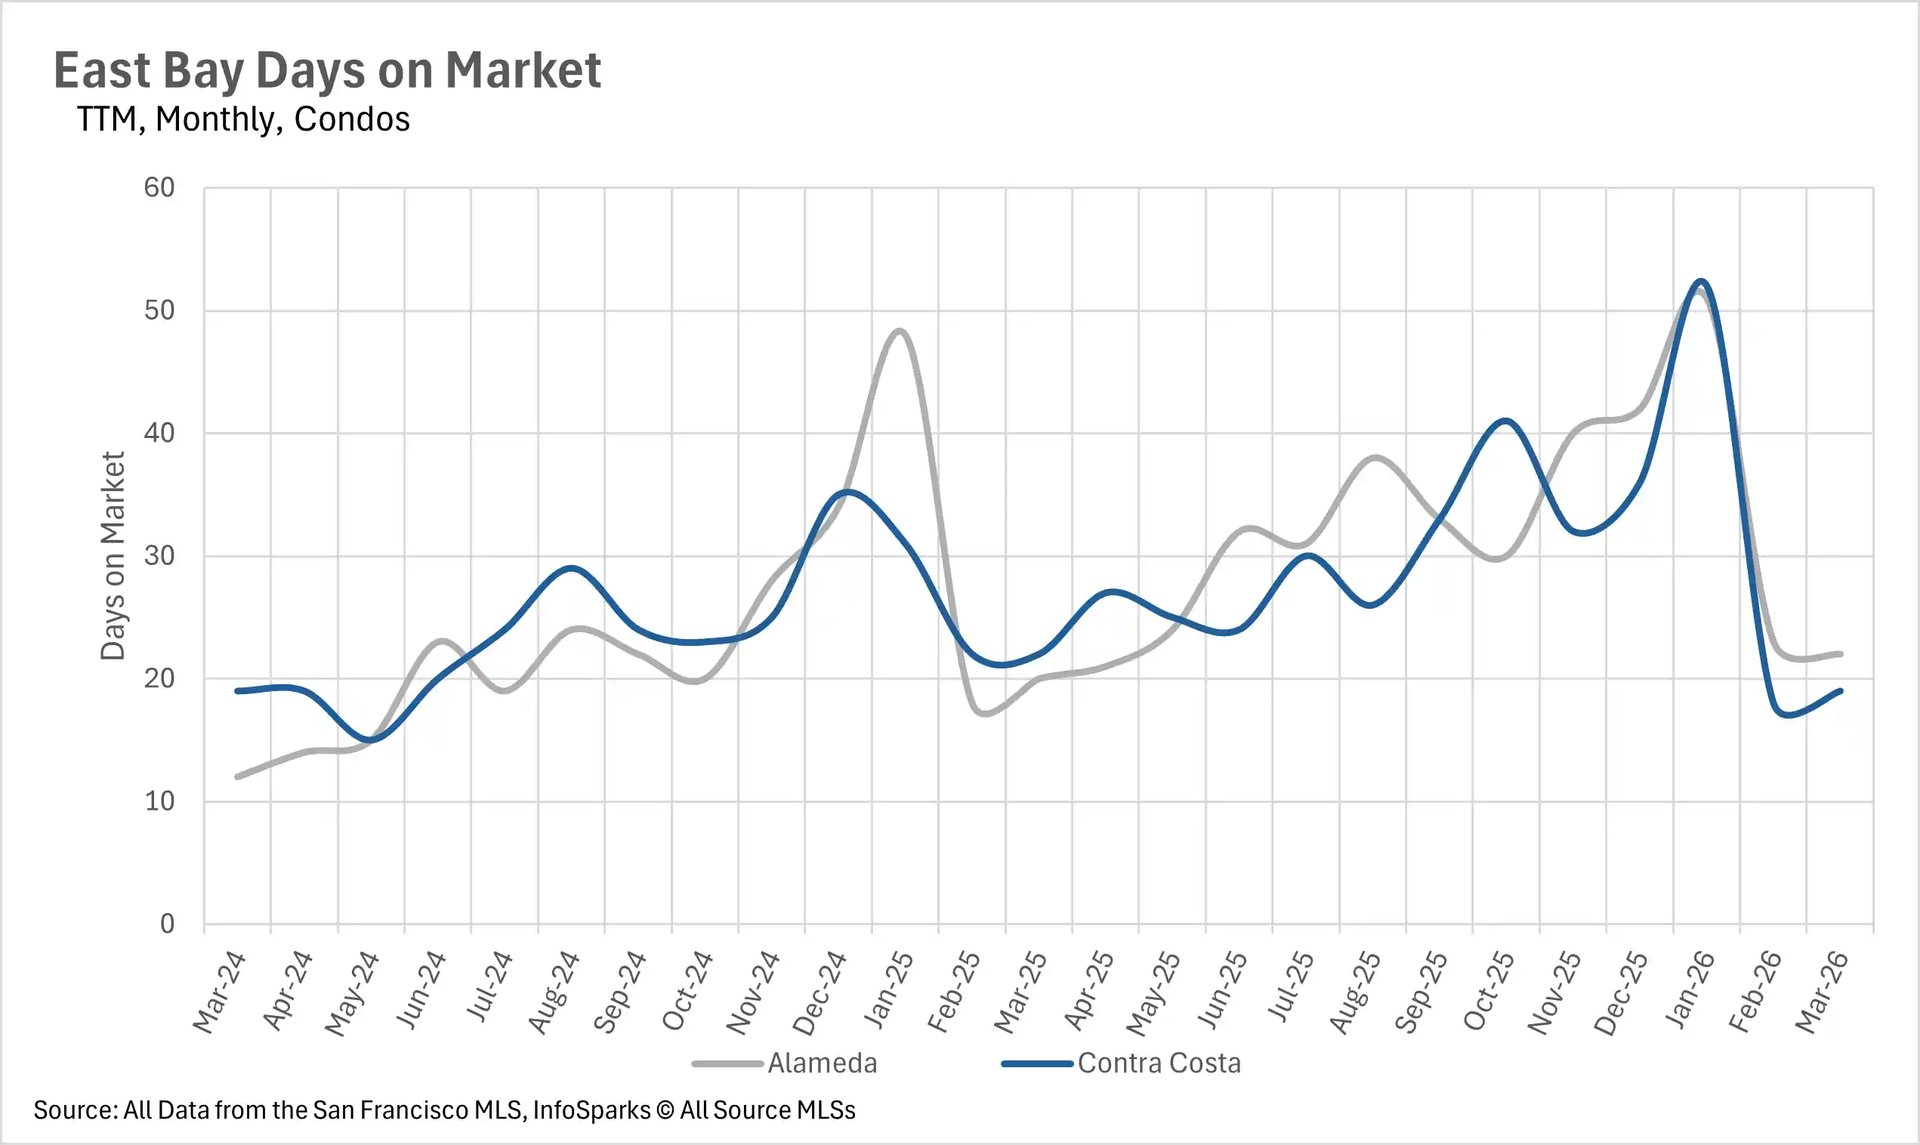
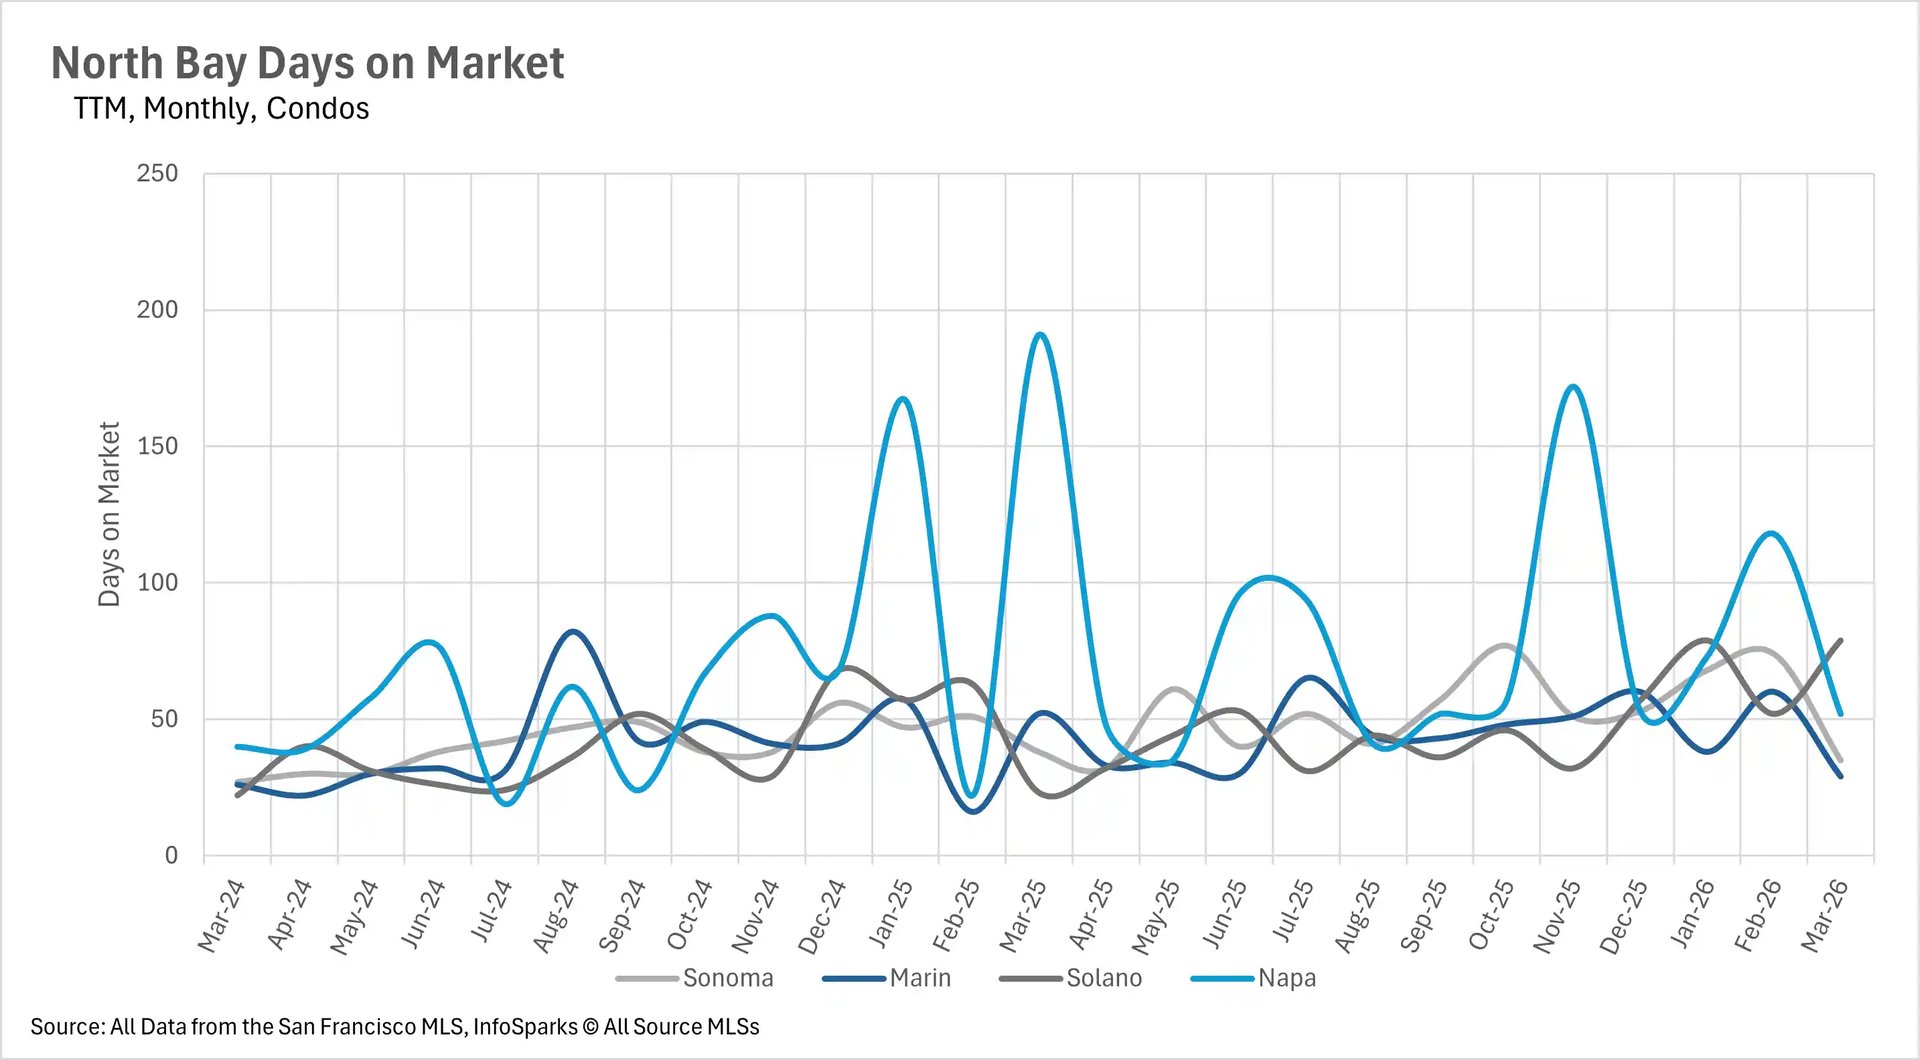
The North Bay saw dramatic month-over-month improvements, with Marin County single-family homes selling in just 15 days, down 31.82% from February, and Sonoma, Solano, and Napa Counties all posting double-digit month-over-month declines in days on market. The condo market is a more mixed picture. San Francisco condos are moving at a blistering 14-day pace, a stunning 46.15% year-over-year decline, while San Mateo County condos are also moving faster than last year. However, Santa Cruz County condos are taking an average of 96 days to sell, and Santa Clara County condos are spending 76.92% more time on the market than they were last March.
Sellers remain in the driver's seat as spring heats up
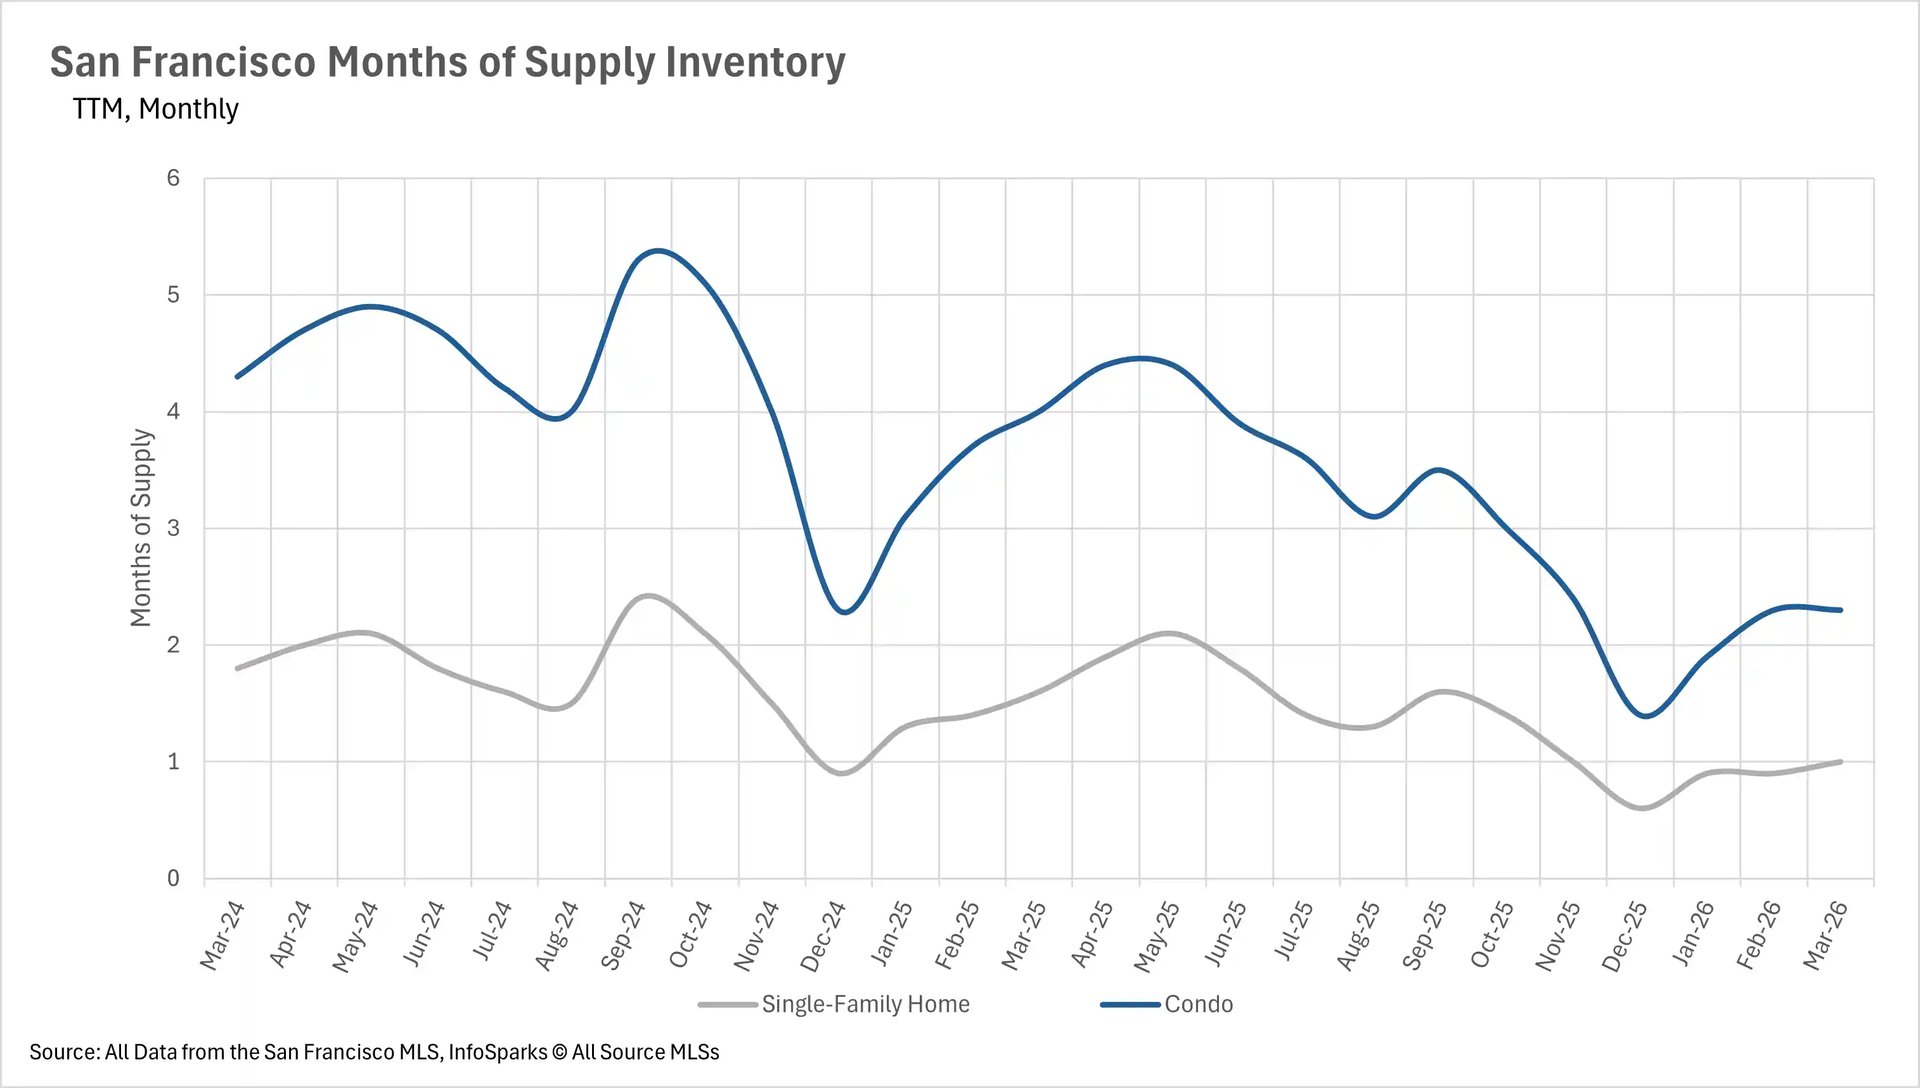
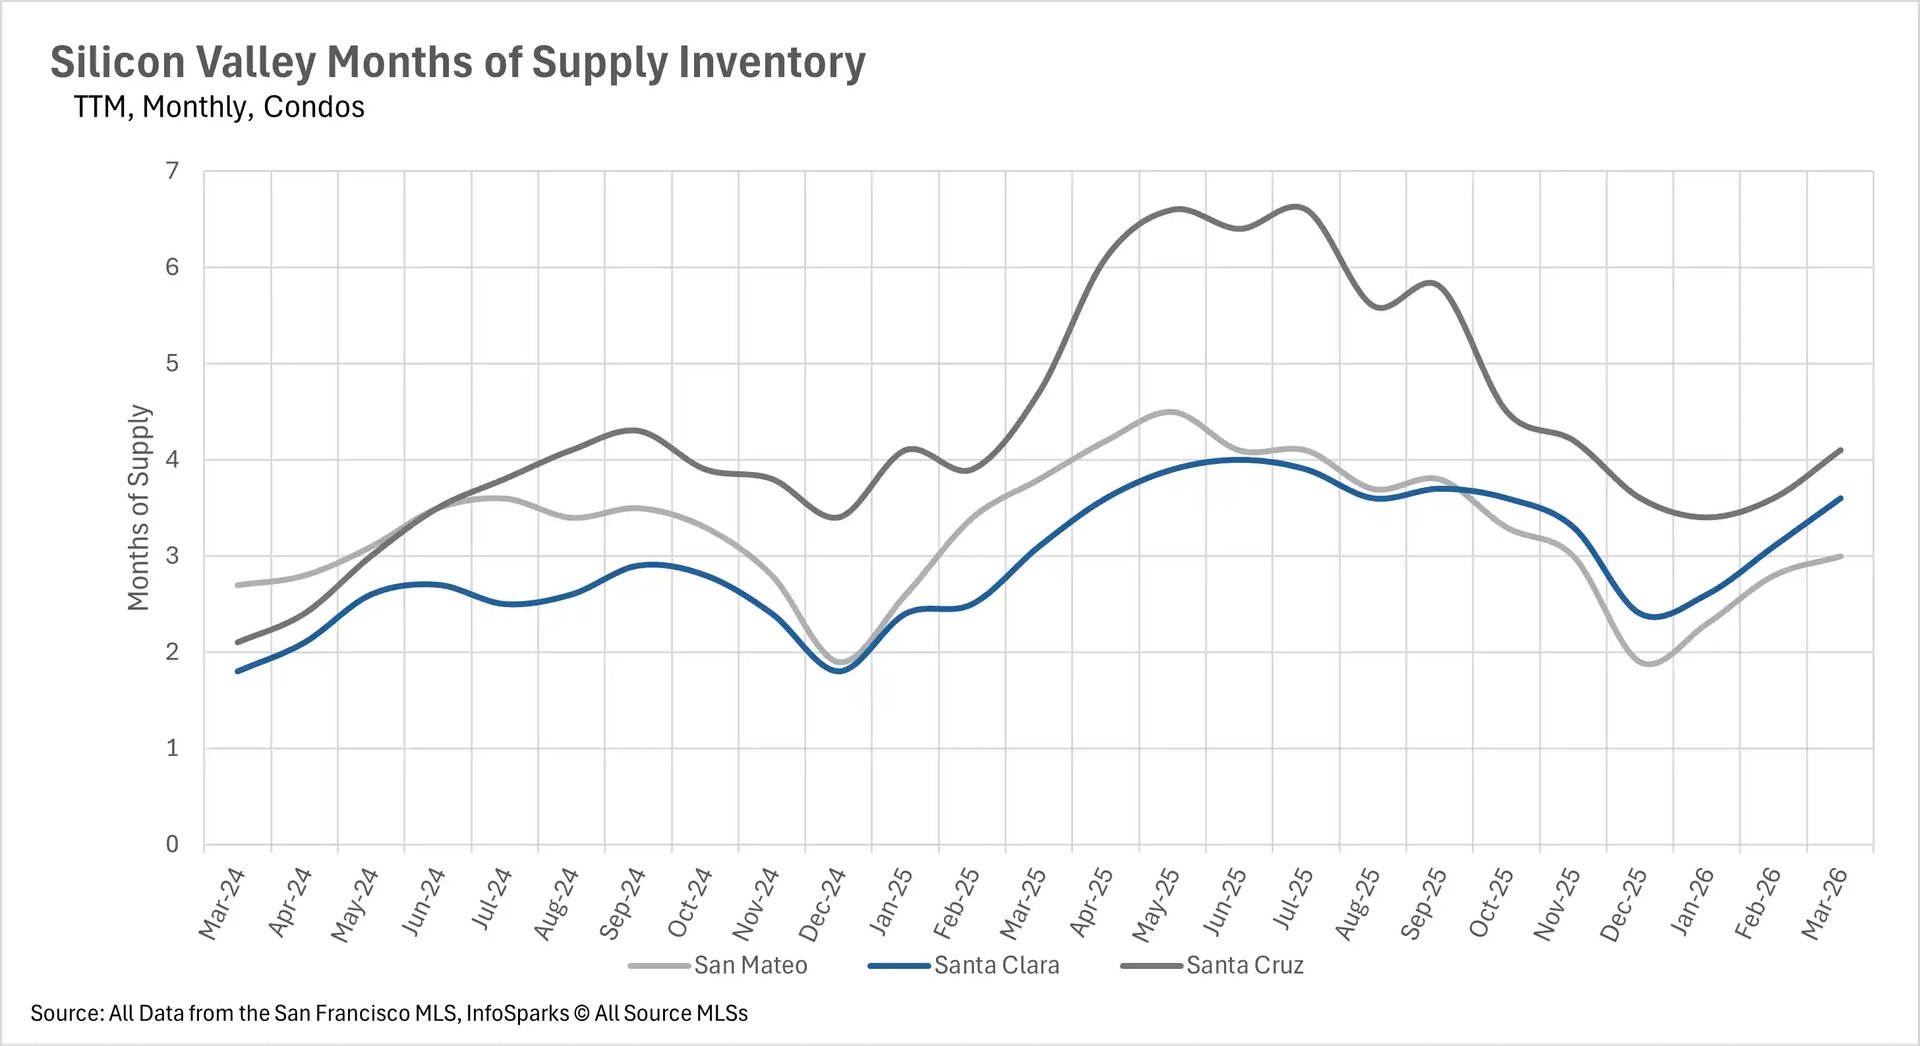
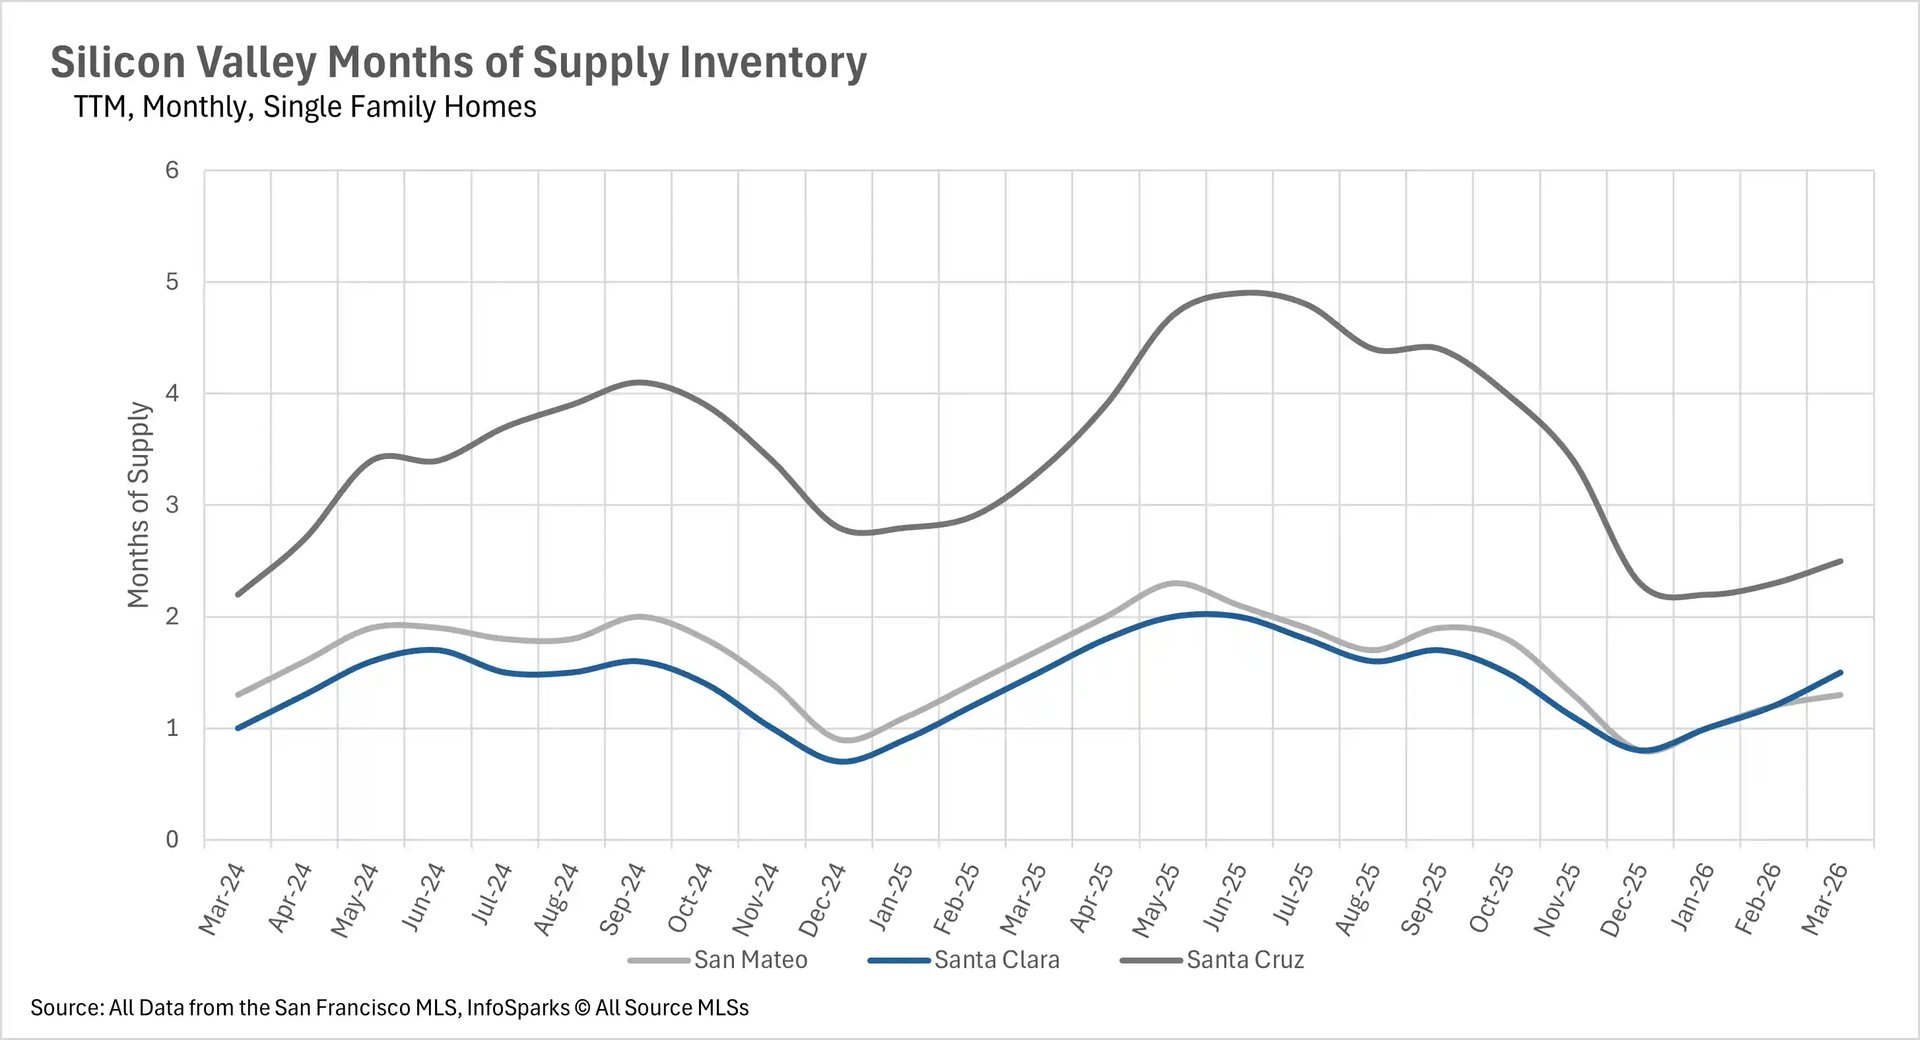
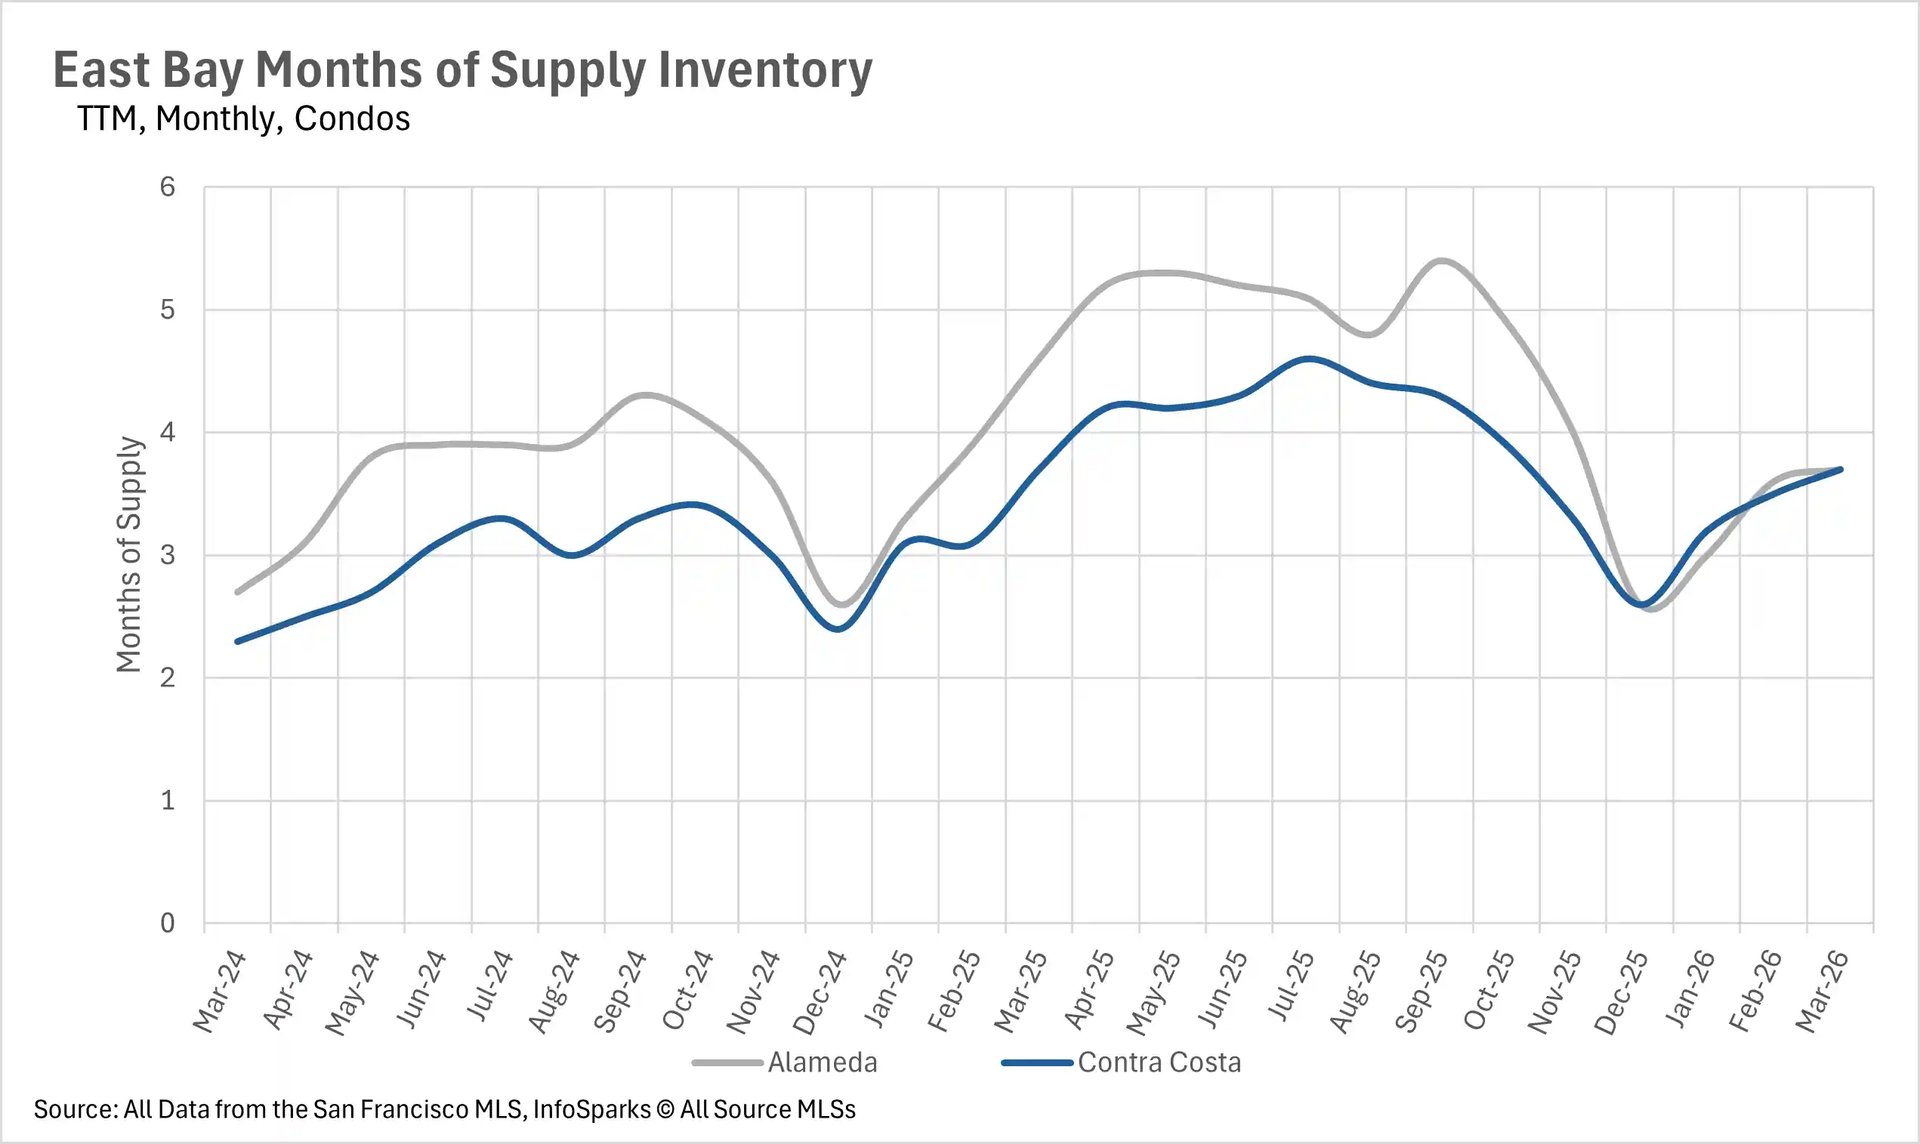
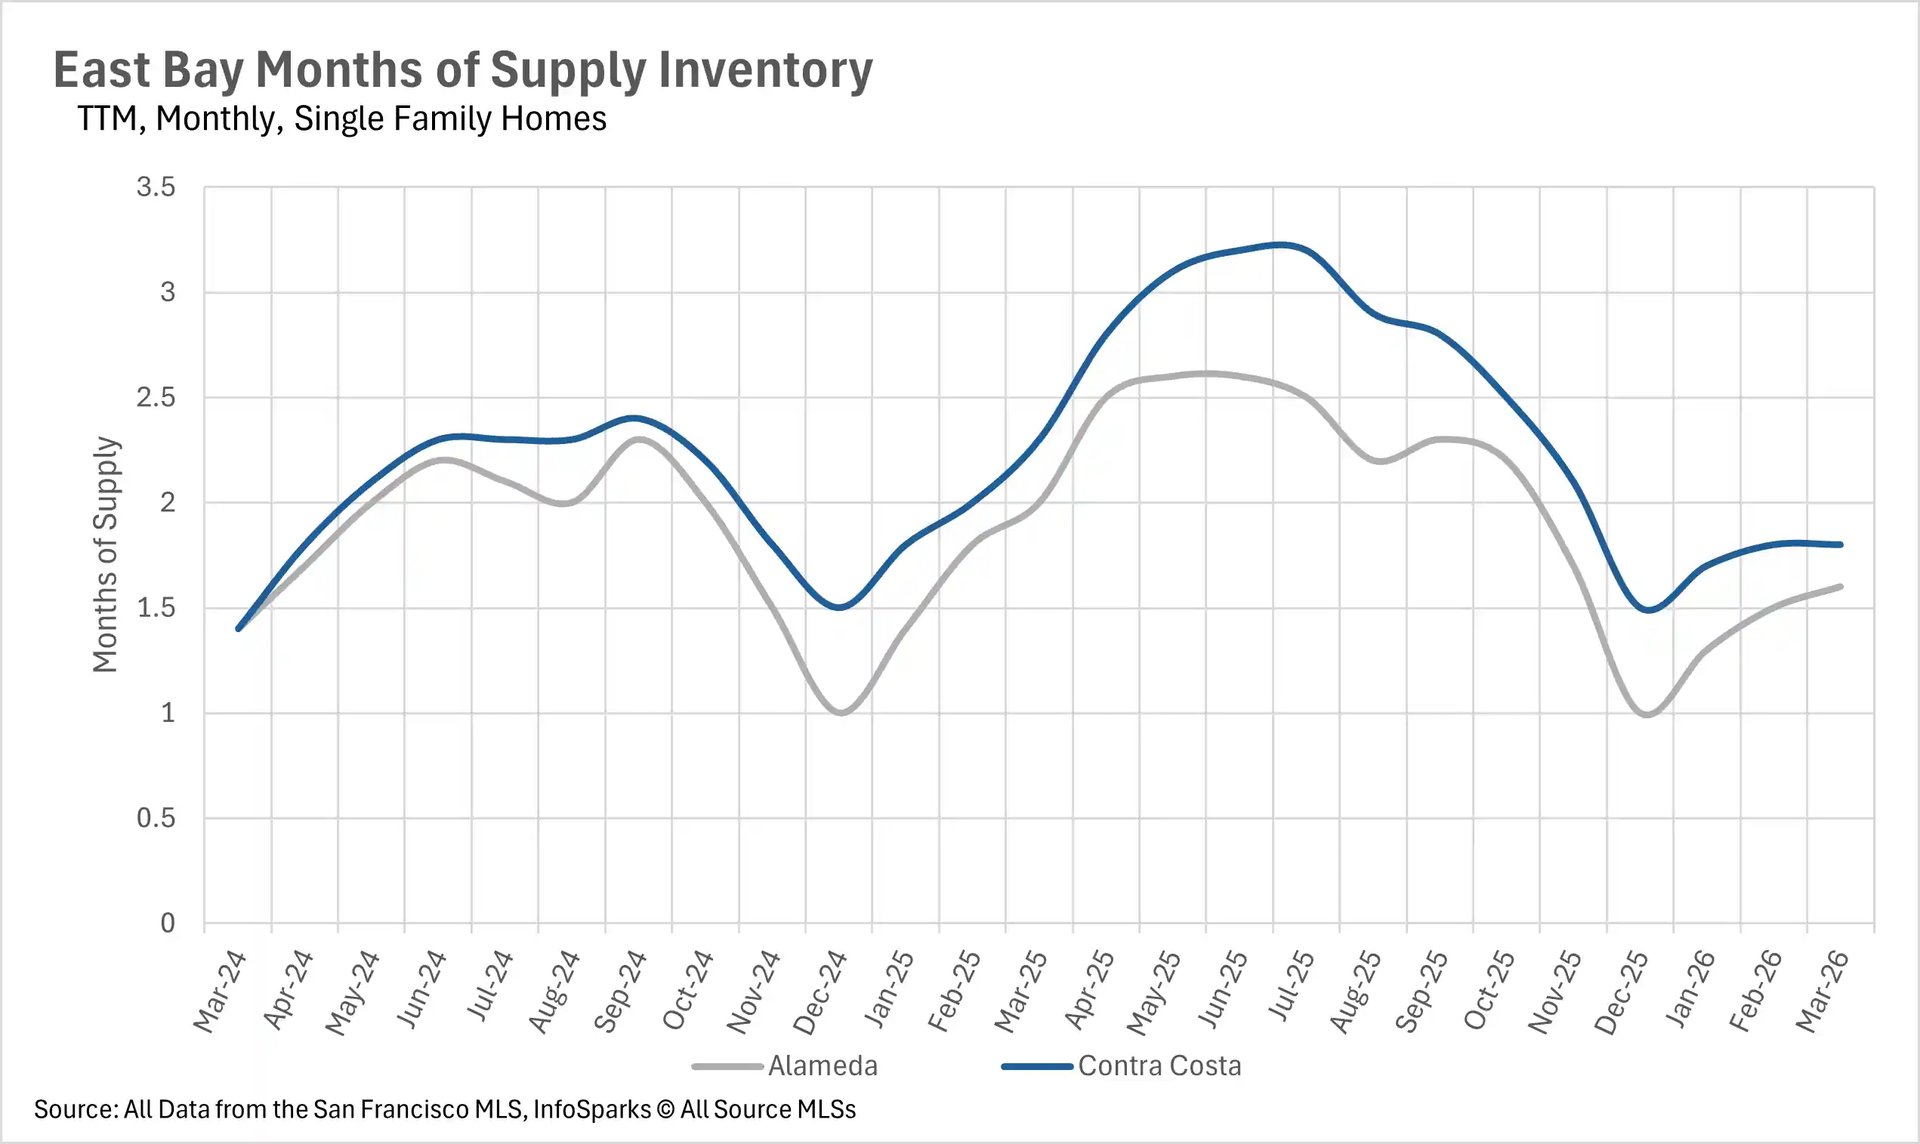
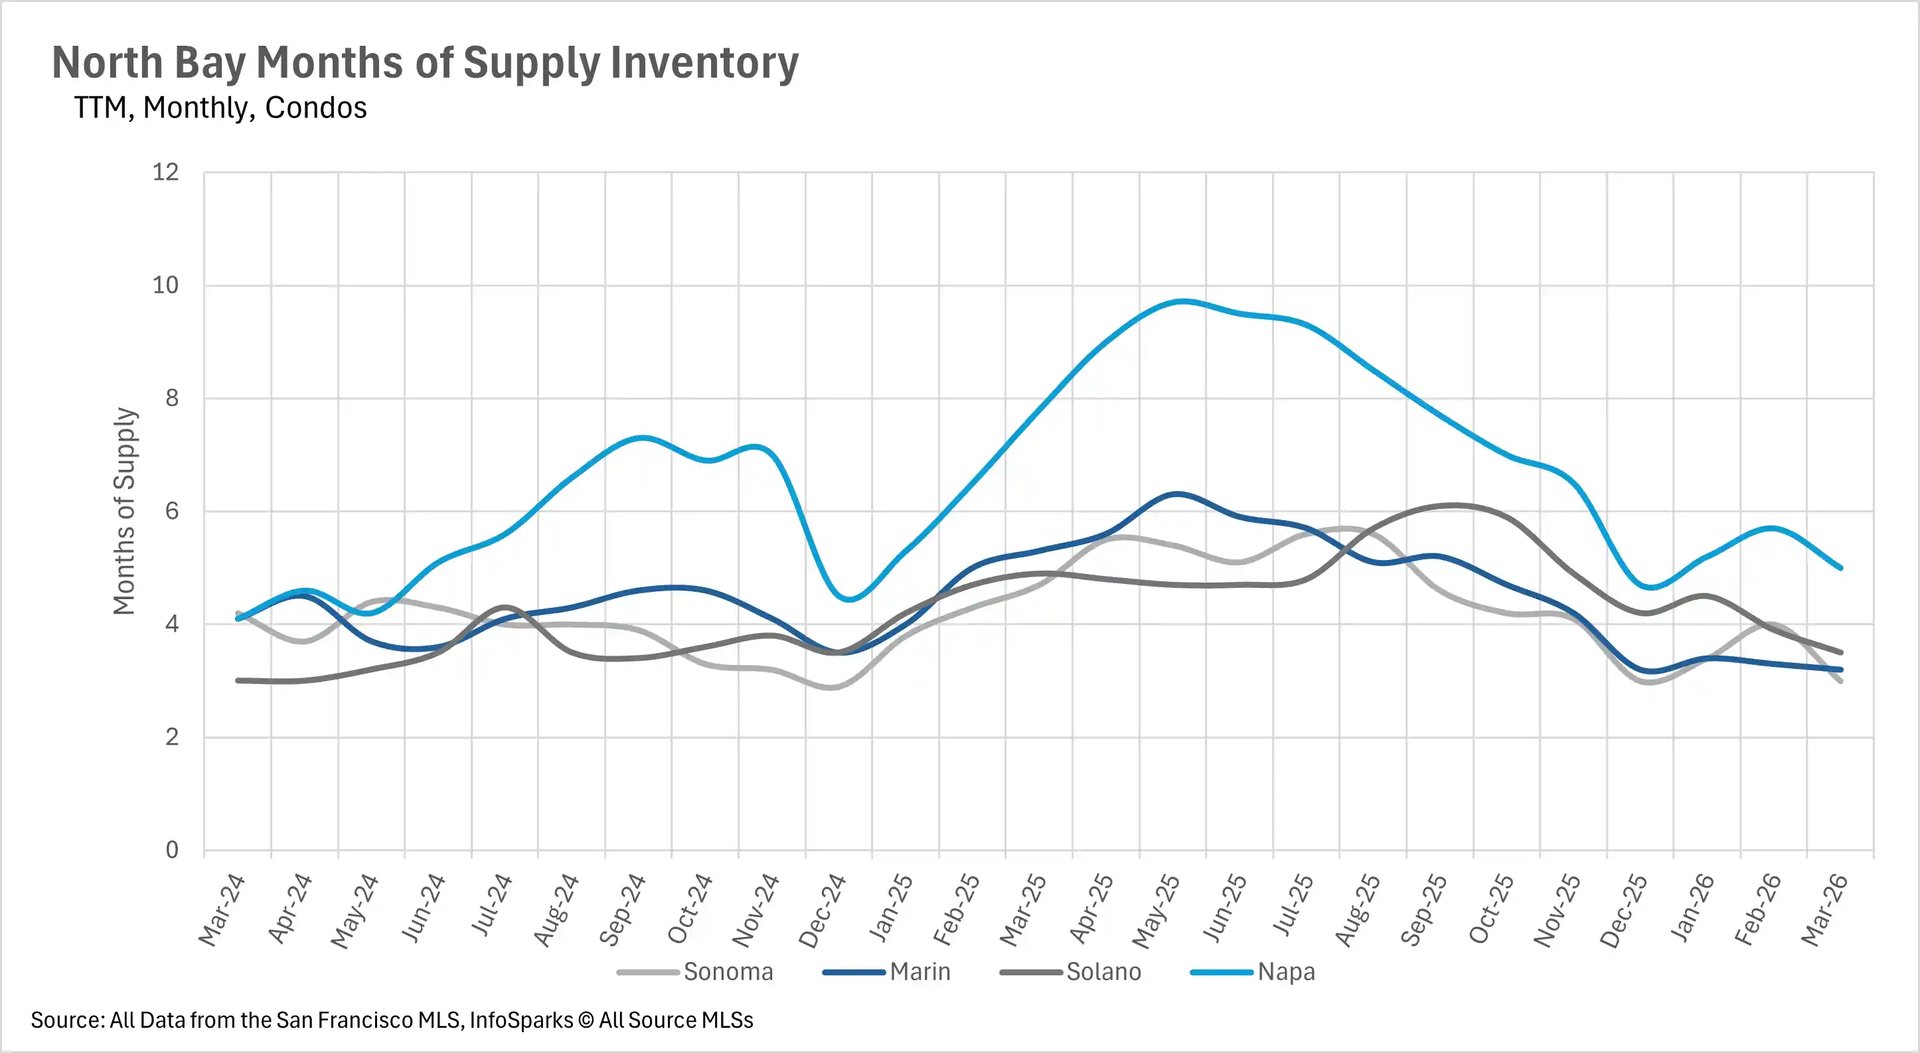
When determining whether a market is a buyers' market or a sellers' market, we look to the Months of Supply Inventory (MSI) metric. The state of California has historically averaged around three months of MSI, so any area with at or around three months of MSI is considered a balanced market. Any market that has lower than three months of MSI is considered a seller's market, whereas markets with more than three months of MSI are considered a buyers' market.
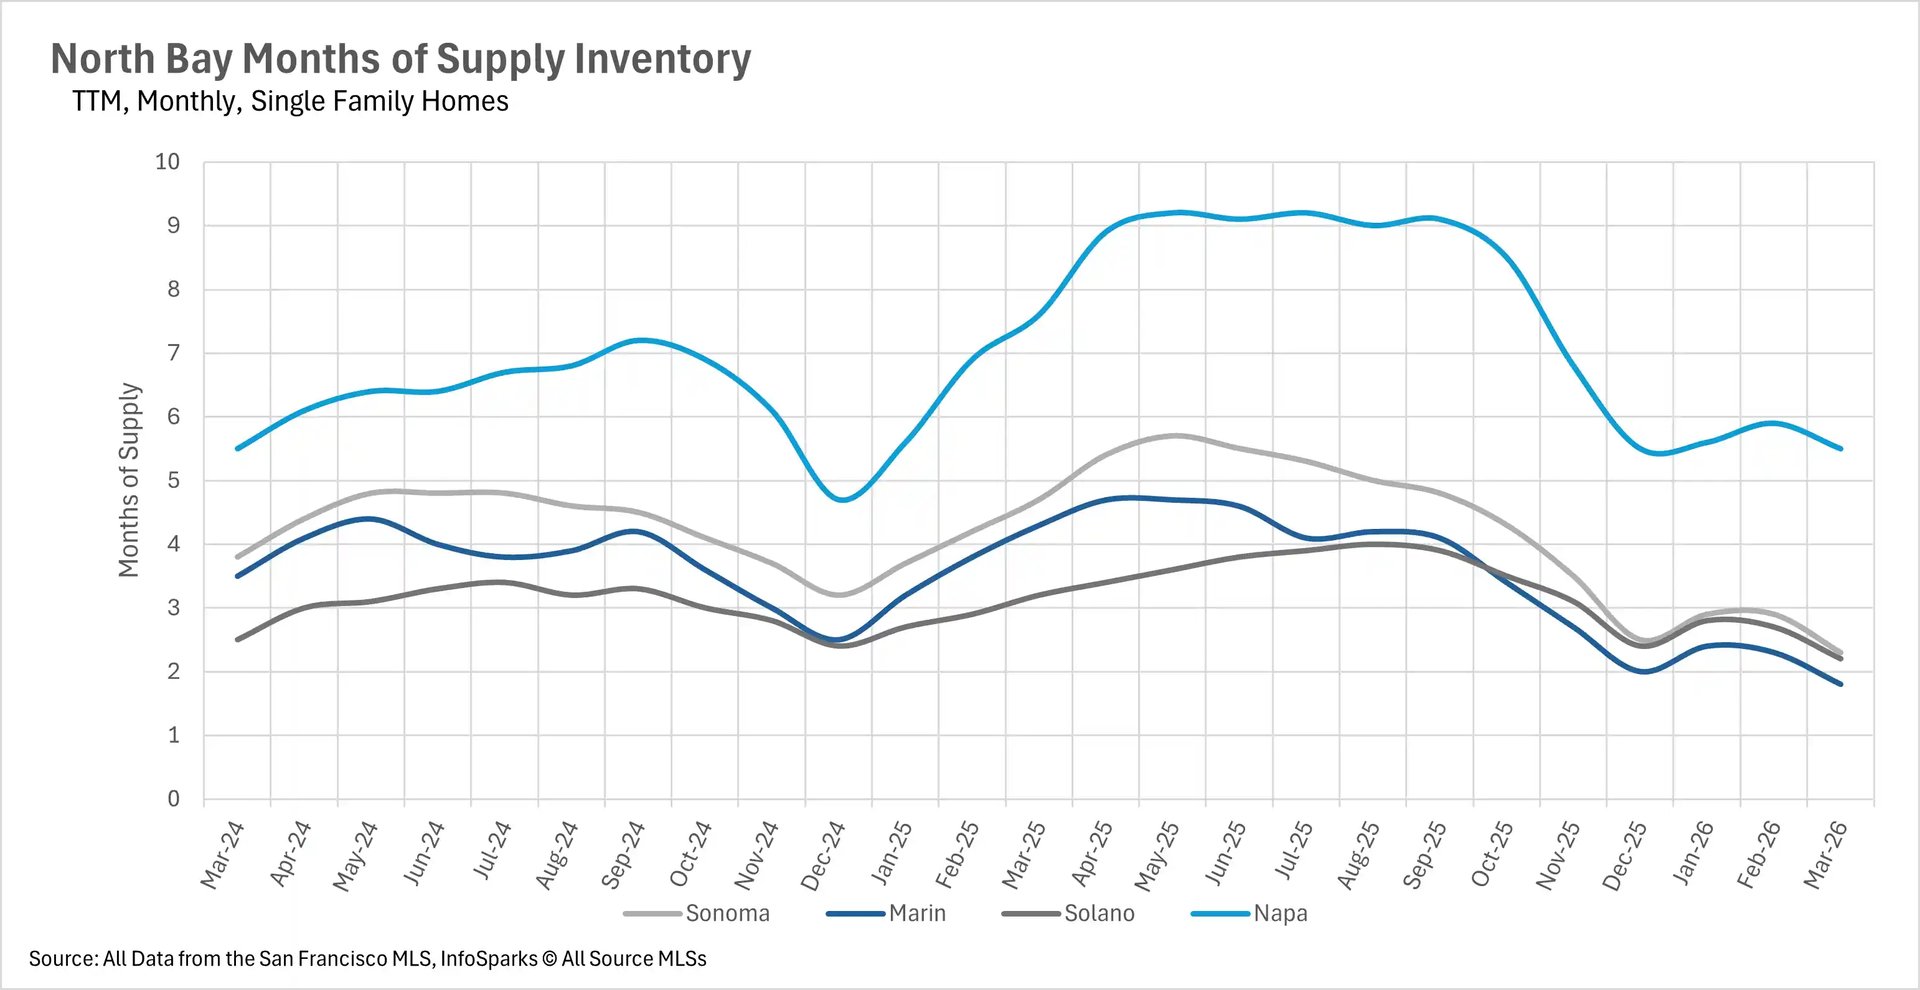
The single-family home market is firmly in seller's territory across nearly the entire Bay Area. San Francisco sits at just 1.0 months of supply, while San Mateo County has 1.3 months and Santa Clara County has 1.5 months. Alameda County has 1.6 months of supply, Contra Costa County and Marin County both sit at 1.8 months, Solano County at 2.2 months, Sonoma County at 2.3 months, and Santa Cruz County at 2.5 months. Napa County remains the lone outlier at 5.5 months, though this still represents a 27.63% year-over-year decline. The condo market continues to offer more breathing room for buyers. San Francisco has tightened dramatically to just 2.3 months of supply, shifting from a buyer's market last year to a strong seller's market today. Sonoma County sits at 3 months, San Mateo County at 3 months, Marin County at 3.2 months, Solano County at 3.5 months, Santa Clara County at 3.6 months, and both Alameda and Contra Costa Counties at 3.7 months. Santa Cruz County and Napa County round out the list at 4.1 and 5 months, respectively. With single-family inventory remaining tight across the board, sellers in that segment will continue to enjoy significant leverage as we head deeper into the spring selling season.
Local Lowdown Data