The Big Story
Mortgage rates increased in February, but their strong effect on the market may be waning
Quick Take:
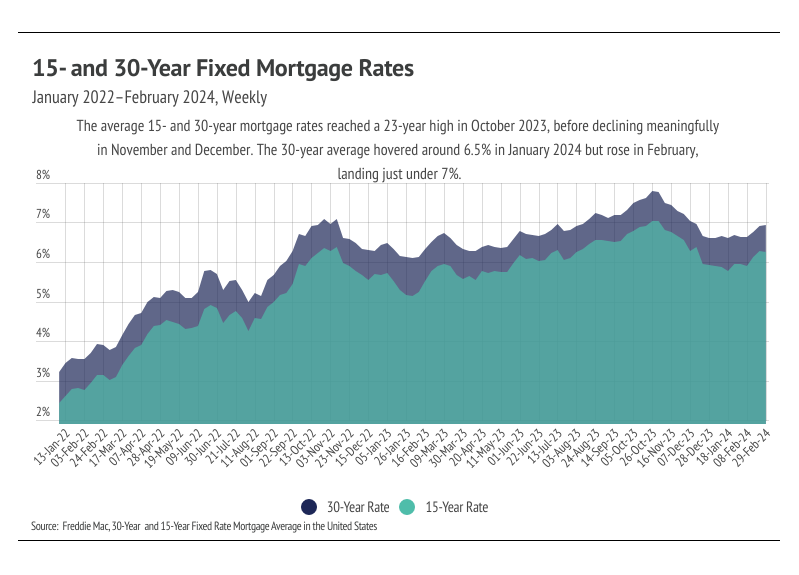
- Mortgage rates rose in February, closing the month at 6.94%. However, the Fed will almost certainly cut rates at some point this year, so potential homebuyers would only need to service the current rate level for a short period of time before refinancing.
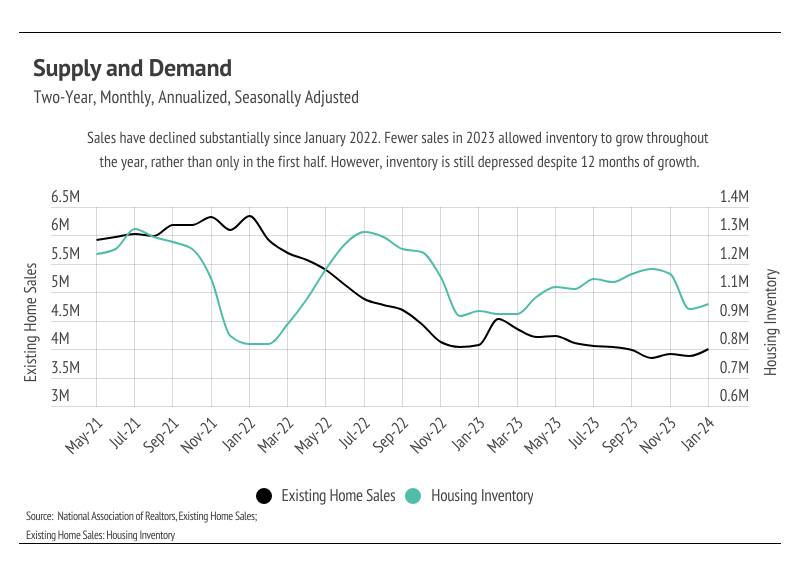
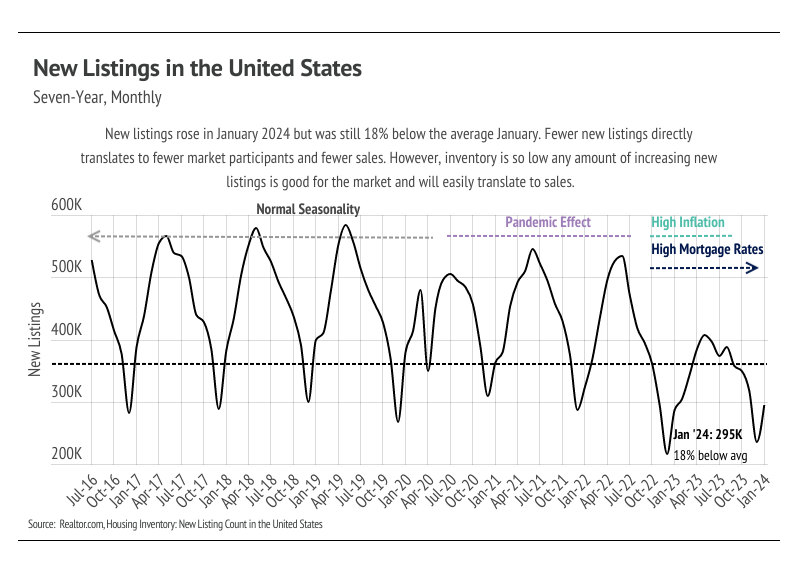
- Sales increased 3% month over month, which, although still low, is a sizable increase. More homes are coming to the market and quickly translating to more sales. Inventory increased 2%, as new listings rose by 25%. More supply and growing demand are good for the market, especially this time of year — right before the busier spring and summer seasons.
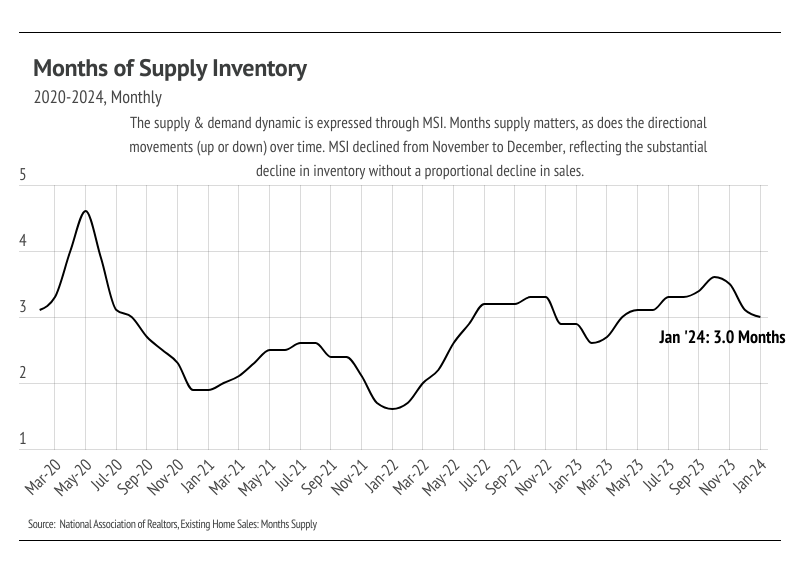
- Months of Supply Inventory (MSI), which expresses the supply & demand dynamic, fell over the past three months, indicating the market is getting more competitive for buyers.
Note: You can find the charts & graphs for the Big Story at the end of the following section.
Near-term refinancing could relieve current rate woes
On March 6, 2024, Federal Reserve Chair Jerome Powell delivered remarks before the House Financial Services Committee regarding the Fed’s stance on inflation and the likelihood of rate cuts. In short, rate cuts are coming soon but not too soon. Essentially, the Fed is waiting for more positive inflation data before cutting rates, and cuts will almost certainly come sometime this year. At the start of the year, financial markets were speculating that rate cuts would begin after the Fed’s March meeting, but, with the information from Mr. Powell, we are now expecting rate reductions after the June or July Fed meetings. The Feds strategy makes sense: the benefits of waiting for more information outweigh the potentially negative effects of cutting rates in March only to raise them again in June. The Fed’s dual mandate aims for stable prices (inflation ~2%) and low unemployment. Employment is solid with unemployment at 3.9%, and the February jobs report showed that the labor market added 275,000 non-farm payroll jobs, considerably beating analyst expectations of 200,000. Unless something truly disastrous happens in the labor market, inflation is the primary factor in the Fed’s decision making in the first half of 2024.
The good news for the housing market is that potential home buyers and sellers have a much clearer picture of where rates will go in the next 12 months. The bad news is that rates likely won’t meaningfully decrease until after what is traditionally the most active time in the housing market (March to August). However, because we know there is a high probability of mortgage rates declining this year, home buyers could easily decide to buy now and refinance in the near future. The average 30-year mortgage rate has been above 6% since September 2022, and the housing market has been slower, especially on the selling side, which of course feeds into the buying side, since buyers can’t purchase what's not for sale. The rate-induced market slowdown has given potential buyers more time for a down payment. Many buyers were priced out of the market in the second half of 2022 but have now had over a year to save more money for a down payment. Buyers and sellers are also a little more accustomed to higher rates so aren’t as emotionally tied to the sub-3% mortgage rates seen in 2020 and 2021. We expect the market to heat up more than it did last year because of these factors and aren't so worried about buyer demand because it’s high relative to supply so more sellers could definitely come to the market.
Different regions and individual houses vary from the broad national trends, so we’ve included a Local Lowdown below to provide you with in-depth coverage for your area. In general, higher priced regions (the West and Northeast) have been hit harder by mortgage rate hikes than less expensive markets (the South and Midwest) because of the absolute dollar cost of the rate hikes and limited ability to build new homes. As always, we will continue to monitor the housing and economic markets to best guide you in buying or selling your home.
Big Story Data
The Local Lowdown
Quick Take:
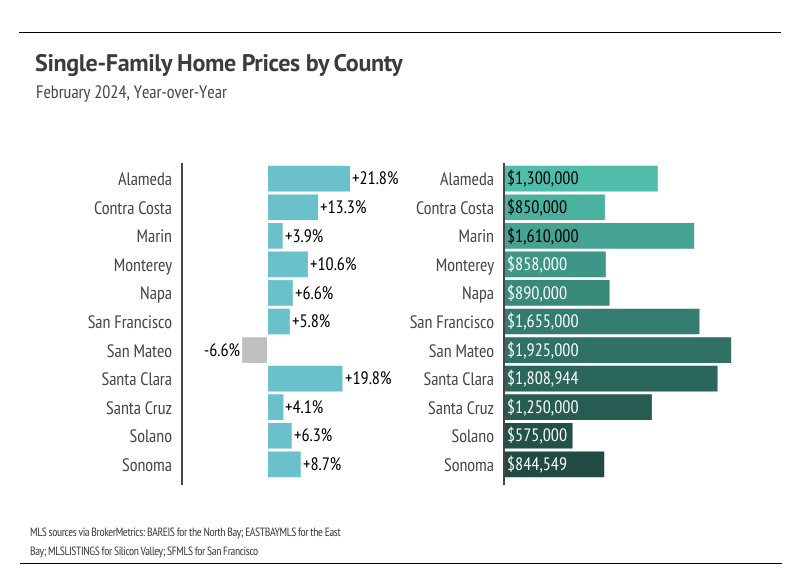
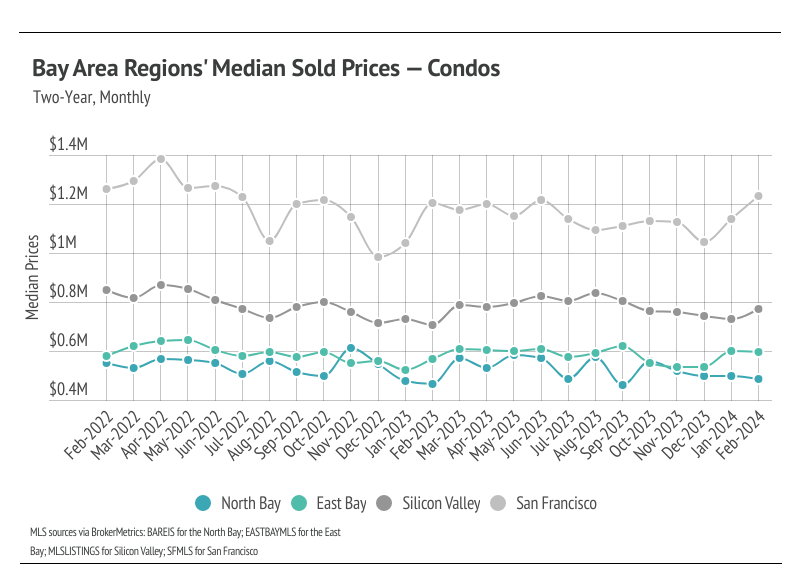
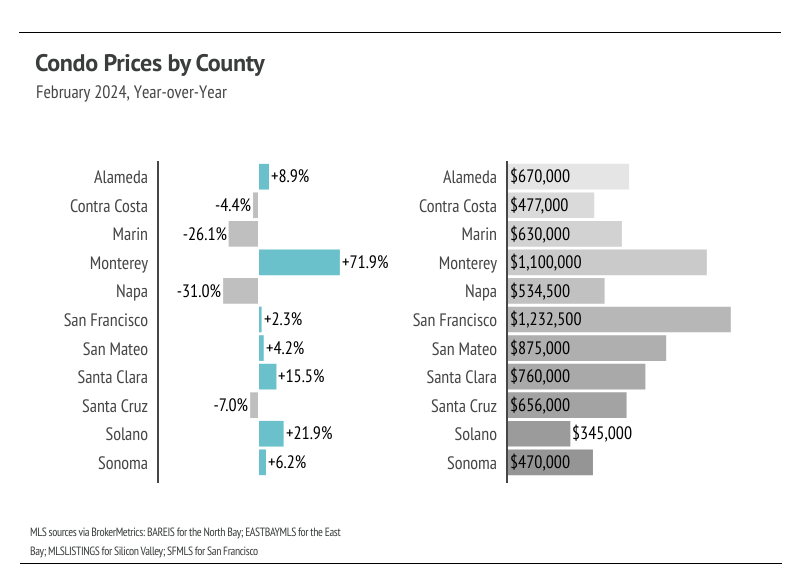
- Year over year, the median single-family home and condo prices rose across most Bay Area counties in February. Low inventory and high mortgage rates have been the market’s driving factors, but with rate cut expectations in the near future, we expect more buyers and sellers to come to the market in the spring as mortgage rates decline further.
- Active listings, sales, and new listings rose in the Bay Area month over month, which are all beneficial for the housing market, with the exception of San Francisco inventory, which hit a record low level. We expect inventory to increase in the first half of the year and possibly return to a more normal market after the slowdown experienced over the past year and a half.
- Months of Supply Inventory fell in February 2024, as sales increased and homes sold at a faster pace. Currently, MSI indicates a sellers’ market in most of the Bay Area.
Note: You can find the charts/graphs for the Local Lowdown at the end of this section.
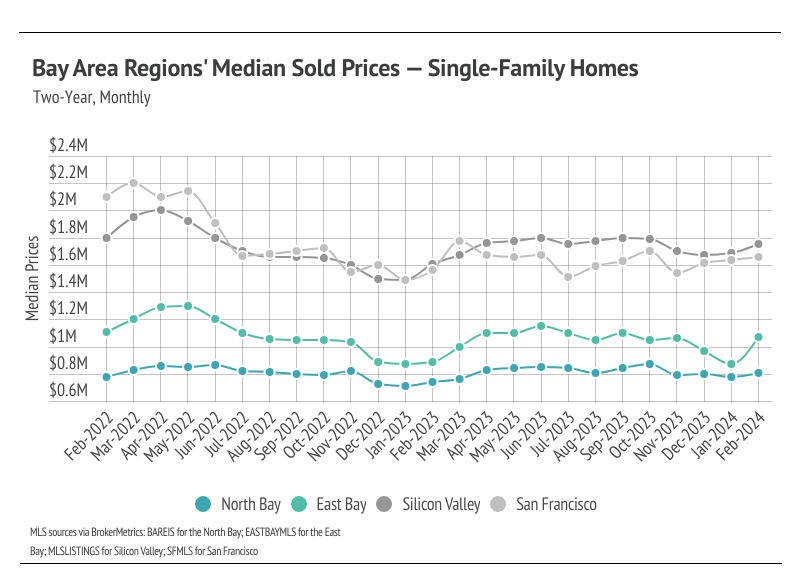
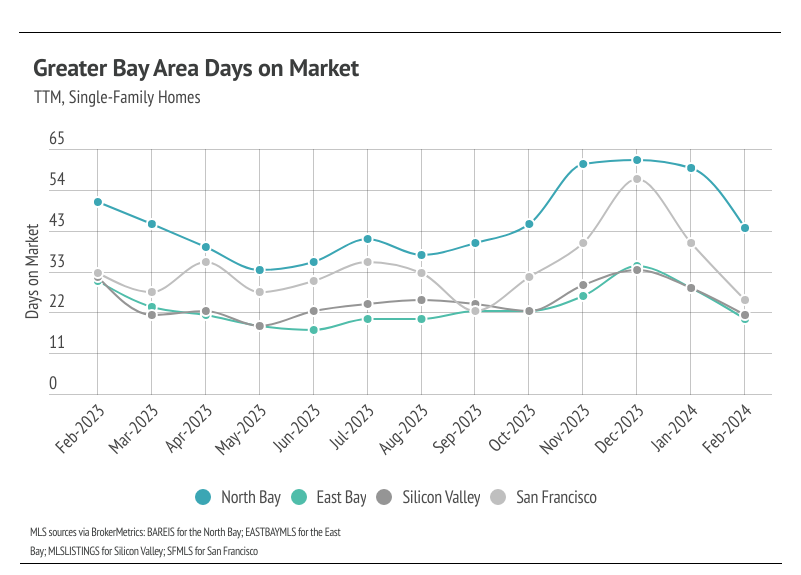
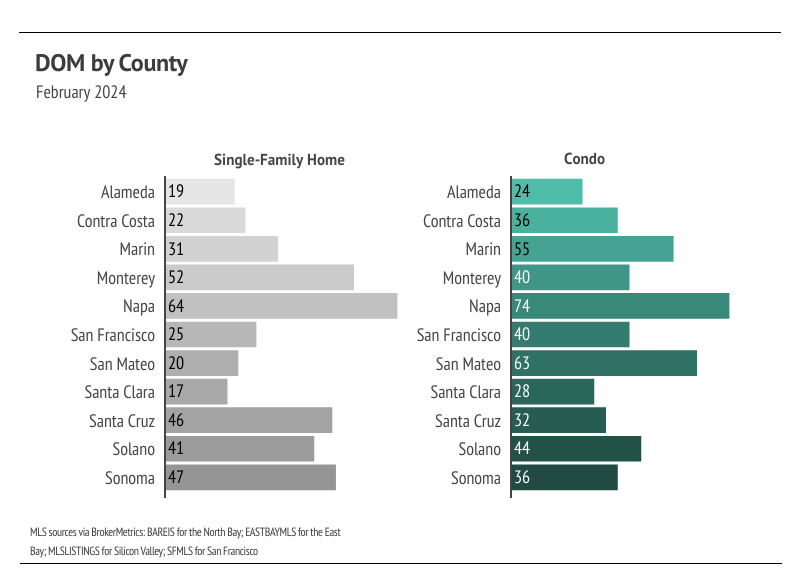
Median single-family home prices increased across the Bay Area in February 2024
In the Greater Bay Area, low inventory and high demand have more than offset the downward price pressure from higher mortgage rates, and prices generally haven’t experienced larger drops due to higher mortgage rates since the initial period of price correction from April 2022 to January 2023. In February, the median prices across most Bay Area counties were only slightly below their record highs with the exception of Marin and San Francisco, which peaked incredibly high in 2022. We expect prices to remain fairly stable in the winter months, but as interest rates decline and more sellers come to the market, prices will almost certainly rise in the first half of 2024. However, more homes must come to the market in the spring and summer to get anything close to a healthy market. Additionally, inventory is so low that rising supply will only increase prices as buyers are better able to find the best match.
High mortgage rates soften both supply and demand, but at this point rates have been above 6% for 15 months, and rate cuts will likely occur sometime this year. Potential buyers have had longer to save for a down payment and will have the opportunity to refinance in the next 12-24 months, which makes current rates less of a limiting factor. However, high demand can only do so much for the market if there isn’t supply to meet it.
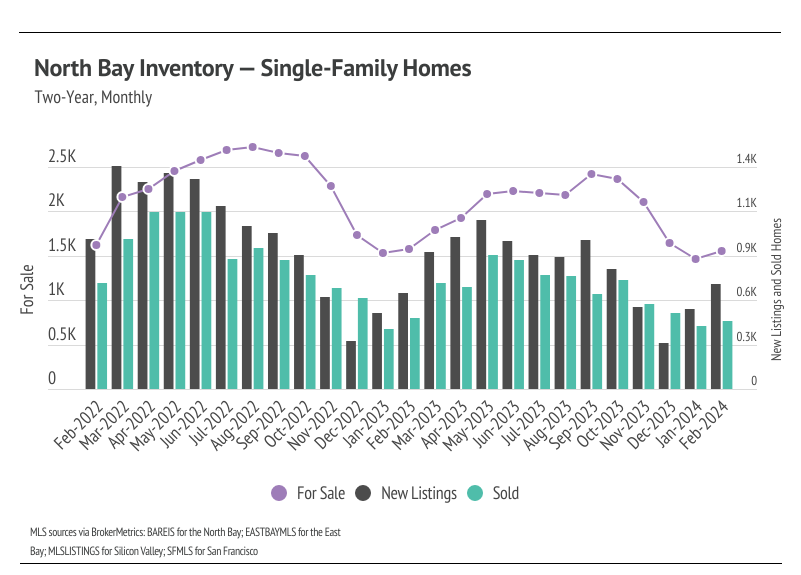
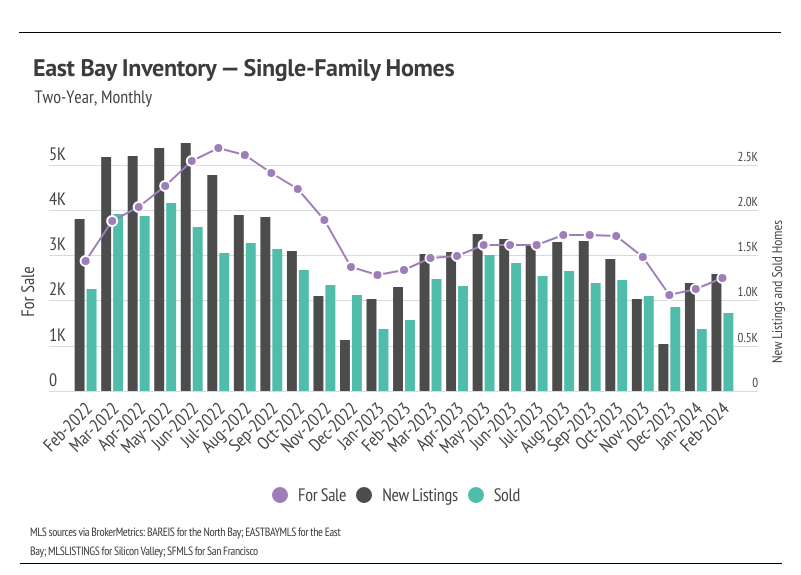
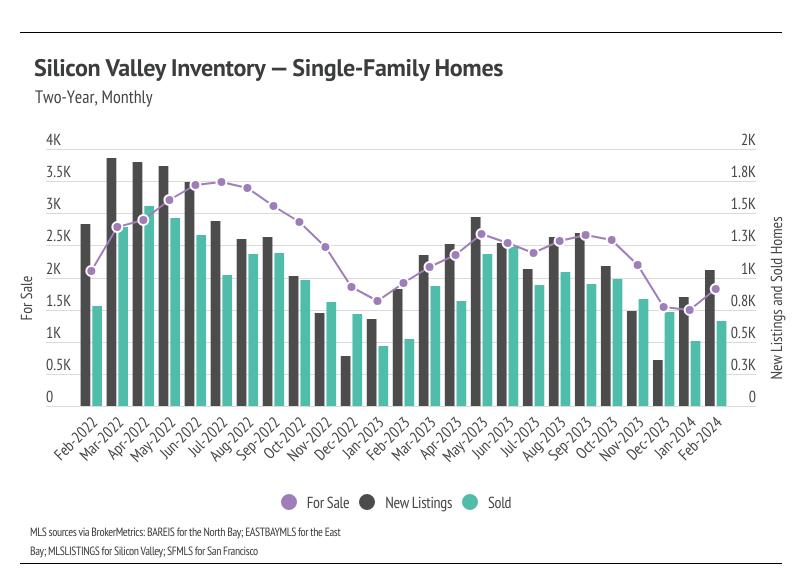
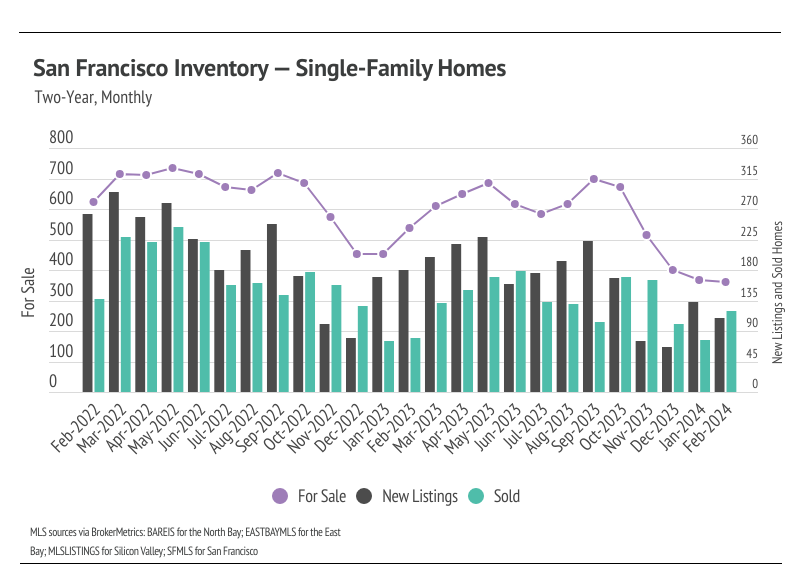
Single-family home and condo inventory, sales, and new listings increased month over month
Since the start of 2023, single-family home inventory has followed fairly typical seasonal trends, but at significantly depressed levels. Low inventory and fewer new listings have slowed the market considerably. Typically, inventory peaks in July or August and declines through December or January, but the lack of new listings prevented meaningful inventory growth. Last year, sales and new listings peaked in May, while inventory peaked in September. New listings have been exceptionally low, so the little inventory growth in 2023 was driven by softening demand.
In January 2024, new listings rose significantly, which translated into more sales in February. With the current low inventory levels, the number of new listings coming to market is a significant predictor of sales. The next three months will be critical to our understanding of the market. More supply will mean a healthier market and a more normal housing market in 2024. Notably, San Francisco inventory was the one outlier in the Bay Area, reaching a record low level in February for the third month in a row.
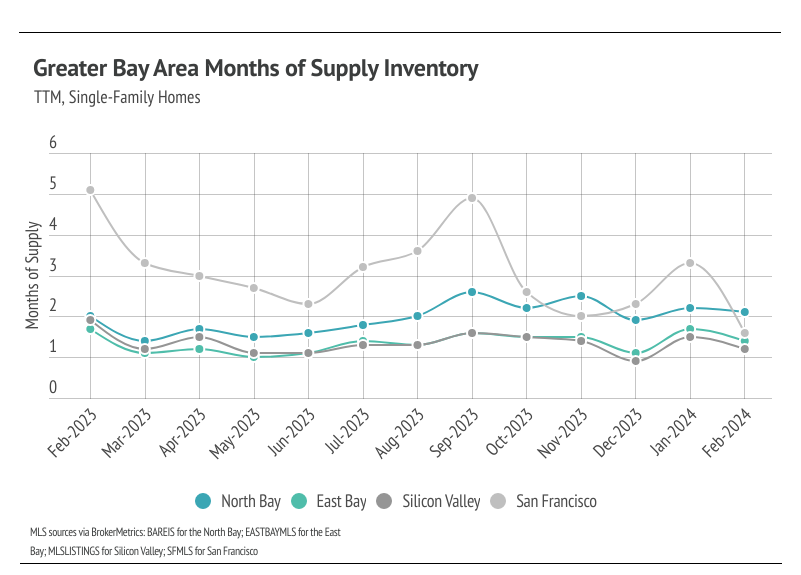
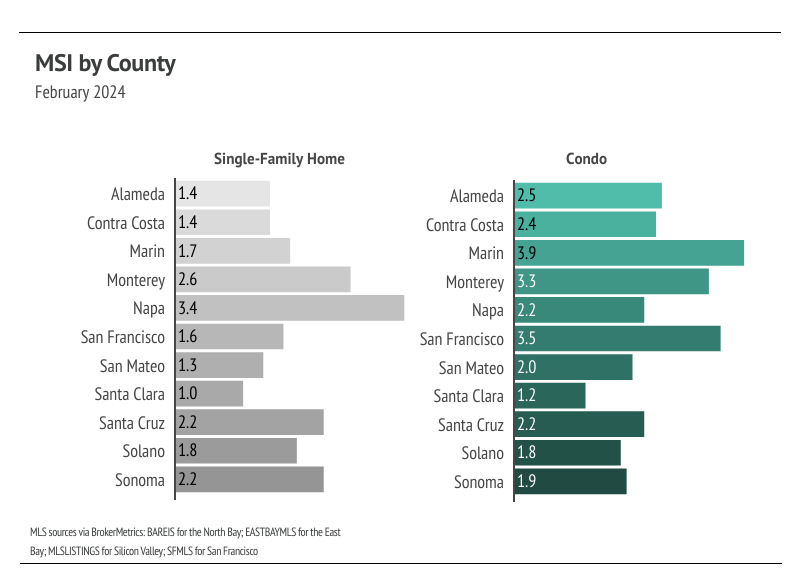
Months of Supply Inventory in February 2024 indicated a sellers’ market
Months of Supply Inventory (MSI) quantifies the supply/demand relationship by measuring how many months it would take for all current homes listed on the market to sell at the current rate of sales. The long-term average MSI is around three months in California, which indicates a balanced market. An MSI lower than three indicates that there are more buyers than sellers on the market (meaning it’s a sellers’ market), while a higher MSI indicates there are more sellers than buyers (meaning it’s a buyers’ market). The Bay Area markets tend to favor sellers, which is reflected in their low MSIs. San Francisco MSI is notable for its variability over the past year, oscillating from buyers’ to sellers’ markets twice over the course of 12 months. Currently, single-family home MSI is below three months of supply (a sellers’ market) in every Bay Area county except for single-family homes in Napa and condos in Marin and Monterey, which are now balanced.
We can also use percent of list price received as another indicator for supply and demand. Typically, in a calendar year, sellers receive the lowest percentage of list price during the winter months, when demand is lowest. January tends to have the lowest average sale price (SP) to list price (LP), and the summer months tend to have the highest SP/LP. The January and February 2024 SP/LP was higher than last year across the Bay Area, meaning we expect sellers overall to receive a higher percentage of the list price in 2024 than they did in 2023.
Local Lowdown Data