If you prefer to bypass The Big Story and jump straight to the Local Market Report, click here.
The Big Story
Quick Take:
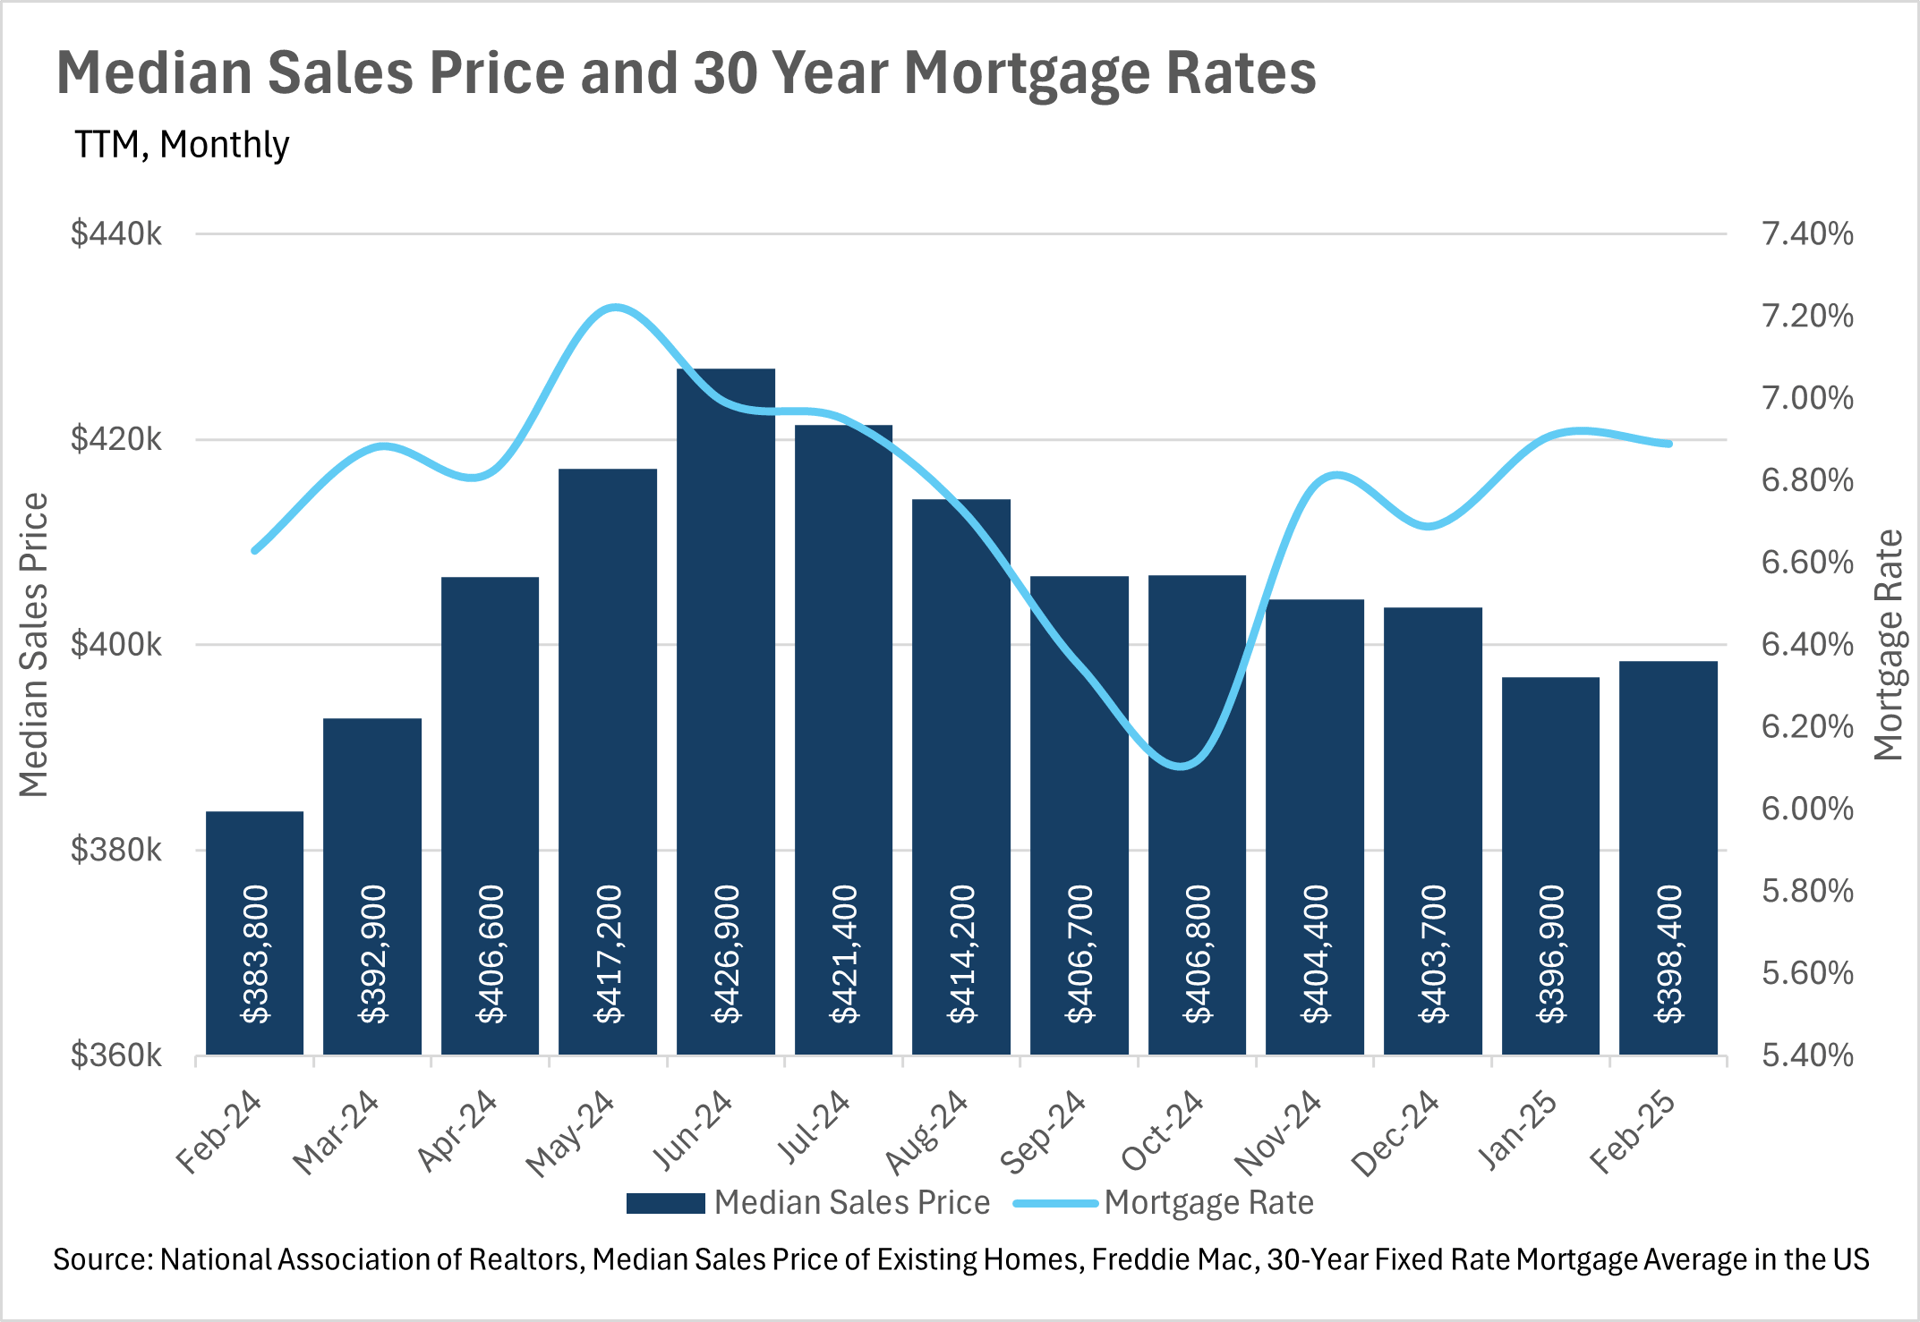
- Mortgage rates have ticked up slightly over the course of the past year, and coincidentally, so has the median sale price of a home in the US.
- According to Freddie Mac, the average 30-year mortgage rate is 6.62%, as of April 10th.
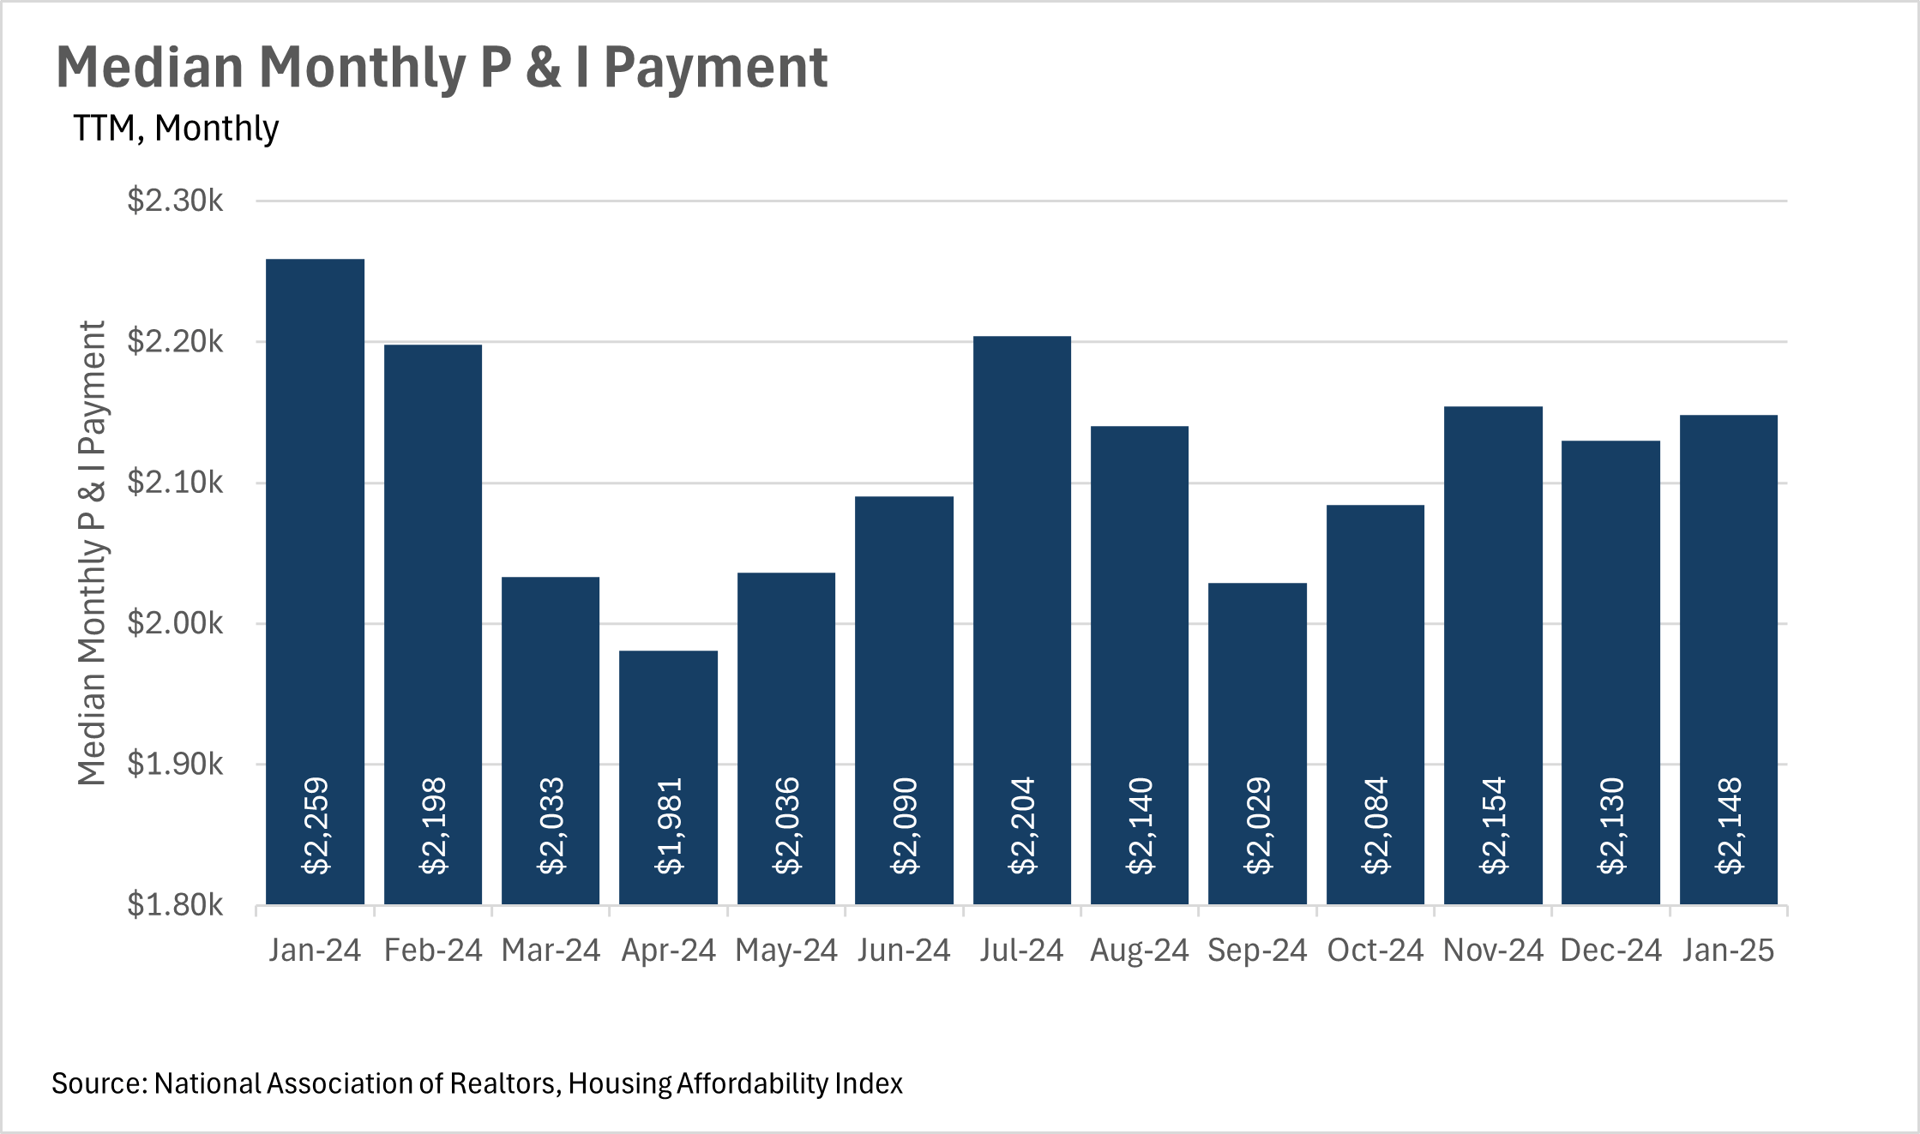
- Although affordability remains an issue throughout the country, the median monthly P&I payment has declined by over $100 on a year-over-year basis, representing a considerable savings for consumers!
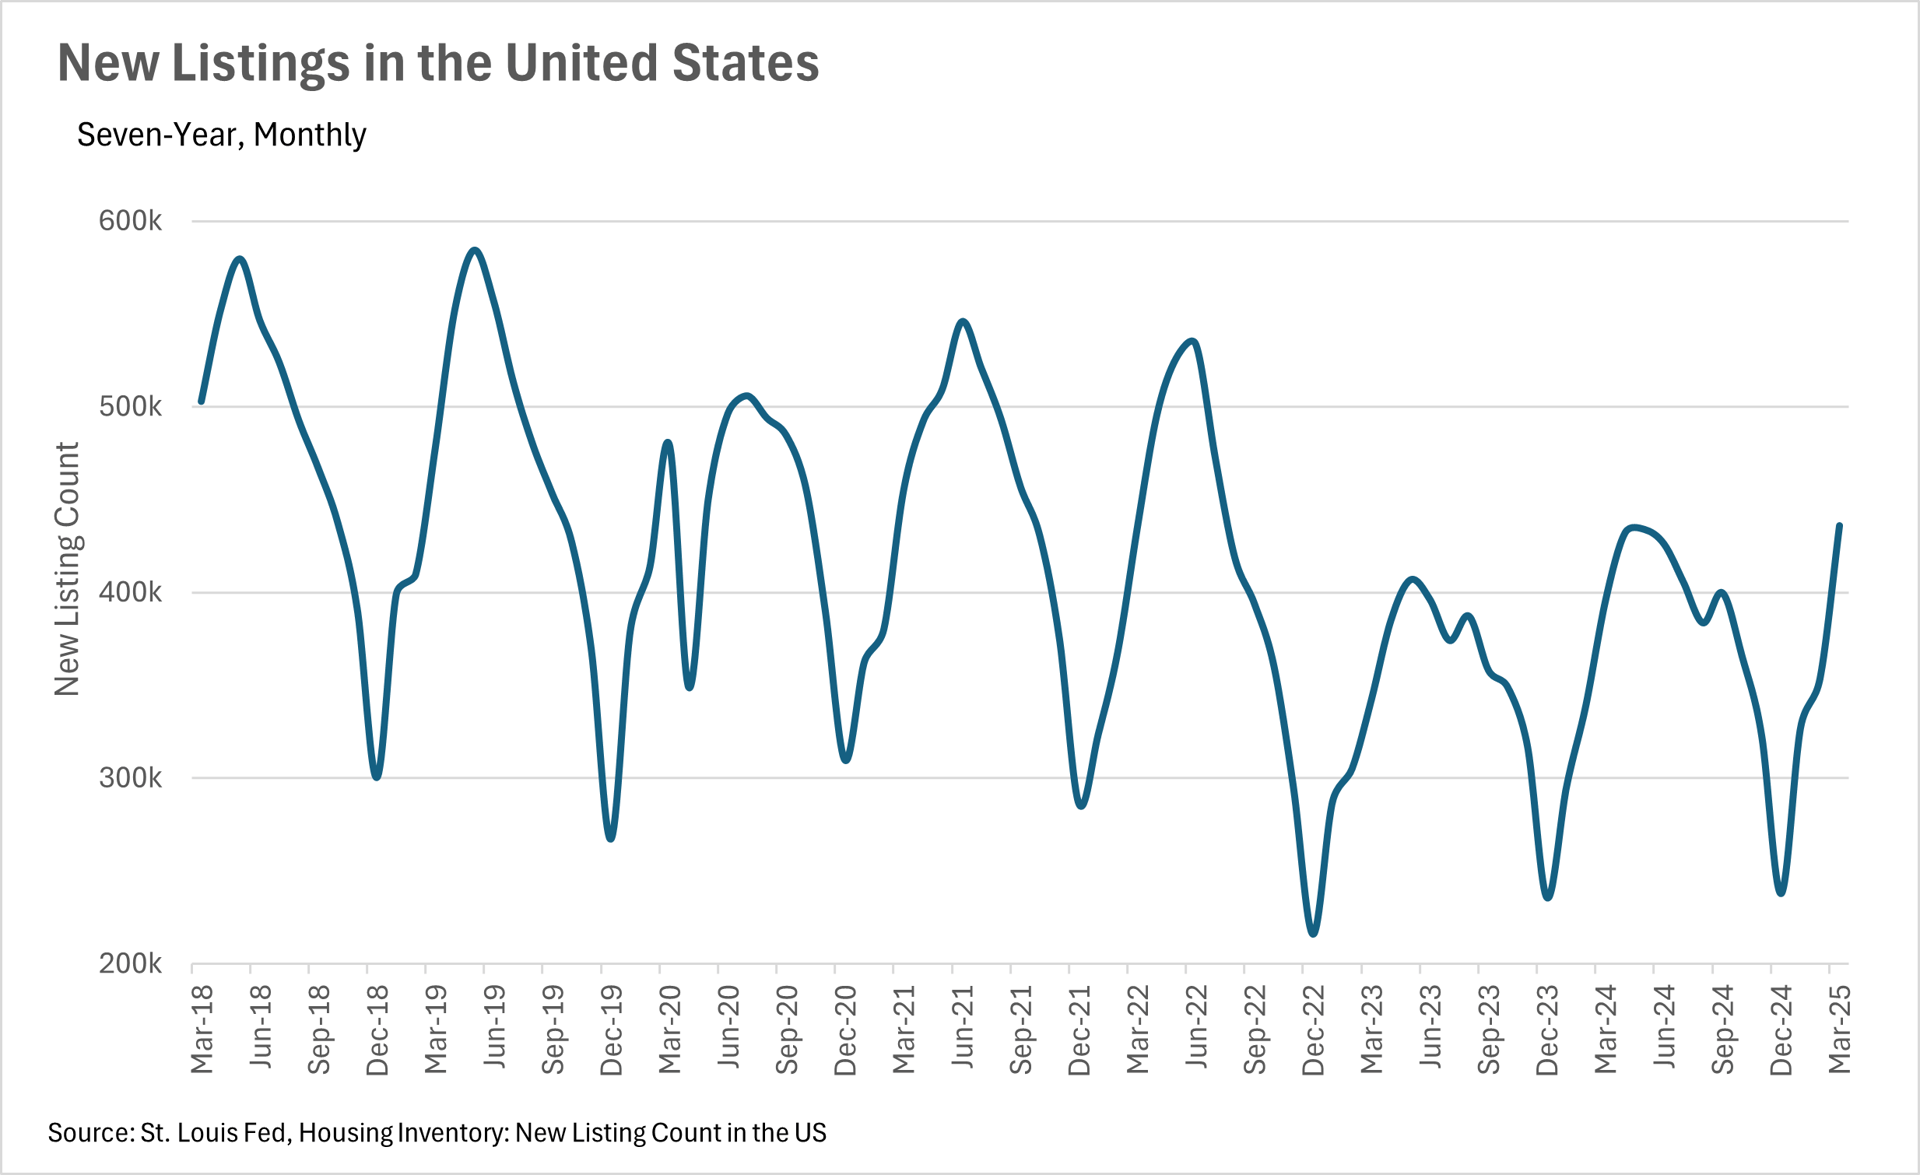
- We are seeing the trend of more new listings hitting the market continue, as we saw roughly 10% more new listings added in March when compared to a year ago.
Note: You can find the charts & graphs for the Big Story at the end of the following section.
*National Association of REALTORS® data is released two months behind, so we estimate the most recent month's data when possible and appropriate.
Home sales are roughly stagnant compared to last year
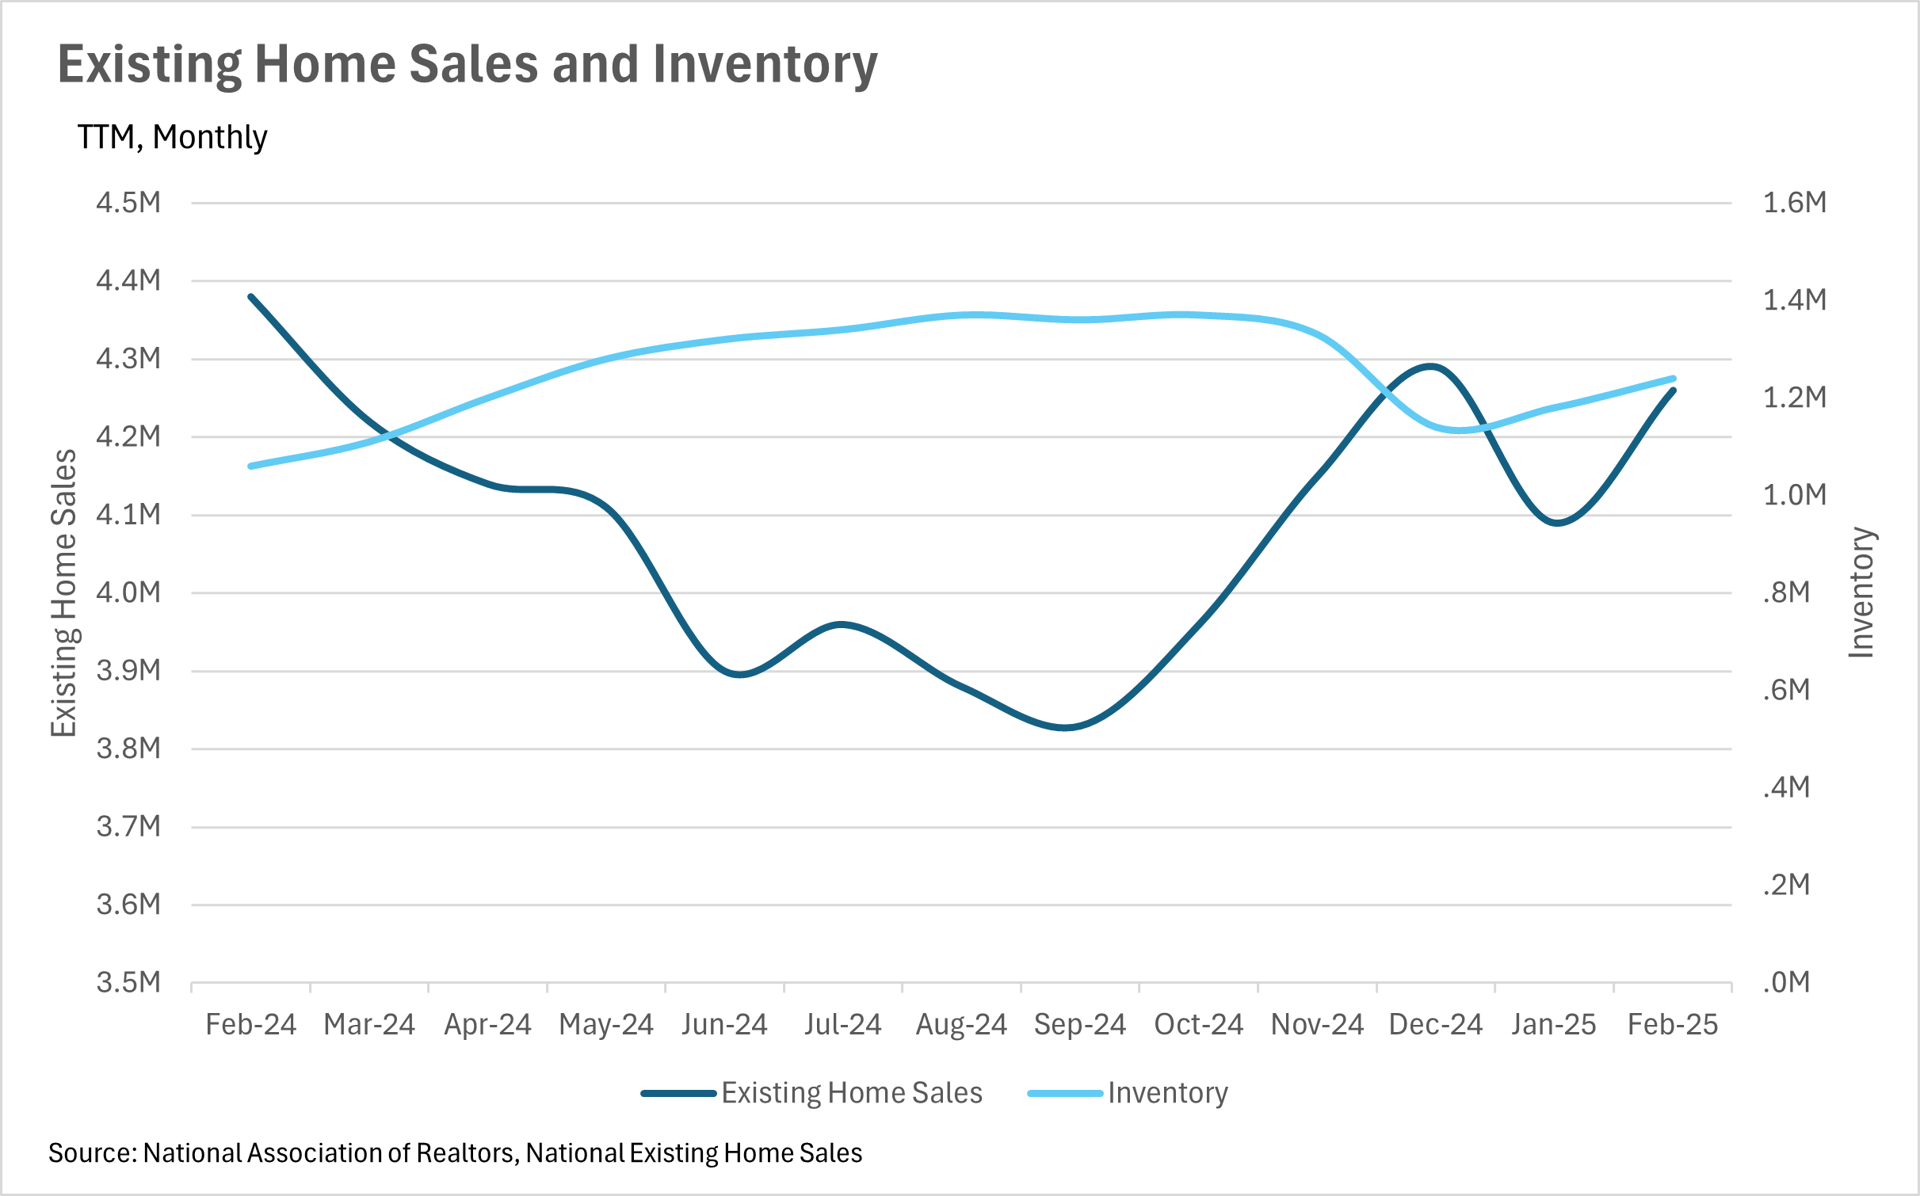
Although we are just about to exit the slow season for real estate sales, things are looking great overall. We saw a slight decrease in the number of sales on a year-over-year basis in February, with there being 4,260,000 sales in February 2025, compared to 4,380,000 in February 2024. However, on the flip side, we saw considerably more inventory added this year, with 1,240,000 homes on the market in February of this year, compared to 1,060,000 homes on the market around this time last year.
This means that all over the country, buyers have many more options than in recent years, which may lead to listings sitting on the market for a bit longer than what we’ve seen over the past couple of years. When you couple this with the fact that there are more new listings being added to the market, with just over 10% more listings added in March of 2025, compared to March of 2024, we might see some power start moving away from sellers to the buyers.
Additionally, this uptick in new listings might be an indication that sellers are starting to accept the fact that considerably lower mortgage rates aren’t coming anytime soon. Although many were holding out hope over the course of the past couple of years, the Fed has made it very clear that they’re not looking to drop rates by a considerable margin anytime soon. This, of course, means that prospective sellers have an important choice to make - whether they should sell, or continue holding out. From the data that we’re seeing, it seems that many sellers are beginning to choose the former option!
When turning to affordability, we saw a rather interesting phenomenon - median monthly P&I payments decreased by nearly 5%, all while interest rates and median sale prices increased by just under 4%. This likely means that there was a considerable cohort of homeowners out there that locked in rates toward the end of 2023 when rates were at a local high, and recently refinanced when rates came down a bit. The median consumer having an additional $100 in their pocket each and every month is a great thing for the economy, especially when we face economic uncertainty, tariffs, and ever-changing geopolitics!
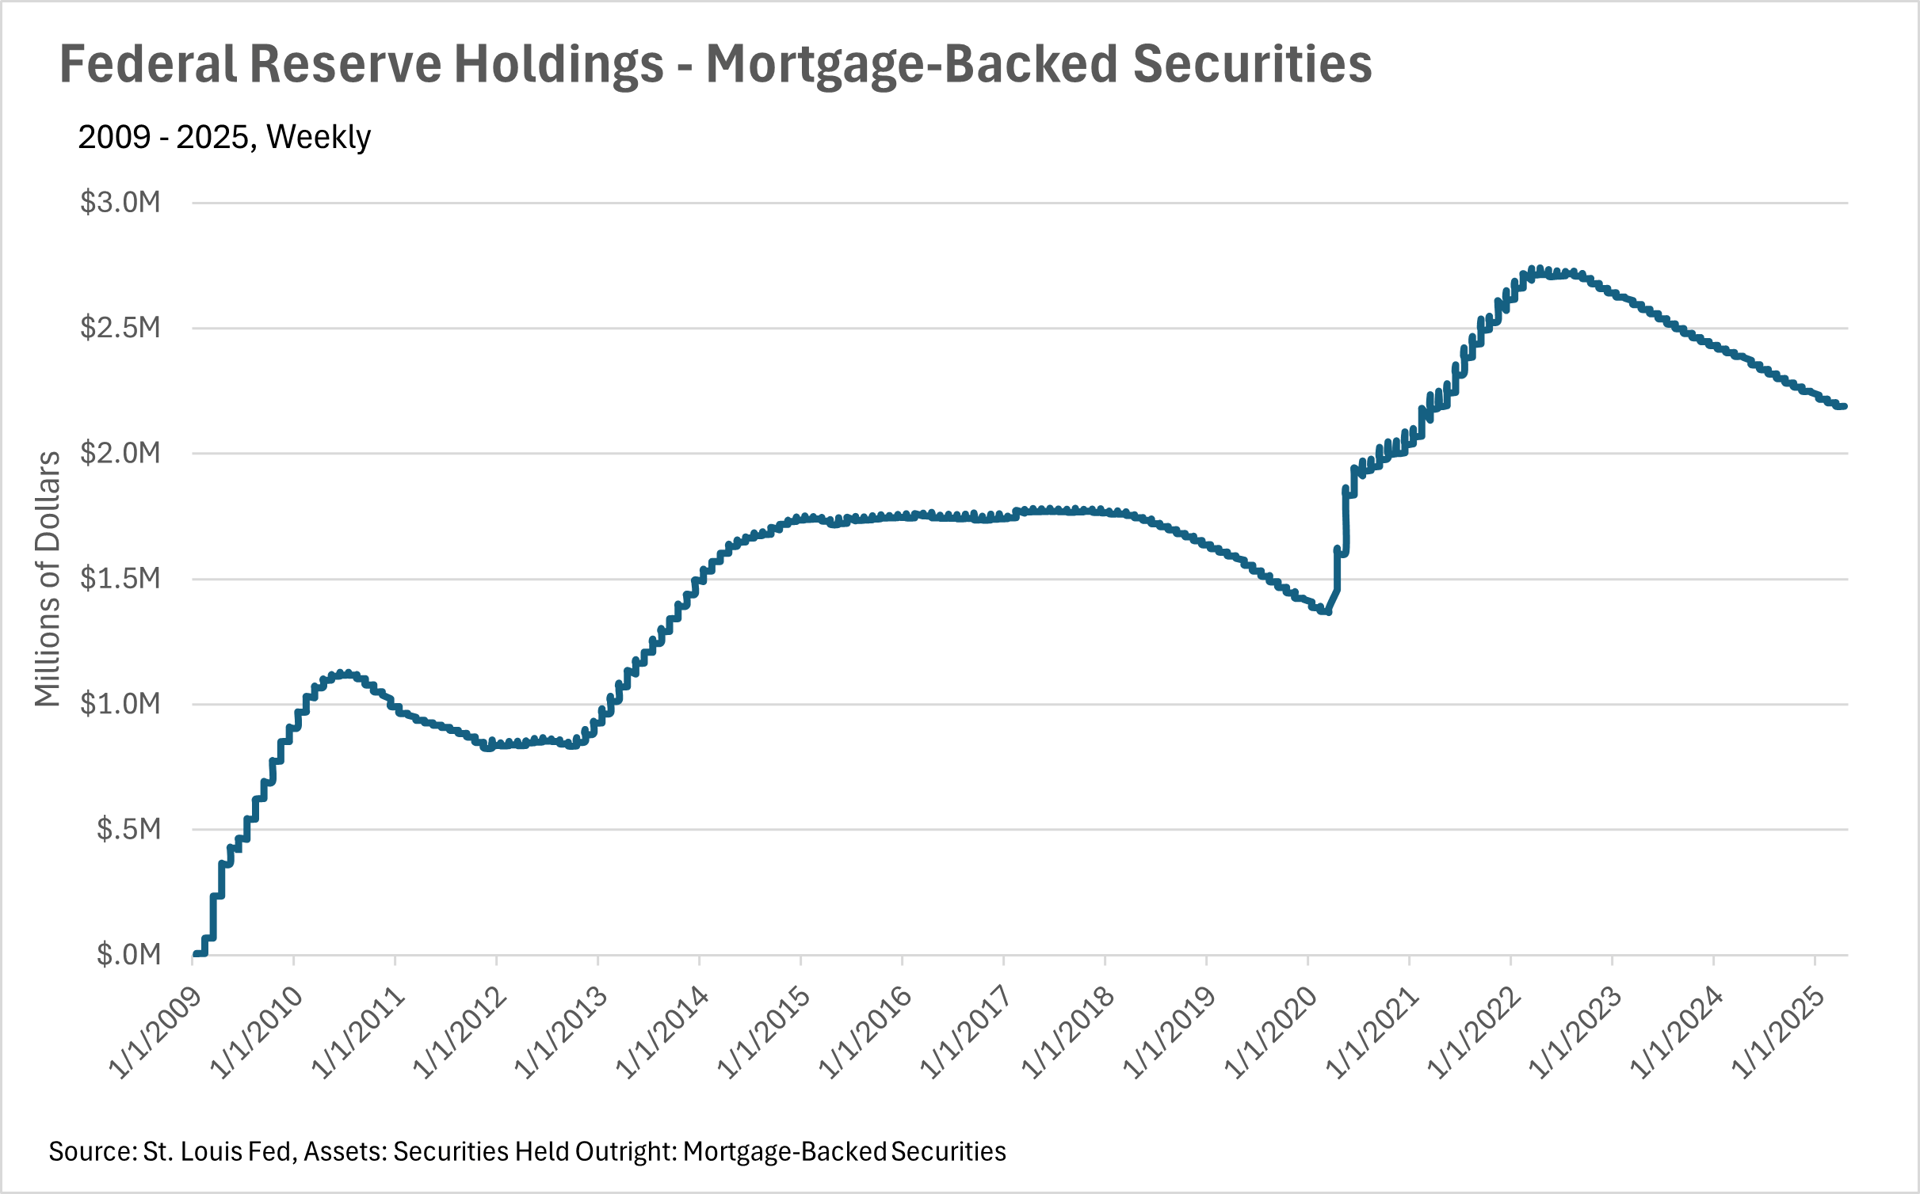
Lastly, it’s important to note that it’s business as usual in terms of the Federal Reserve. In their recent FOMC meeting, they decided to hold the federal funds rate firmly where it has been over the past couple of months. Fed officials also indicated that they are not in a rush to lower rates by a considerable margin anytime soon. However, that could always change, as we’re living in an incredibly dynamic era right now! Additionally, the Fed is continuing to offload mortgage-backed securities at a steady pace!
Ultimately though, this is just what we’re seeing at a national level. As we all know, real estate is an incredibly localized industry, so knowing what’s going on in your own market is pivotal. Below is our local lowdown, that outlines everything you need to know about what’s happening around you in your neighborhood and surrounding areas!
Big Story Data
The Local Lowdown
Quick Take:
- Median sale prices throughout the North Bay have remained fairly strong, with little deviation from their long-term averages.
- Inventory has fallen by a considerable margin, as the number of homes remains stagnant and the number of new listings drops.
- Despite the drop in inventory, homes are sitting on the market for longer, with homes in Solano and Sonoma counties sitting on the market for roughly 15% longer than they did last year.
Note: You can find the charts/graphs for the Local Lowdown at the end of this section.
Median sale prices remain strong in the North Bay
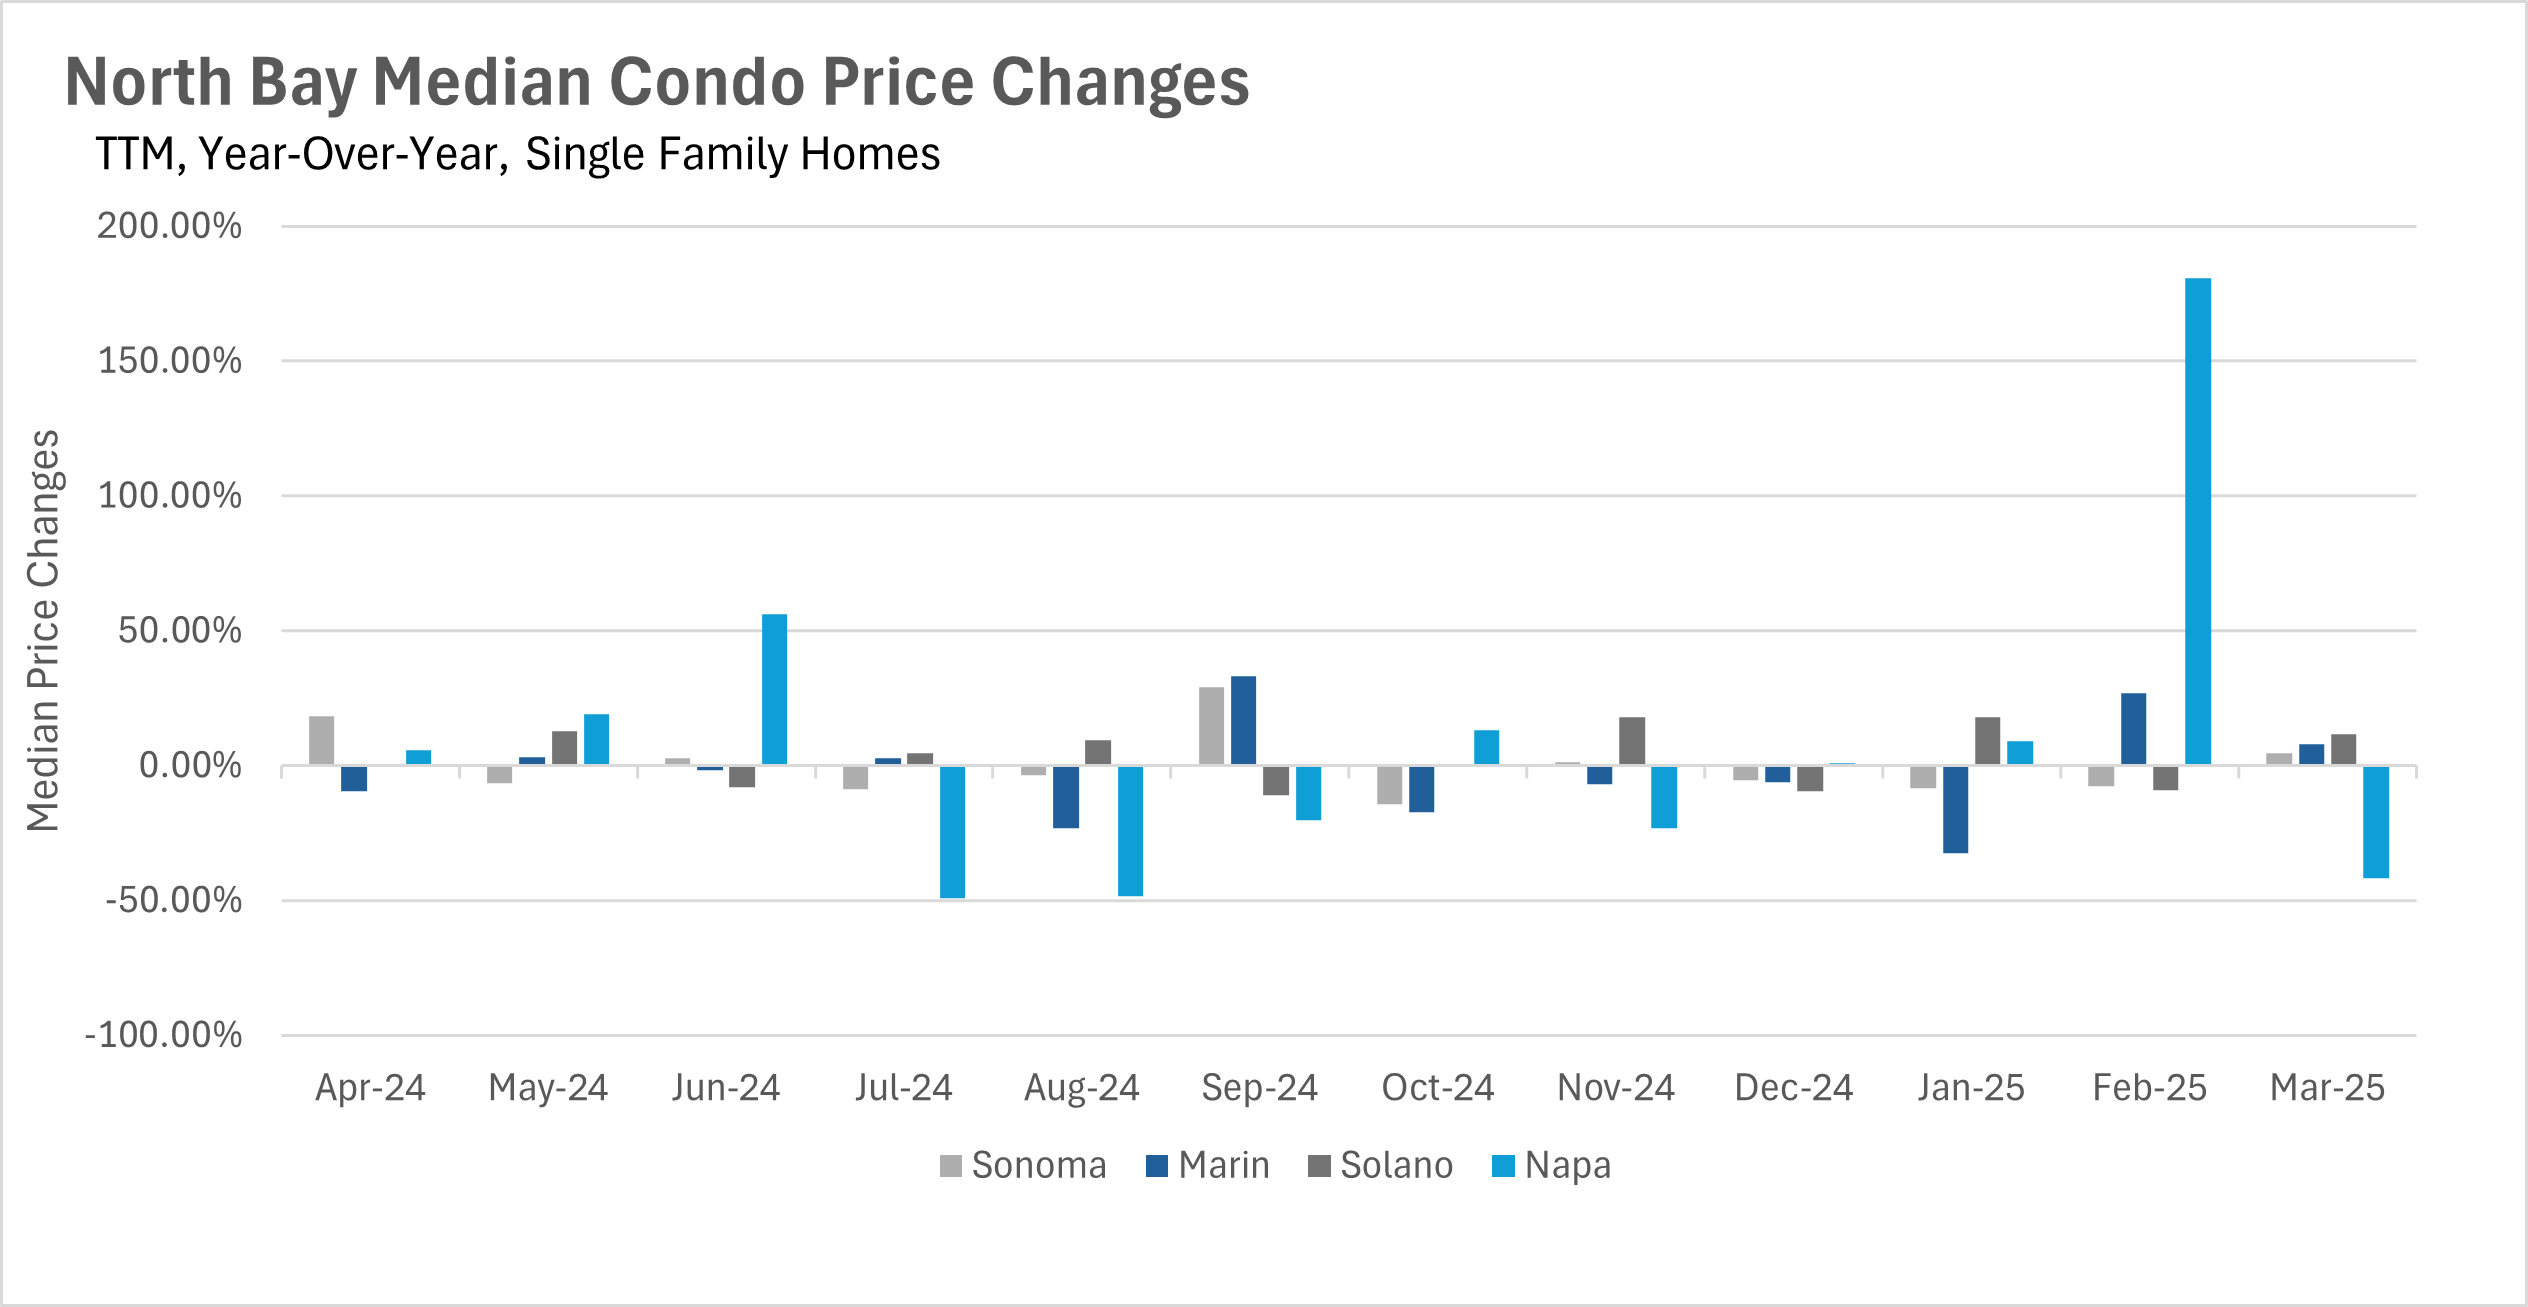
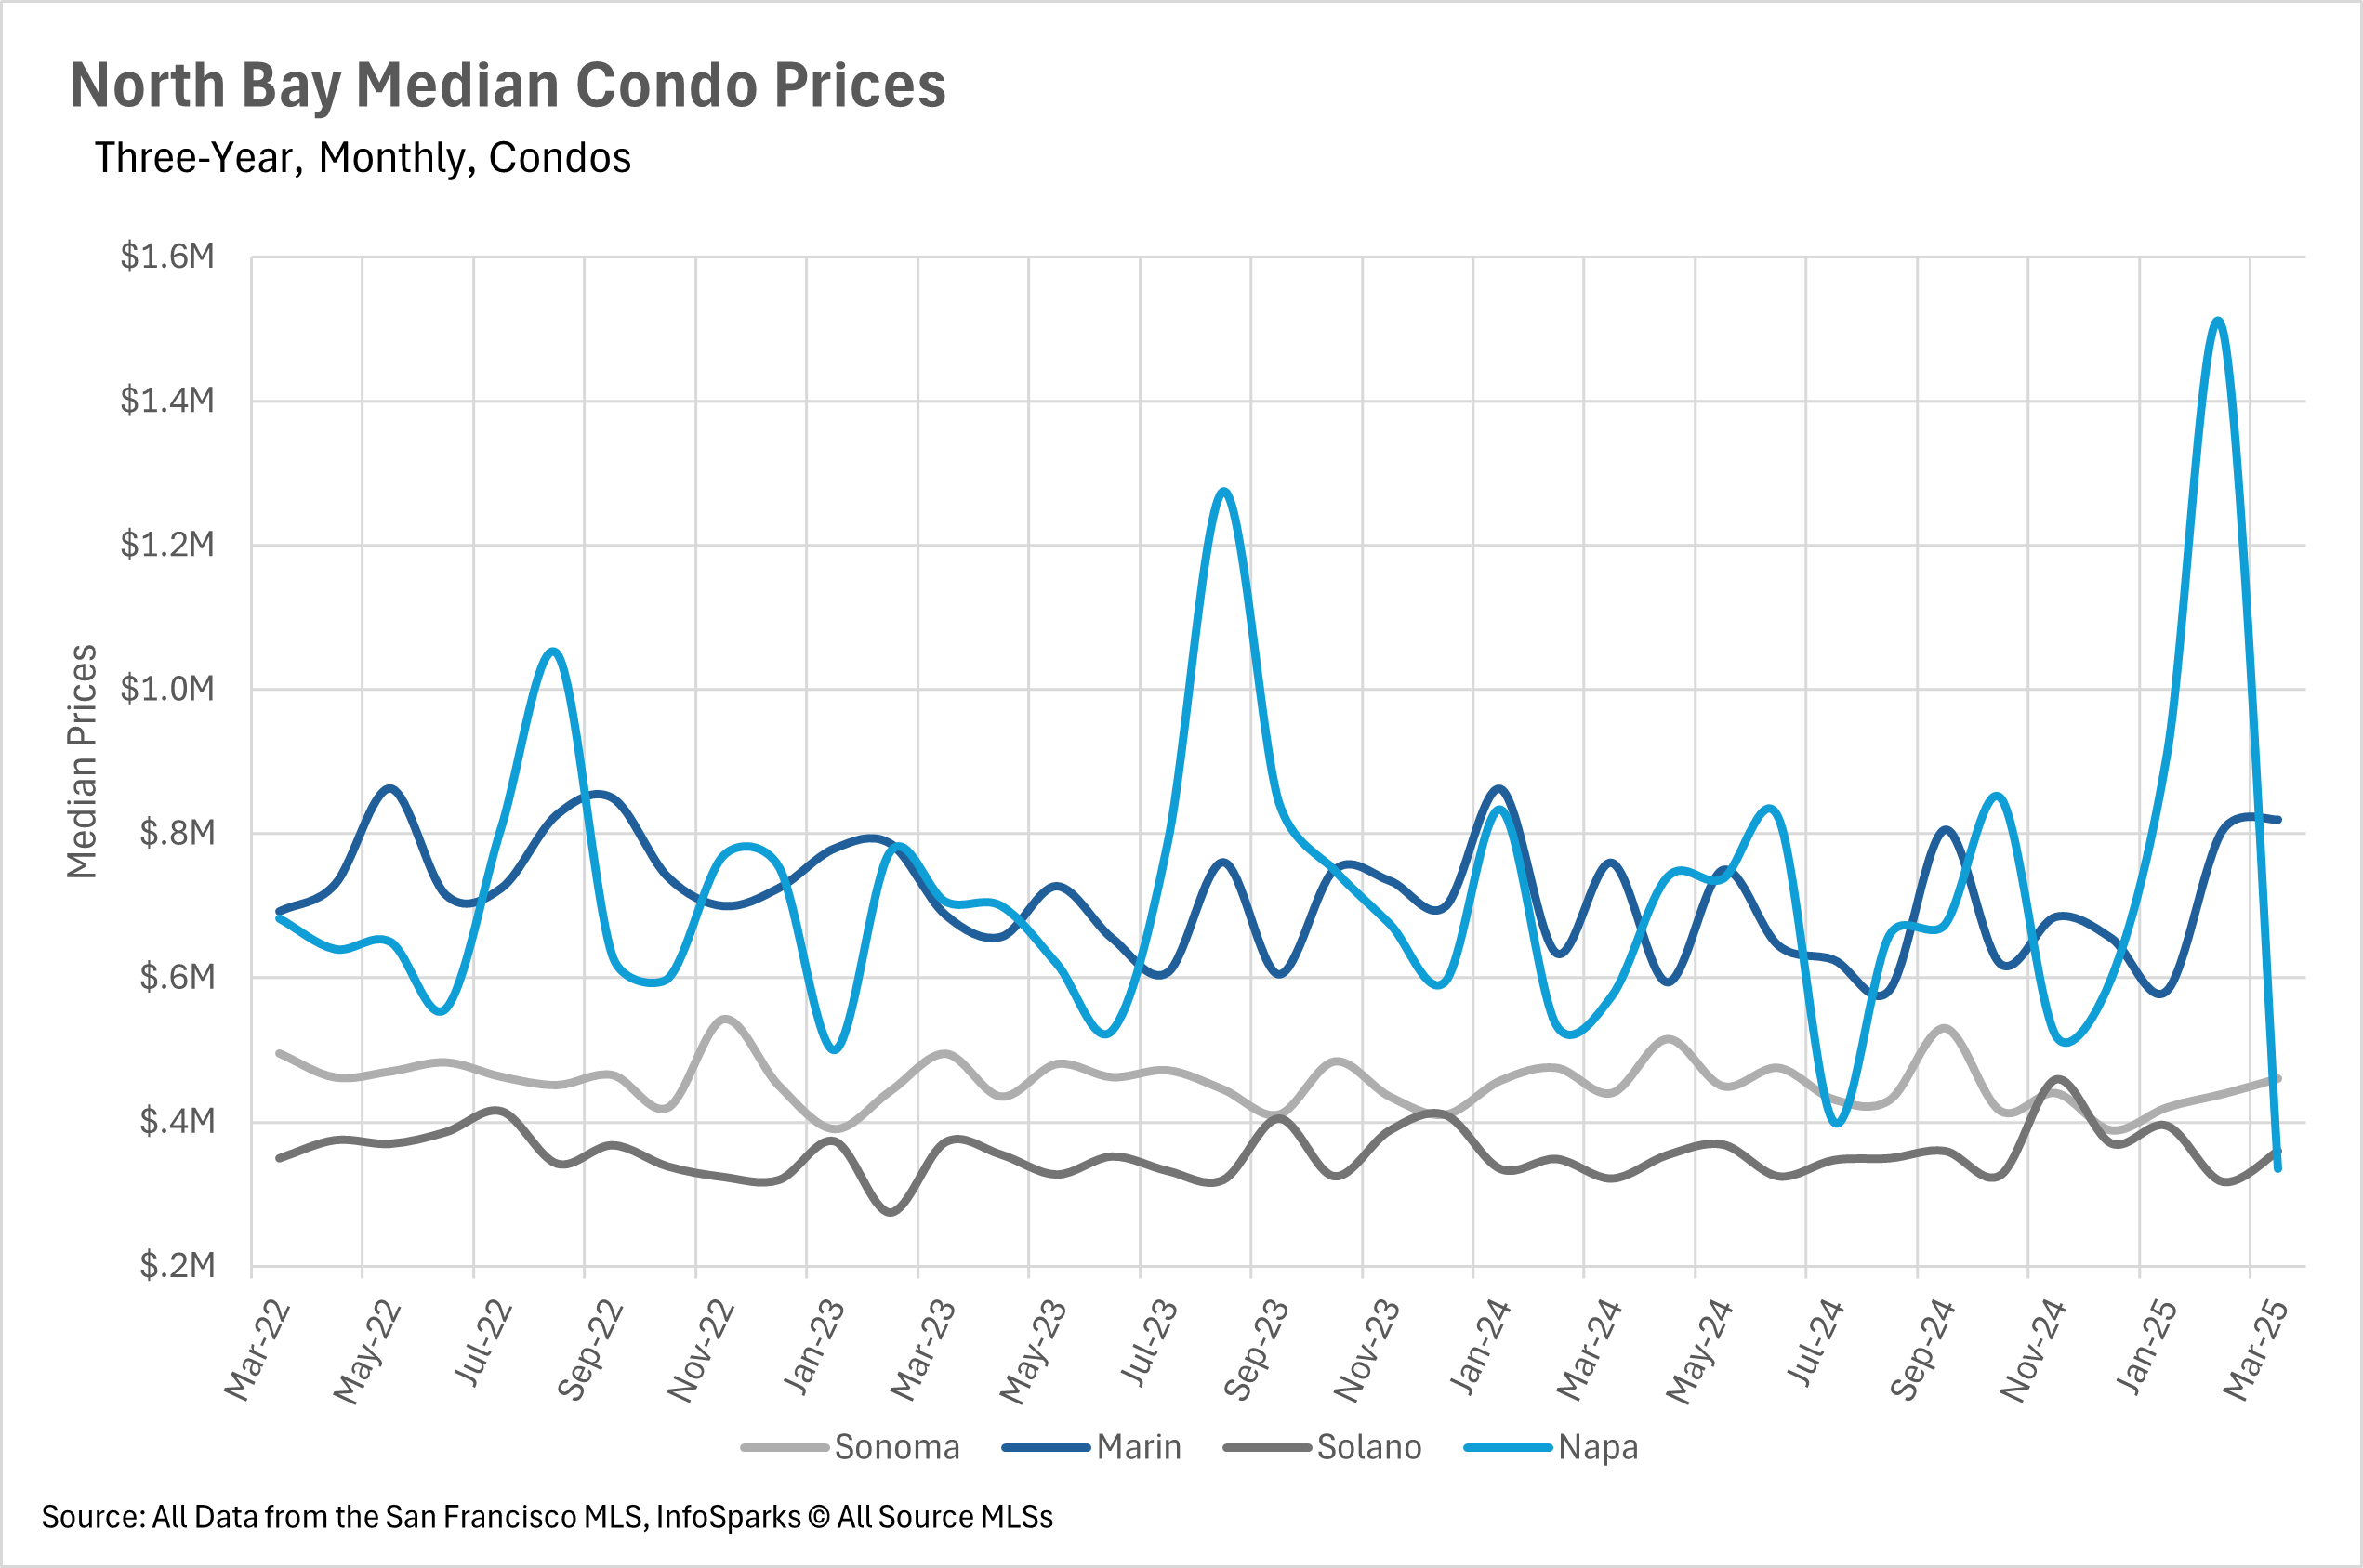
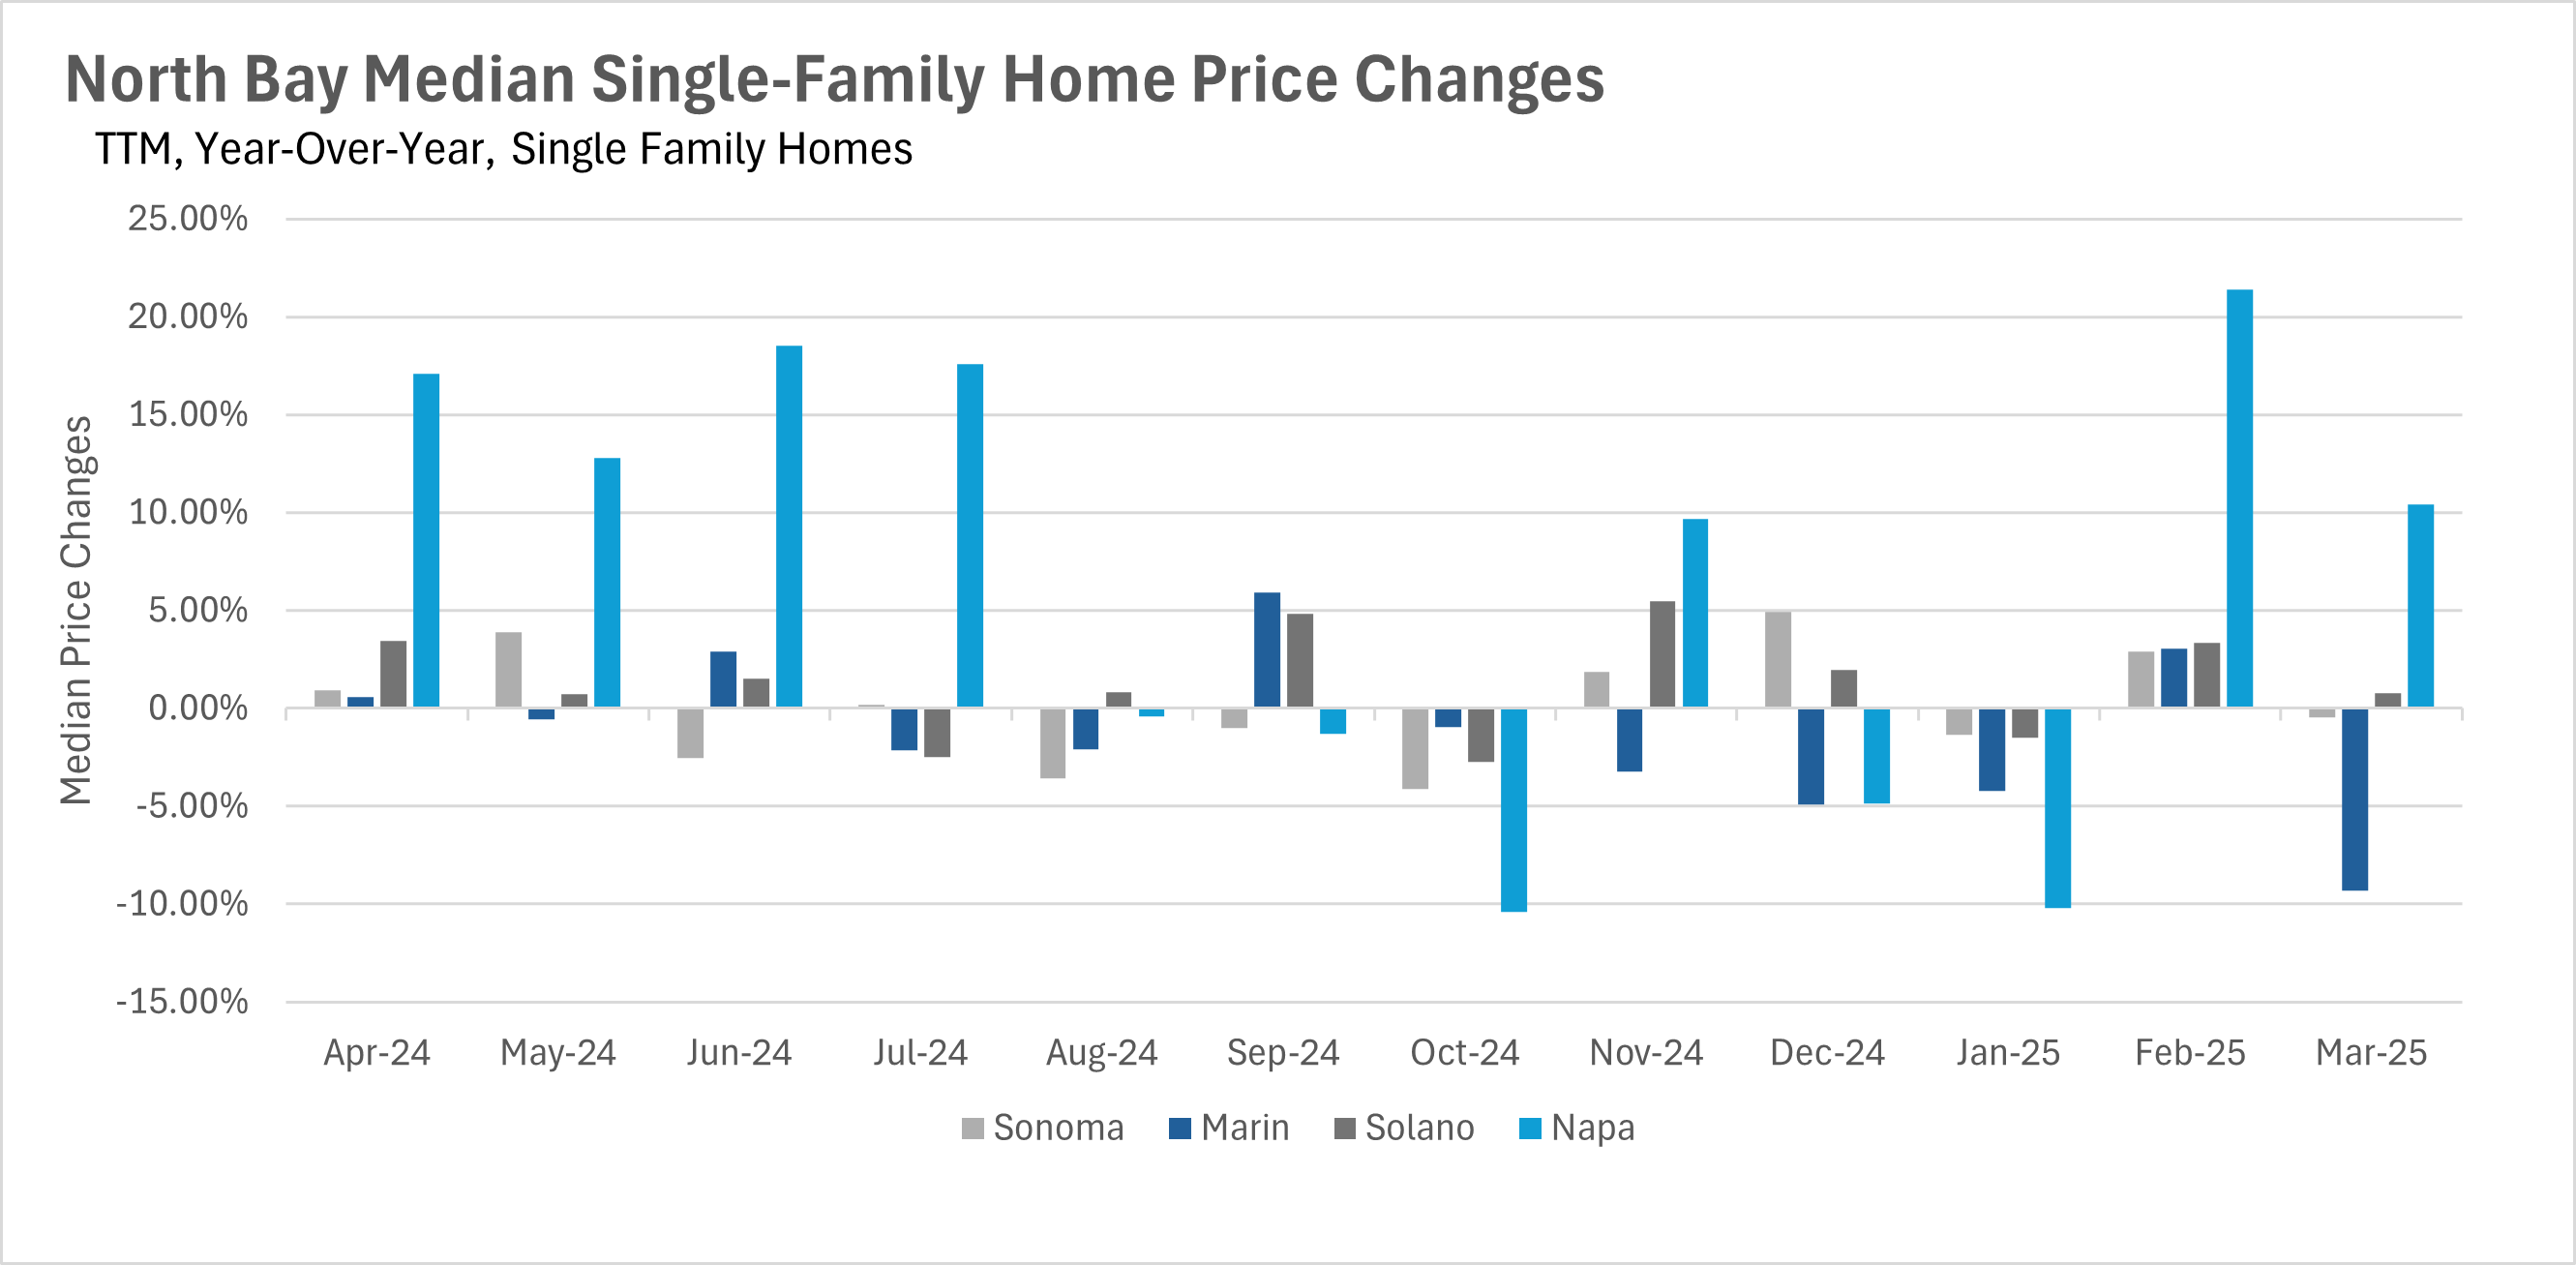
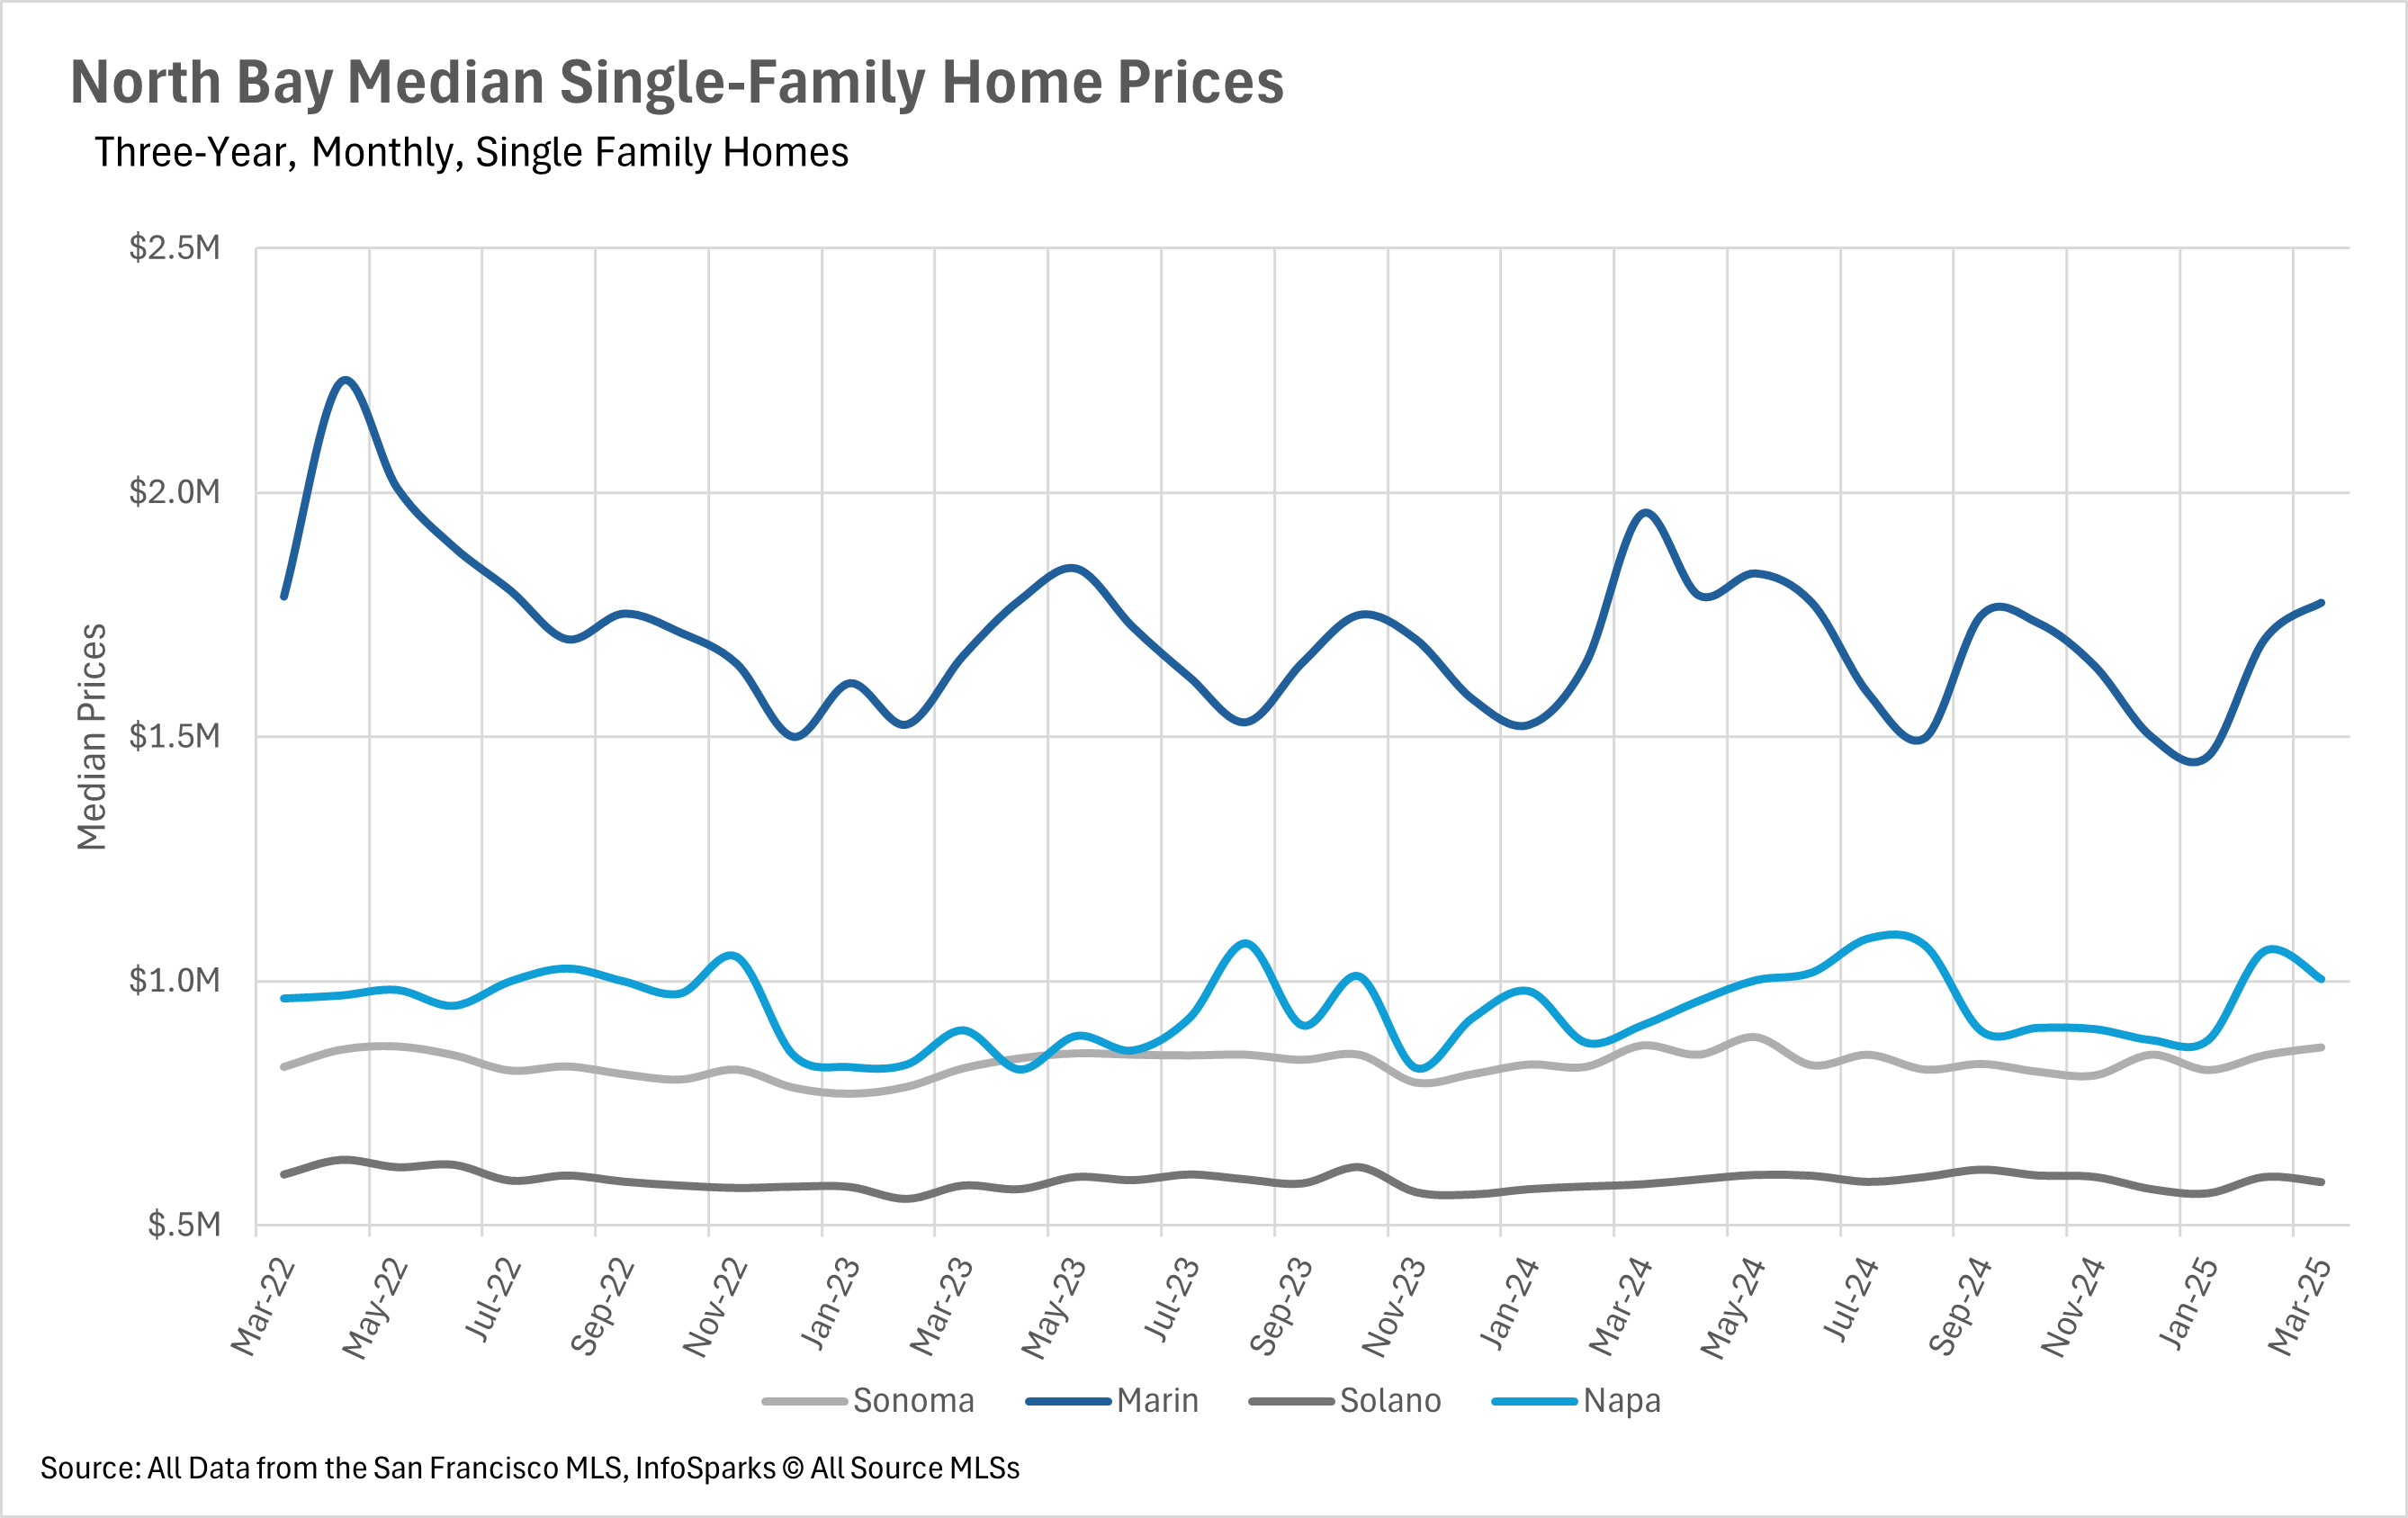
Although there was quite a bit of uncertainty coming into 2025, so far things have been going pretty well in the North Bay. Median sale prices have remained fairly static so far this year, which is great news for sellers! In the month of March, median sale prices in Sonoma and Solano counties were roughly flat, whereas Marin County saw a 9.32% year-over-year decrease, and Napa County saw a 10.40% increase! However, we might see prices begin to increase throughout the North Bay, as inventory might become an issue over the course of the next few months!
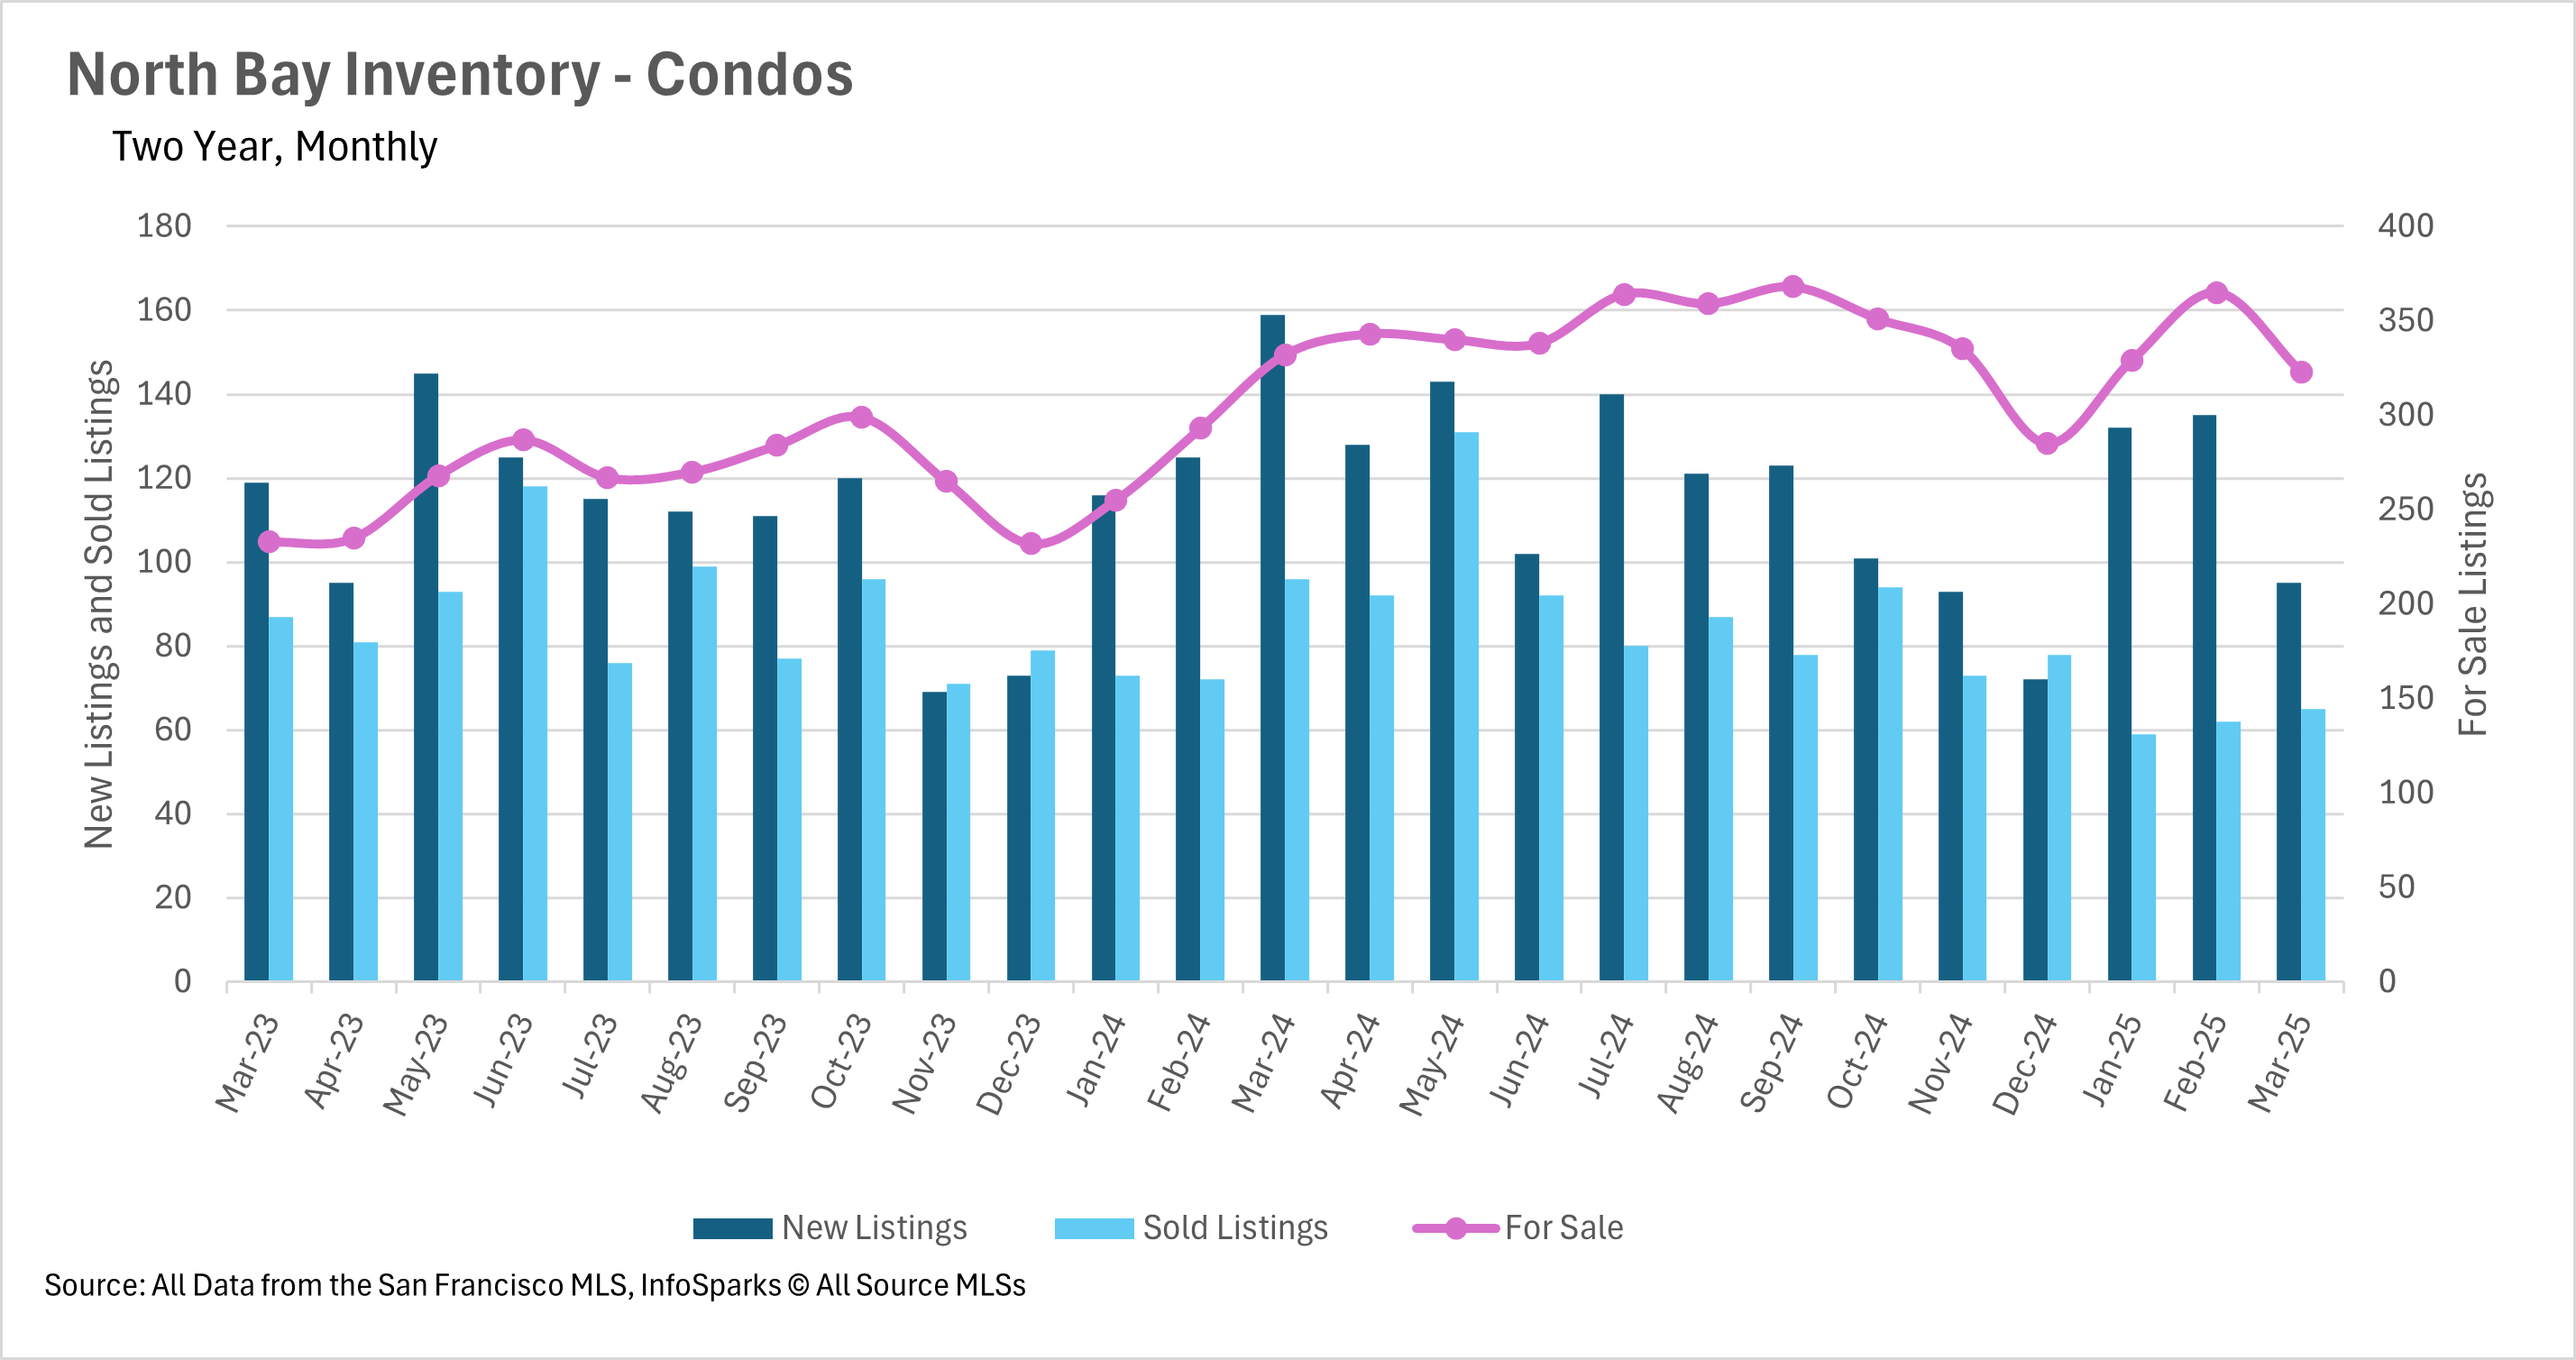
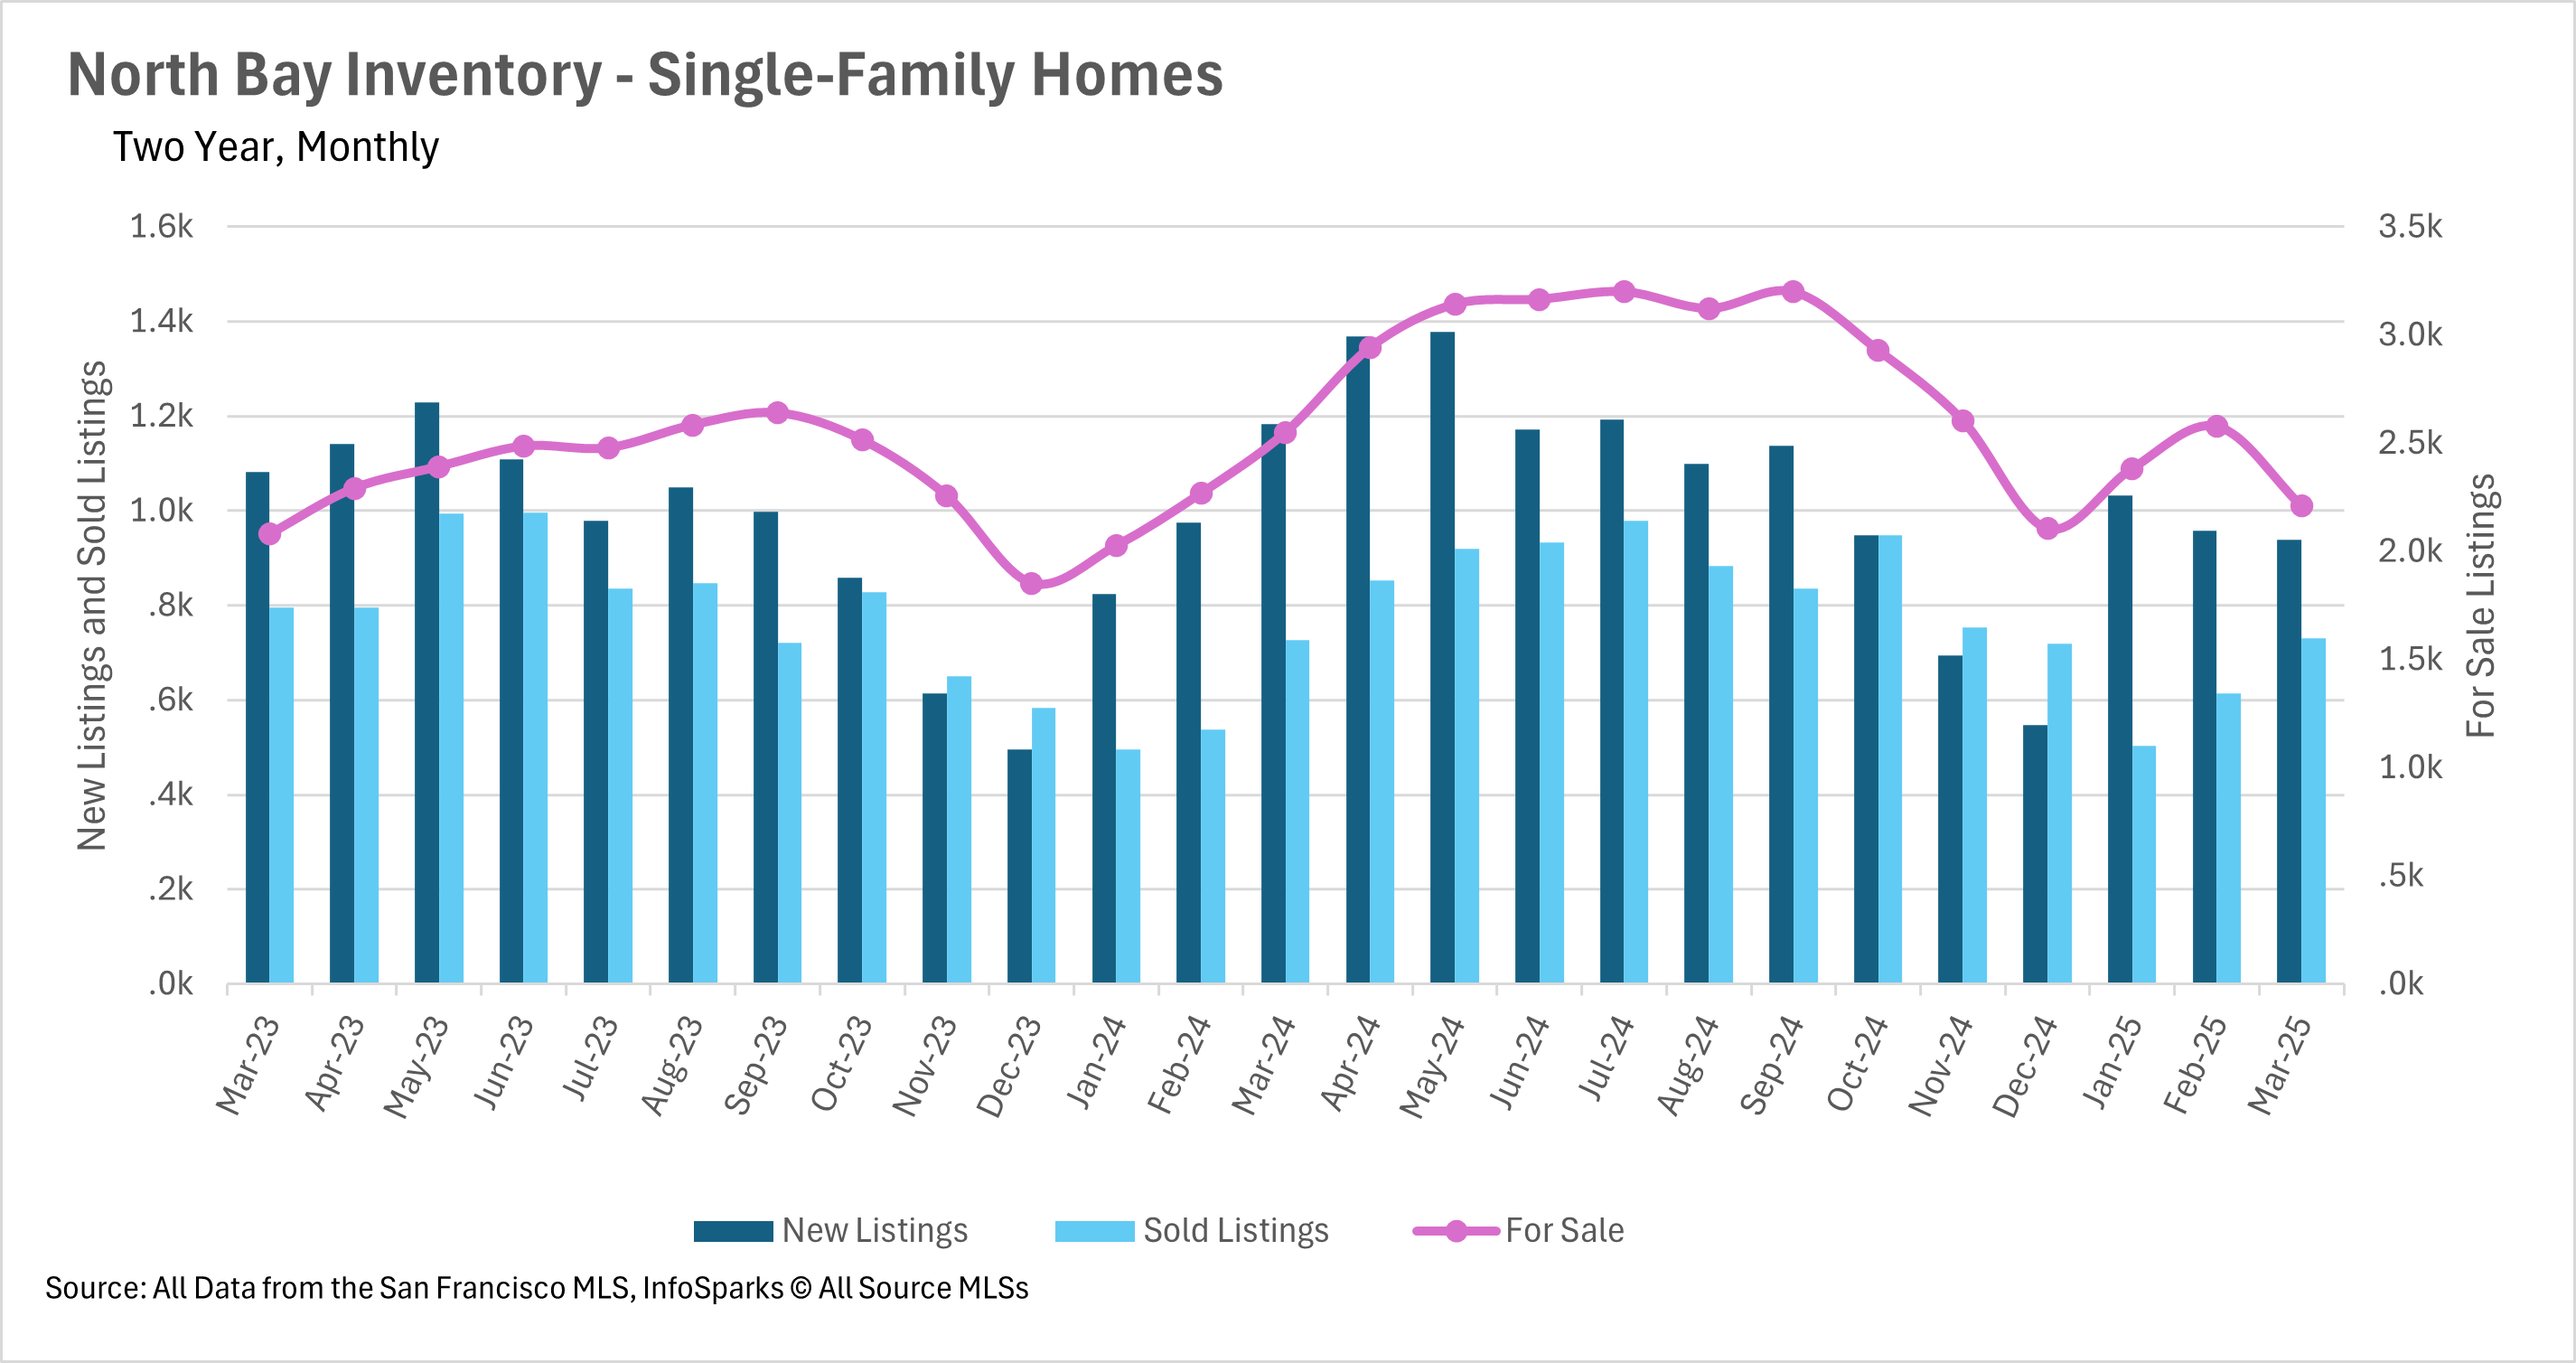
Inventory looks like it will continue to be an issue
As many of us know, in the real estate market, inventories tend to build throughout the first quarter, when there are fewer buyers in the market looking for a new home. This, of course, means that the month of March is typically a month where we see inventory build. However, this month we saw a month-over-month decrease of 14.28%! Additionally, we saw the number of new listings hitting the market drop by a considerable margin, as there were 20.78% fewer new listings in March 2025 than there were in March 2024. If we don’t see some new listings start to hit the market soon, we could start to see more bidding wars, as buyers fight for a limited supply of homes, resulting in an increase in the median sale price!
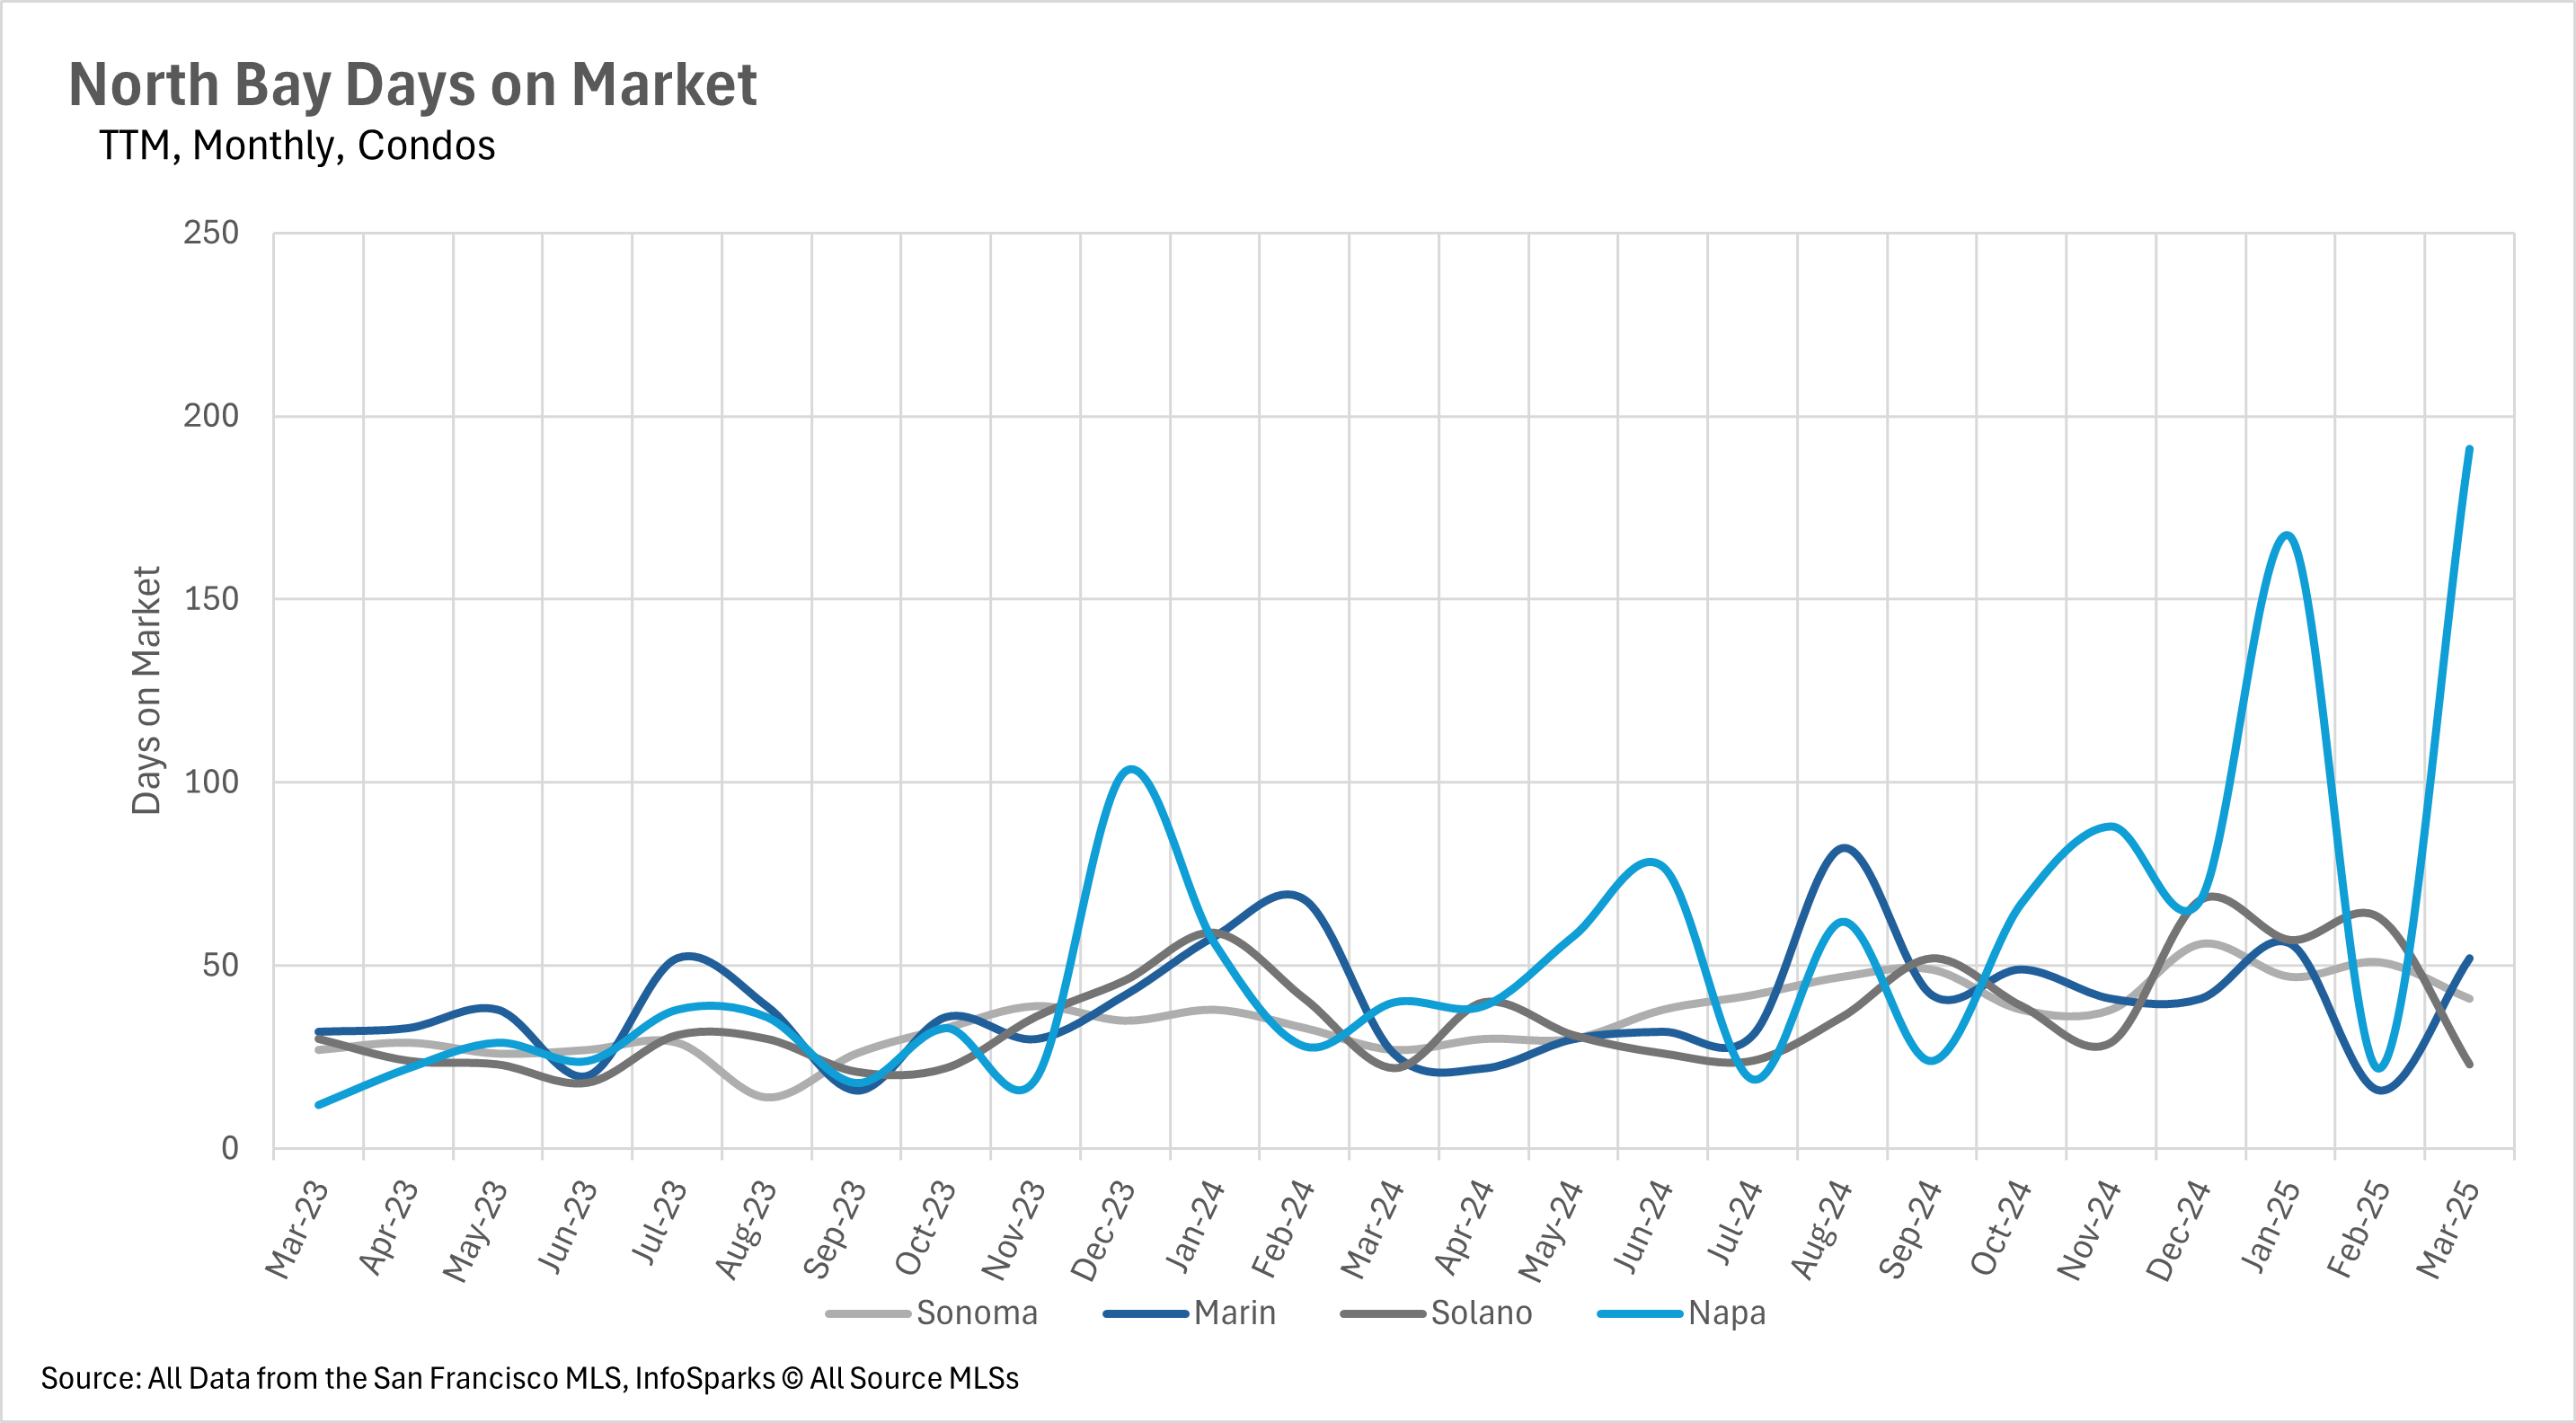
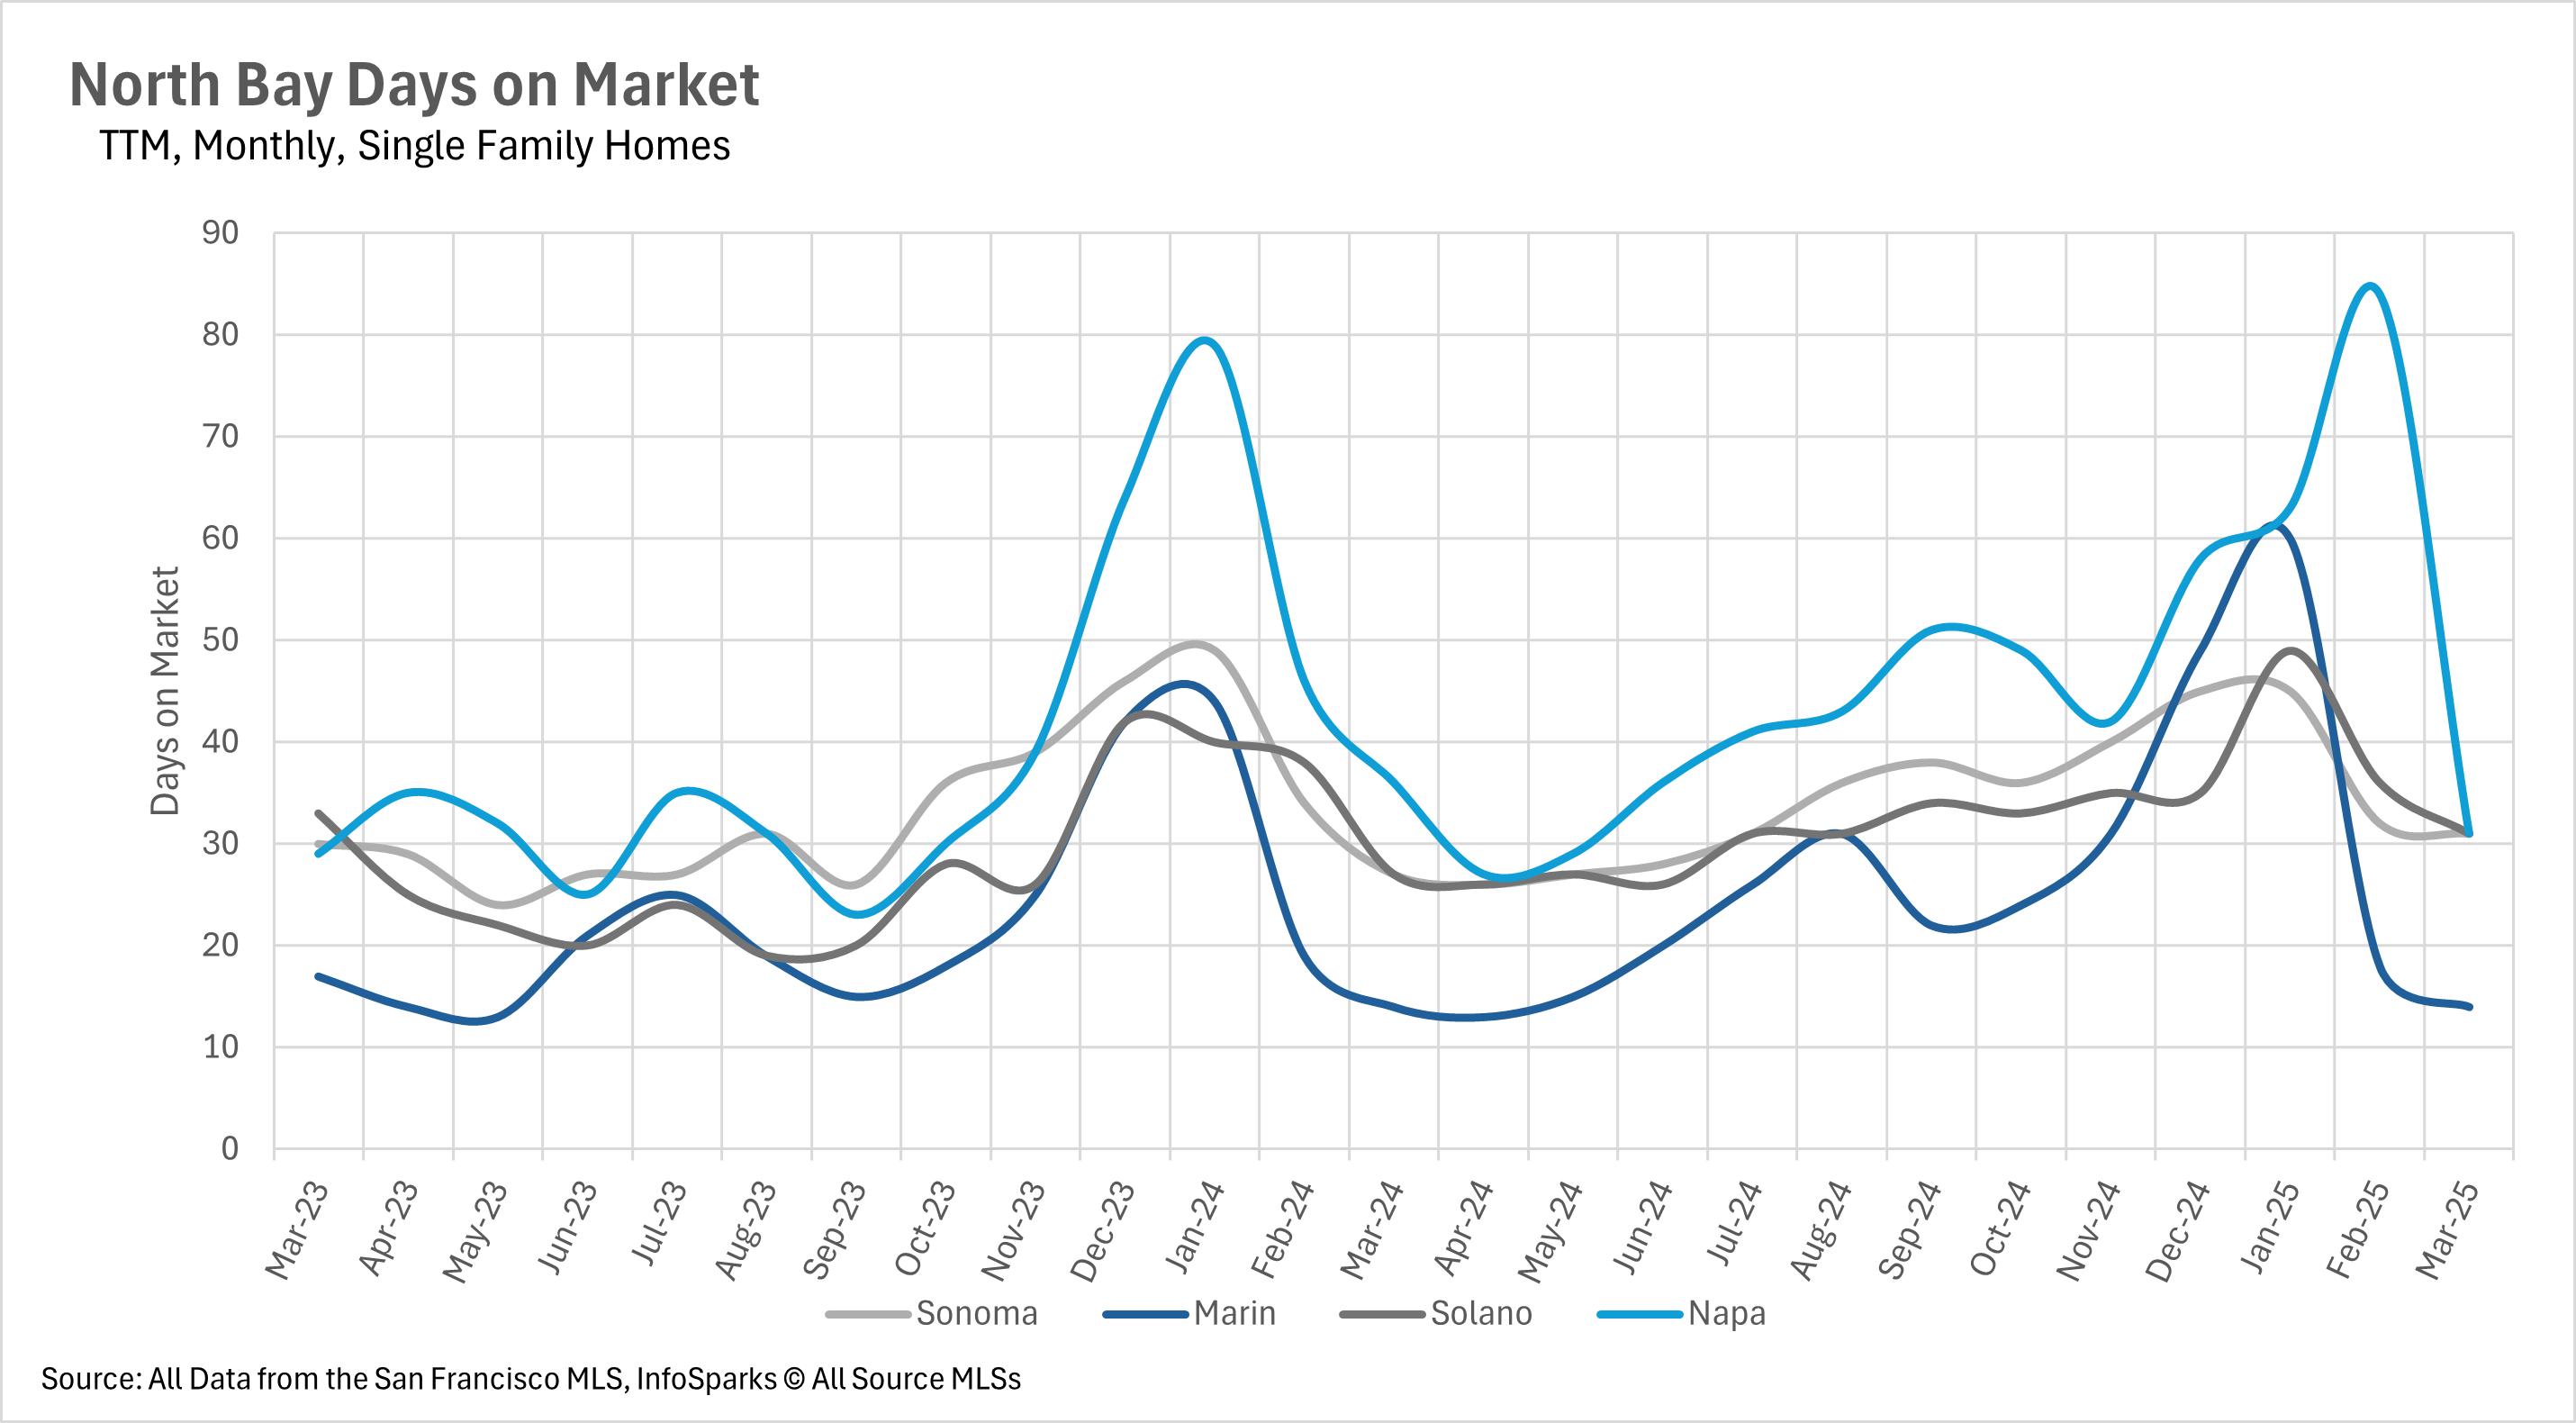
Despite falling inventories, homes aren’t selling any faster
If you were to hear that inventories are falling, while demand remains steady, you might assume that homes are selling faster. However, this isn’t the case in the North Bay. Despite lower inventory levels and fewer new listings, we saw the median home in Sonoma and Solano counties spend roughly 15% more time on the market than this time last year, and the median listing in Marin County spend the exact same amount of time on the market. However, in Napa County, homes are moving around 14% faster than they were around this time last year!
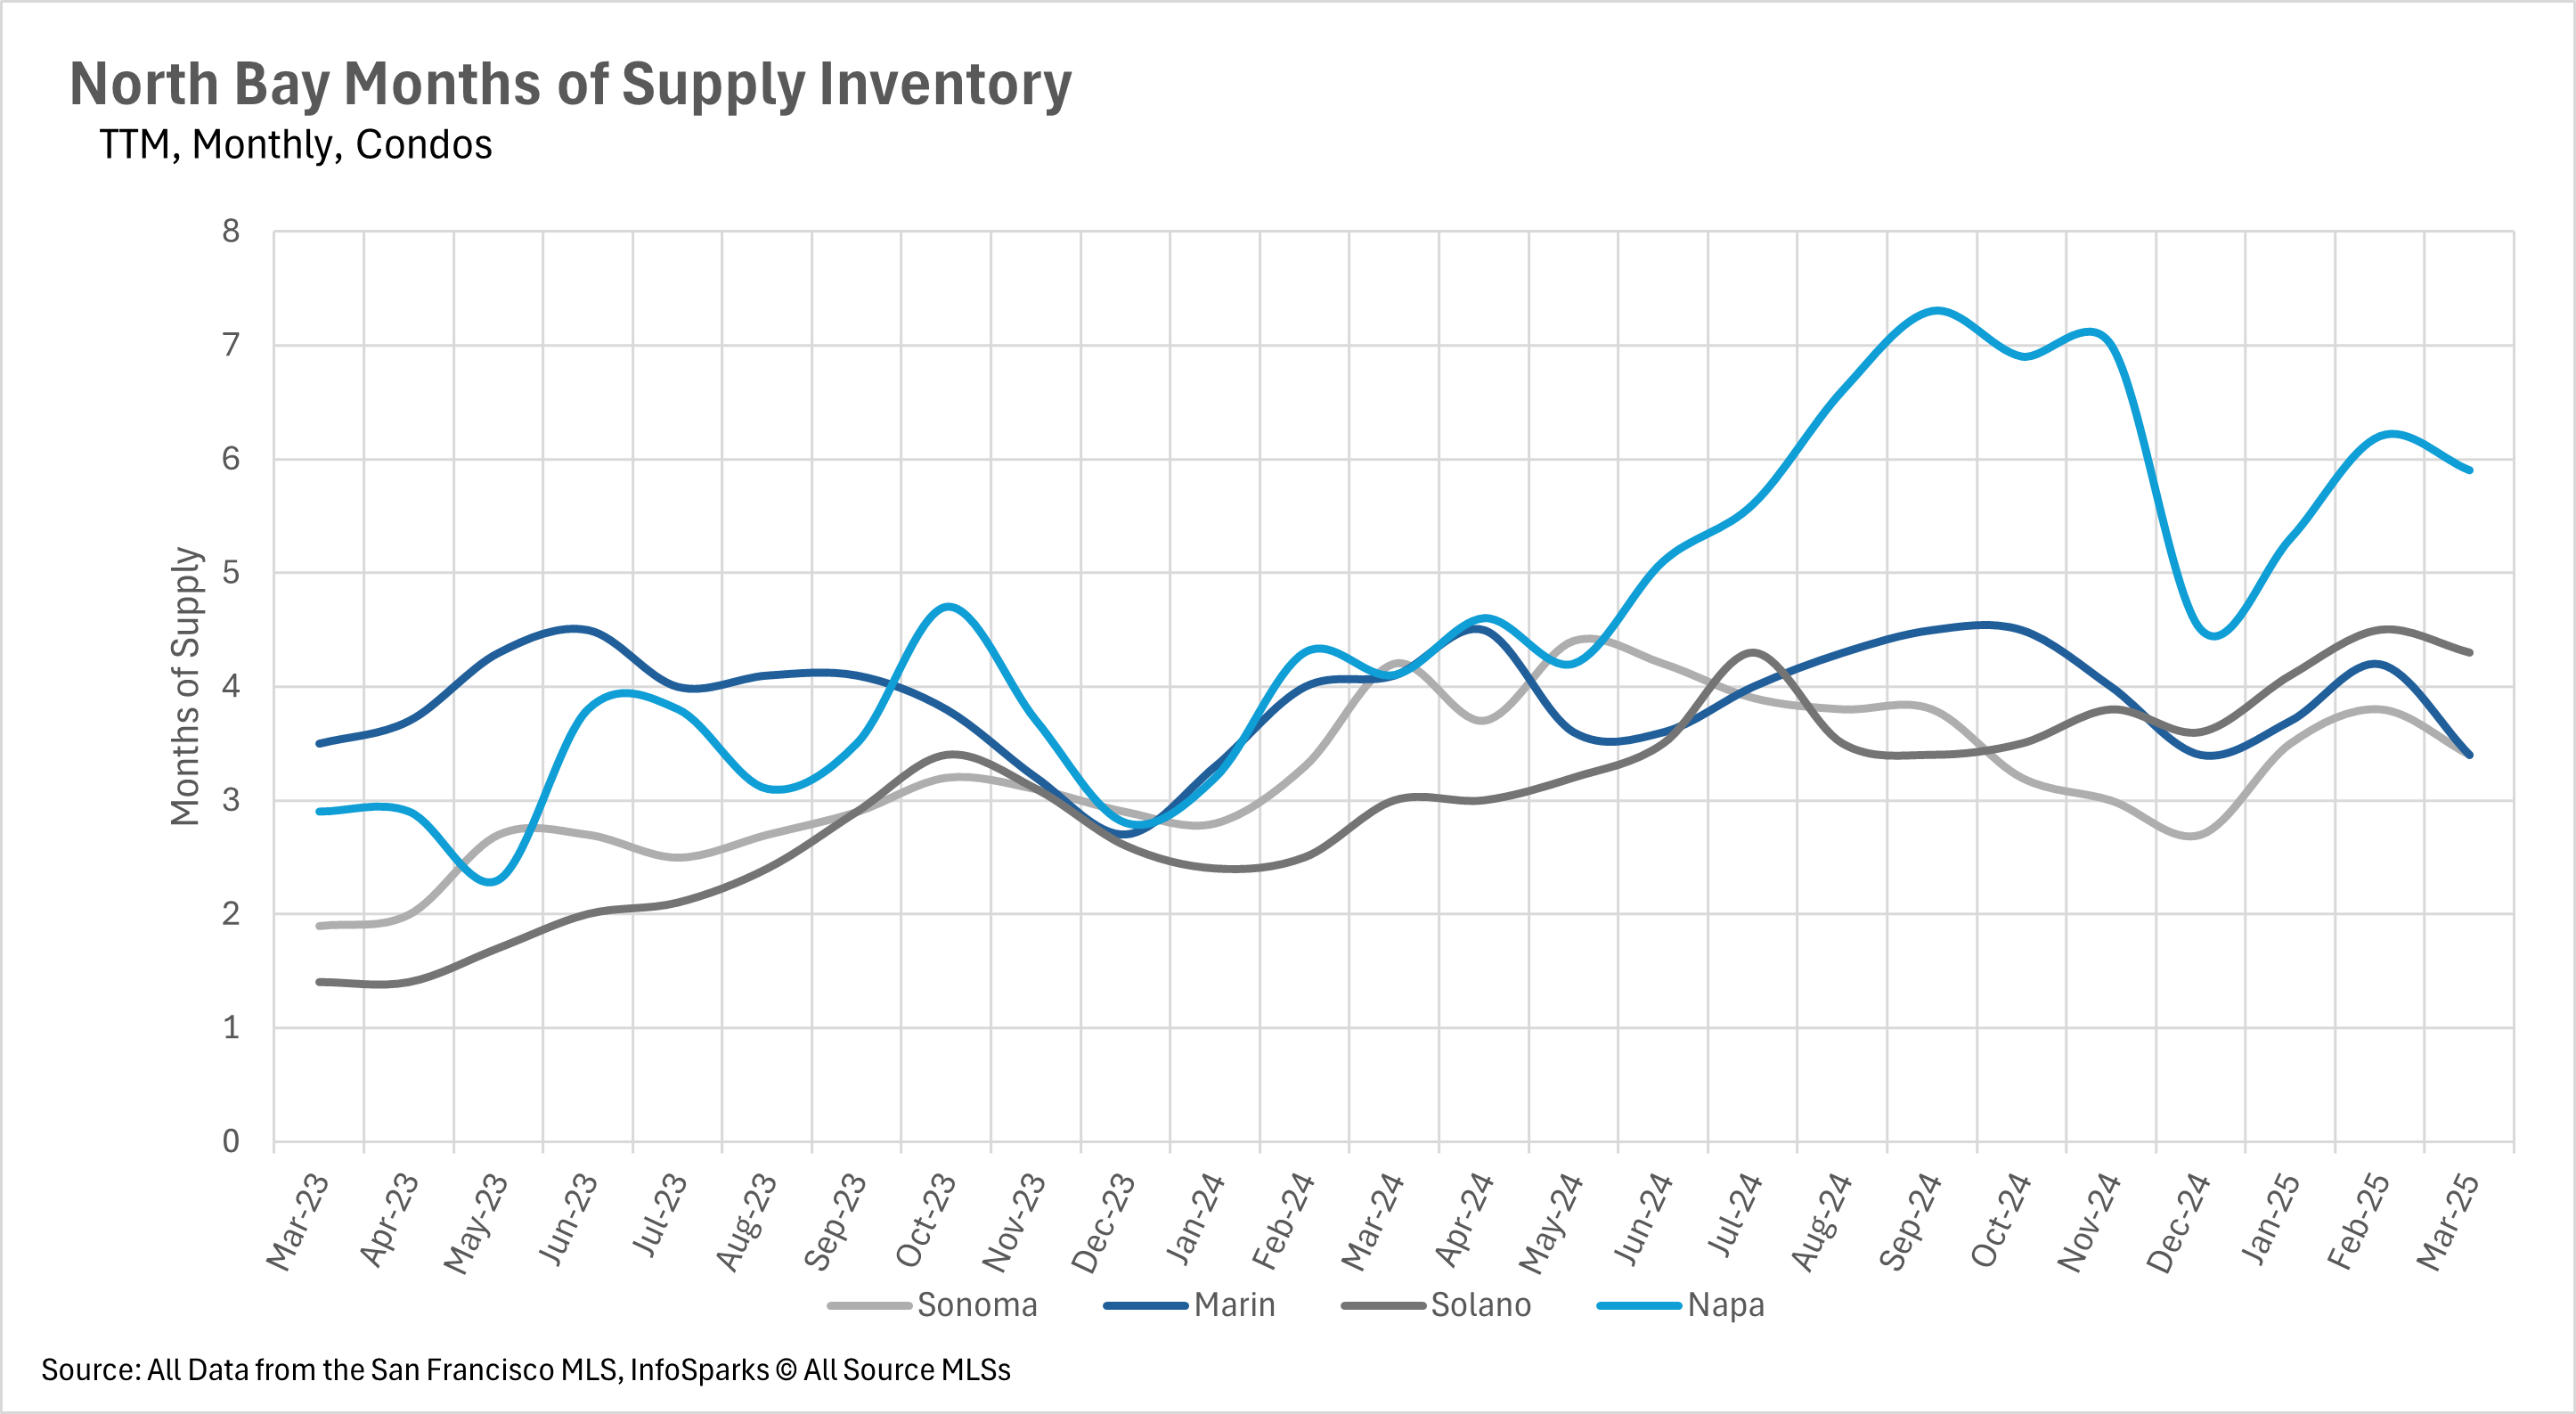
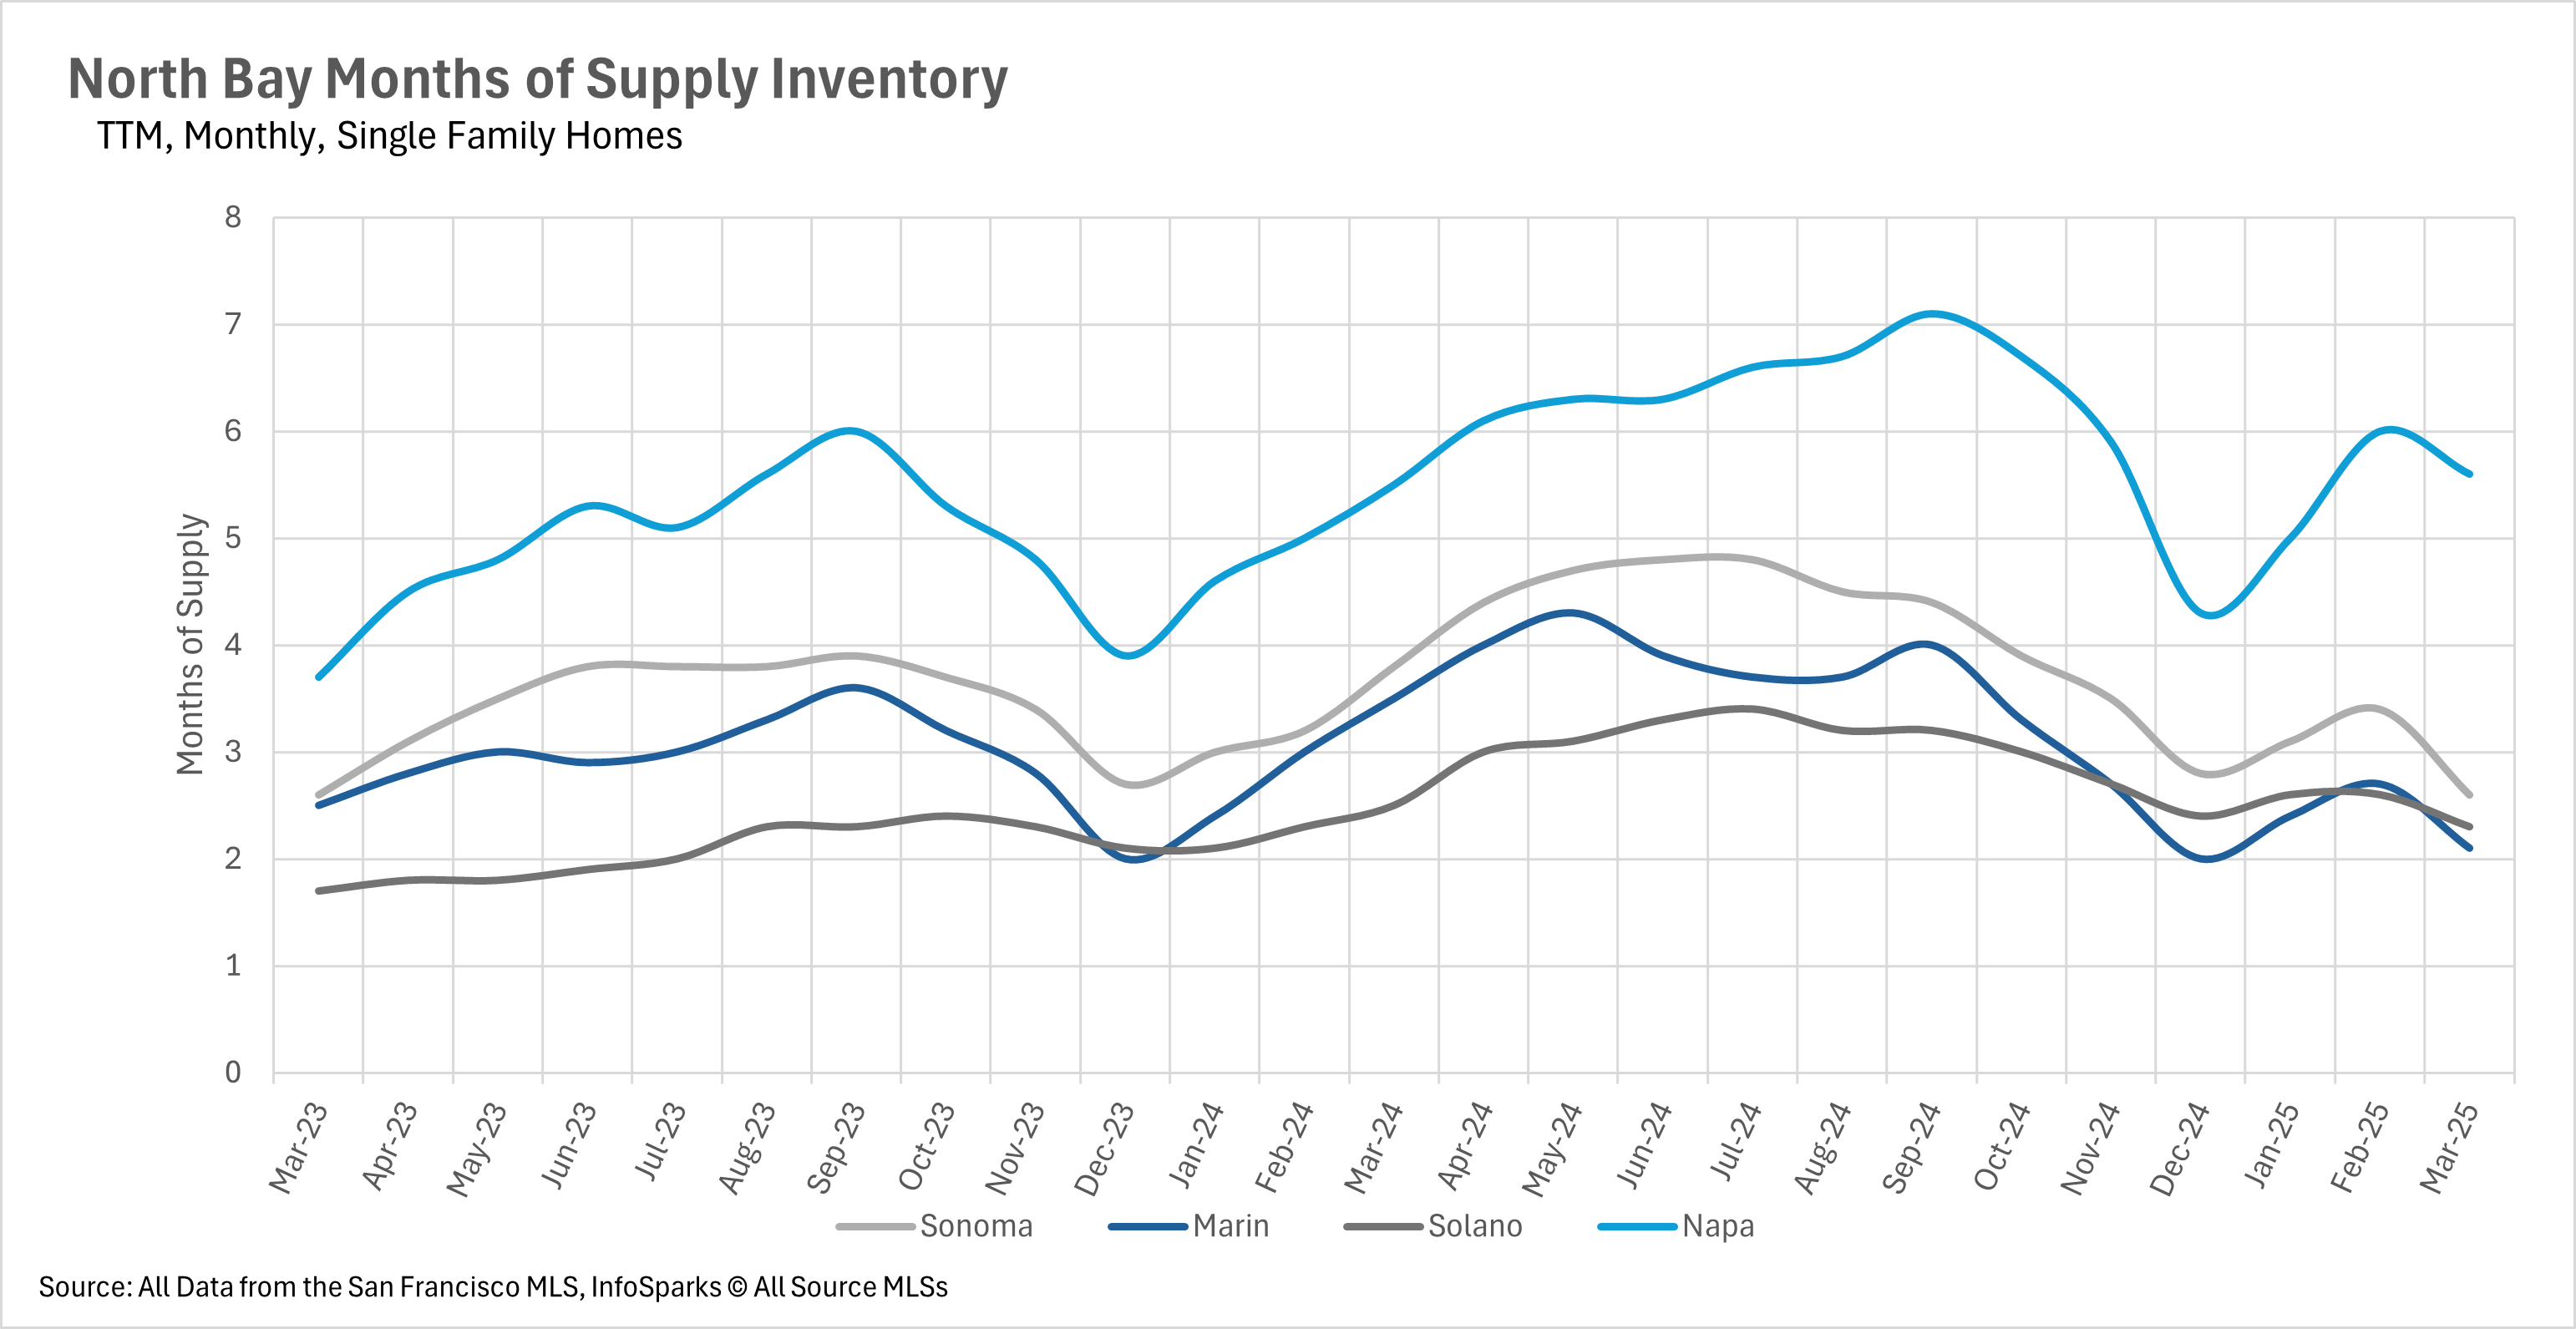
Sellers in Sonoma Marin, and Solano Counties gain bargaining power, while buyers retain the bargaining power in Napa County
The real estate market in California has historically averaged around three months' worth of inventory on the market at a given time. This means that whenever inventory levels drop below three months' worth of supply, an area is in a seller’s market. On the flip side, if inventory levels are above three months' worth of supply, an area is in a buyers’ market.
As inventories shrink throughout the North Bay, it’s no surprise that sellers are gaining back some of the bargaining power that they lost over the course of the past couple of months. At this point in time, there’s around 2.6 months’ worth of supply on the market in Sonoma County, 2.1 months in Marin County, and 2.3 months in Solano County. However, Napa County remains a buyers’ market, with roughly 5.6 months worth of inventory listed on the market right now!