Today’s blog post comes courtesy of the legend himself, Tim McMullen. When he’s not cruising Tiburon and soaking up rays, you can find him killing the real estate game. You can catch him at this site, meettimmcmullen.com. His original blog post can be found here.
The real estate market is changing at various speeds in different areas of the United States. Urban markets have undergone robust recoveries after a harsh epidemic. However, suburban and rural real estate sectors are beginning to show signs of deterioration following an insane early Summer.
The single-family housing market in many Bay Area regions has exploded over the last year. Some believe it has gotten to the point that purchasers are now seriously wondering if markets are overheated. As a result, many are choosing to hold off until things cool down.
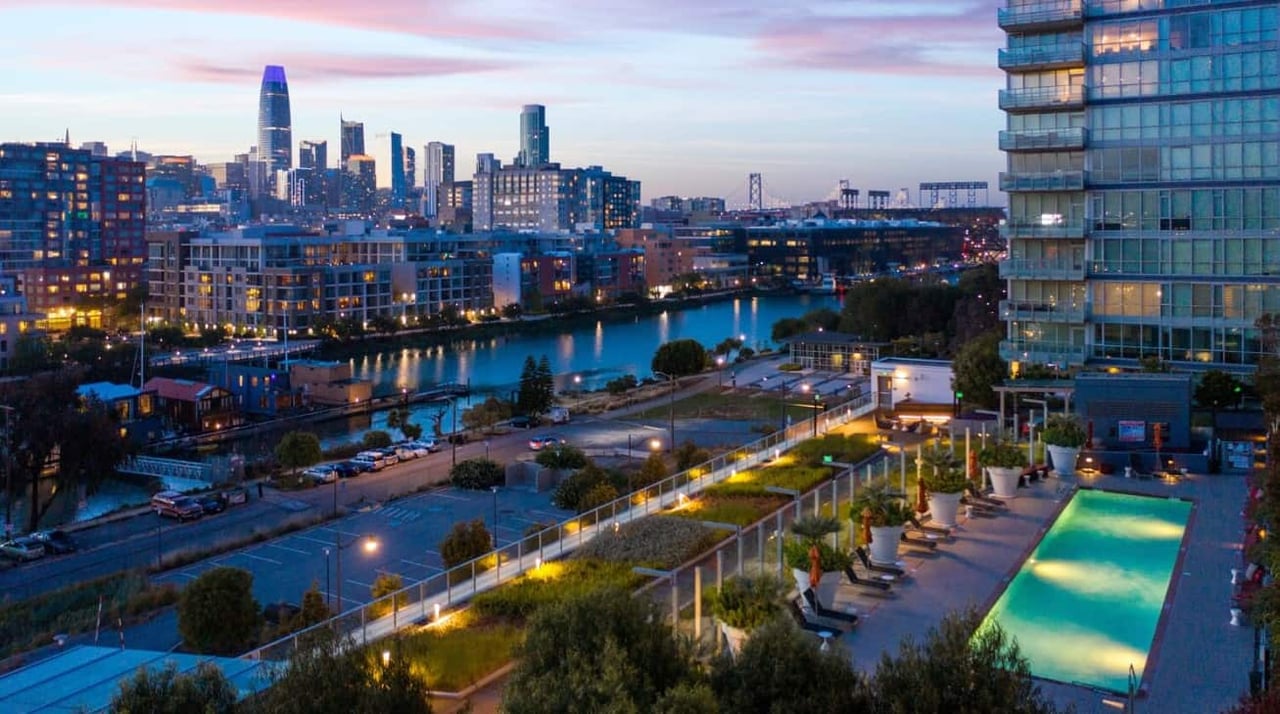
The Mission Bay neighborhood in San Francisco has witnessed substantial shifts in real estate trends this past year. This post will look at the condominium market in Mission Bay, as well as pricing, volume, and developments ahead.
The pandemic had devastating consequences for the SF condo market. Downtown was particularly hard hit. It is still recovering from the substantial cultural shift that society has undergone in the last 18 months.
In the early summer of 2021, it appeared that the market had fully recovered, with Buyers Flooding Back To Mission Bay (an article I wrote last year). The market had returned to similar median sales prices (both final sales price + price per foot) in 2019. We were seeing a lot of people flock to homes with outside patio space. We even sold an amenity-level unit at Madrone before it hit the market in May, something few of us could have imagined just 6 months ago.
San Francisco was slow to sell in August 2021, owing to the fact that it is a non-selling month on the real estate calendar. Due to strong tech pushing back-to-office dates back from September 2021, the delta variant added insult to injury.
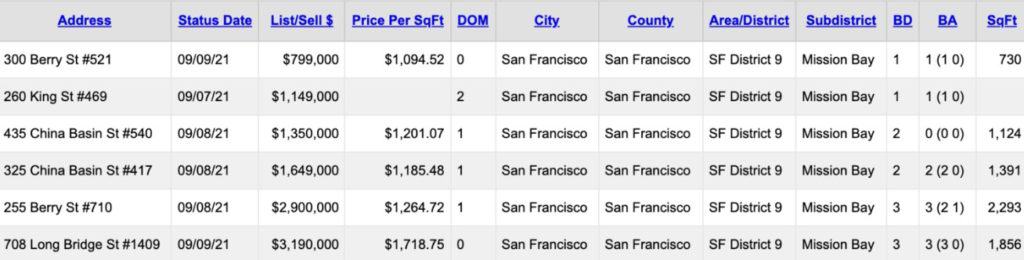
Average Sales Price In Mission Bay since 01/2020
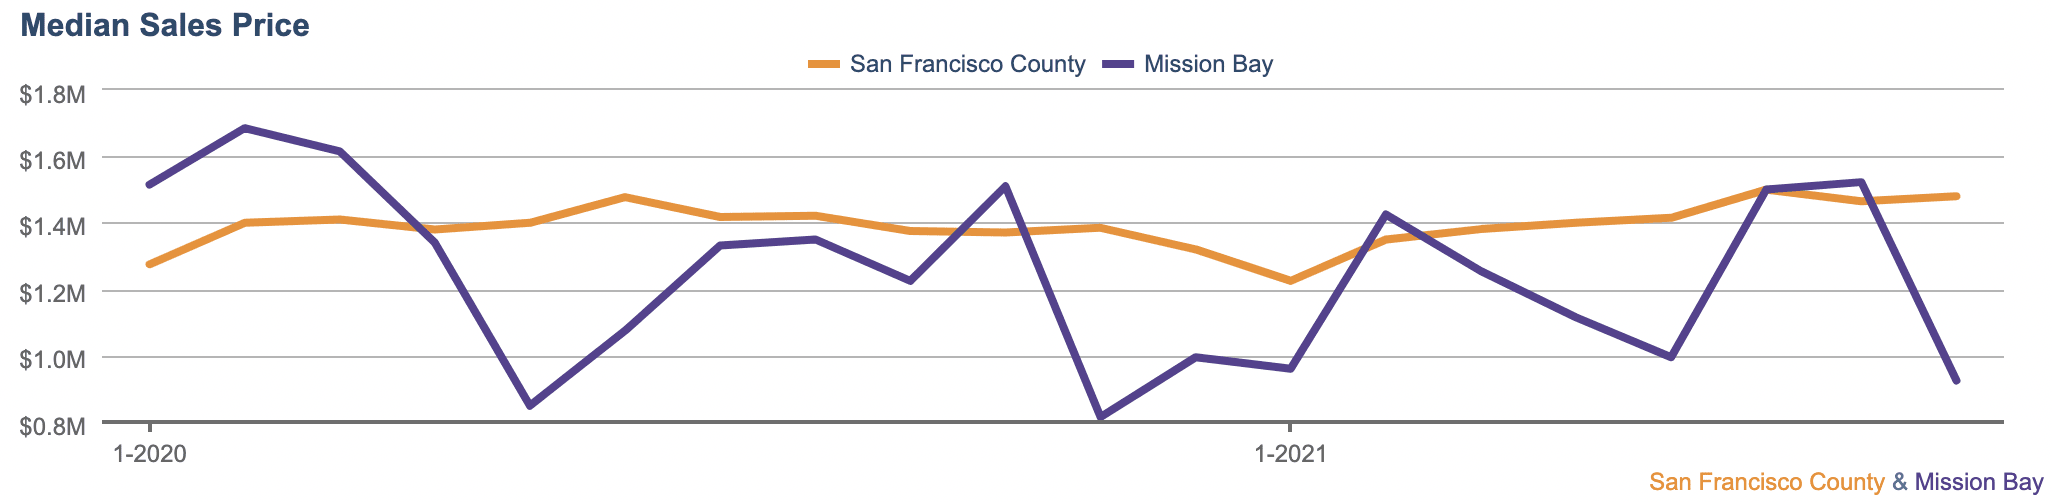
The above graph doesn’t tell the whole story, but it does highlight what we saw in August: just two condo sales surpassing $1.3 million were ratified/closed. There were a few one-bedroom sales, which is consistent with the idea that August is when savvy purchasers search for opportunity. Those who are more affluent/those with disposable income are often on holiday during August.
First-time buyers generally don’t have the same level of mobility. Even though we all hoped it would be different this August, it wasn’t. The bulk of the sales occurred north of Mission Creek as well, which is a separate market to the south.
However, agents on all fronts are reporting a rise in showing requests as we enter the fourth week of September. Thank goodness.
One of the most unique units in Mission Bay is still available
2 Bed | 2 Bath | 1,267 sqft
Asking $1,698,000
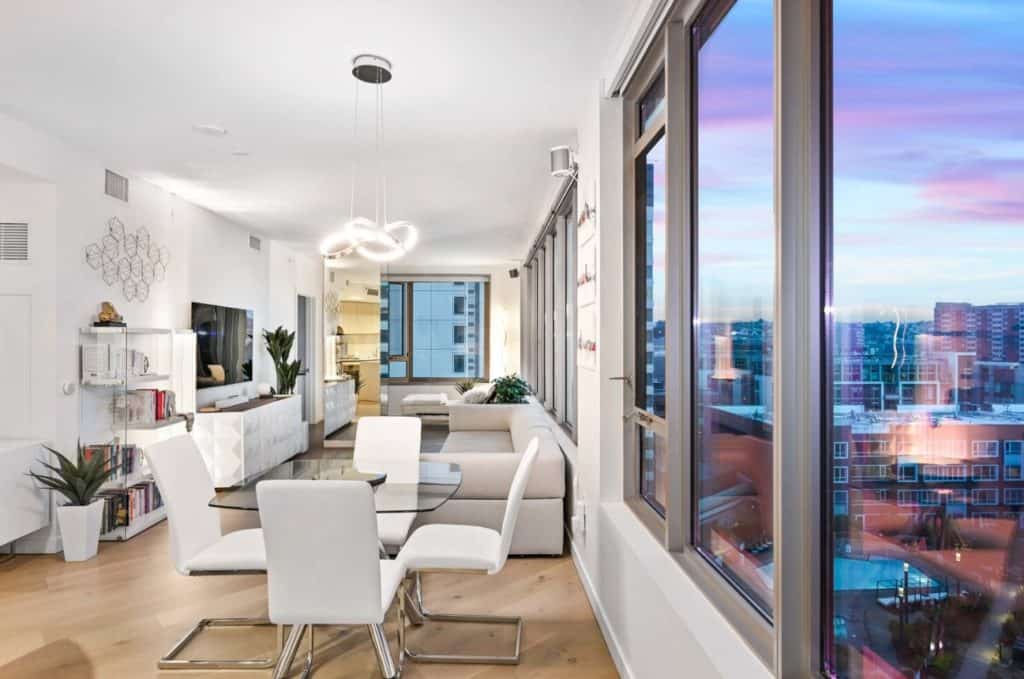
The unique and rare aspect of this residence is that it has a 180-degree south-facing orientation, with both the morning sun over the Bay in the primary bedroom window and the evening Twin Peaks sunset from the living room. Patios were no. 1 on people’s wish lists during the epidemic, but plenty of natural light in one’s home was a close second.
Book a private showing through this Calendly link.
After Labor Day weekend (ie, the last weekend before school begins), we frequently see a deluge of property listings.
We’ve already seen six new listings hit the market this week in Mission Bay, with two stunning penthouses priced at more than $2.9 million.
In a typical San Francisco selling cycle, we observe a peak in the number of Pending sales (offers that have been accepted) in October.
Total Pending Sales In SF County Over The Past 5 Years
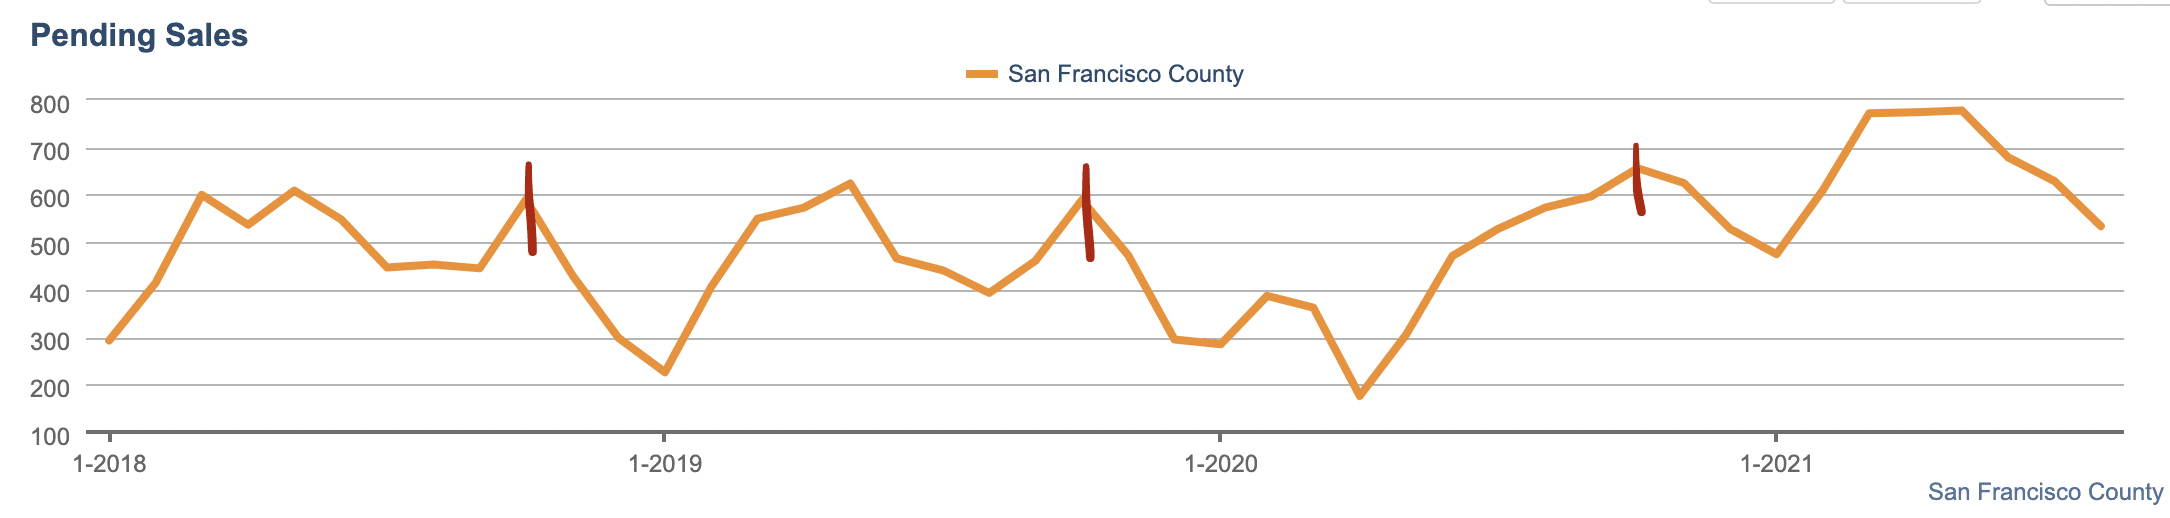
Now that our beautiful city has experienced a Summer with all restaurants, dining & entertainment open under the new normal, it is hard to see this trend looking any different in 2021.
Price Per Foot For Condominiums In SF County Since 01/2018
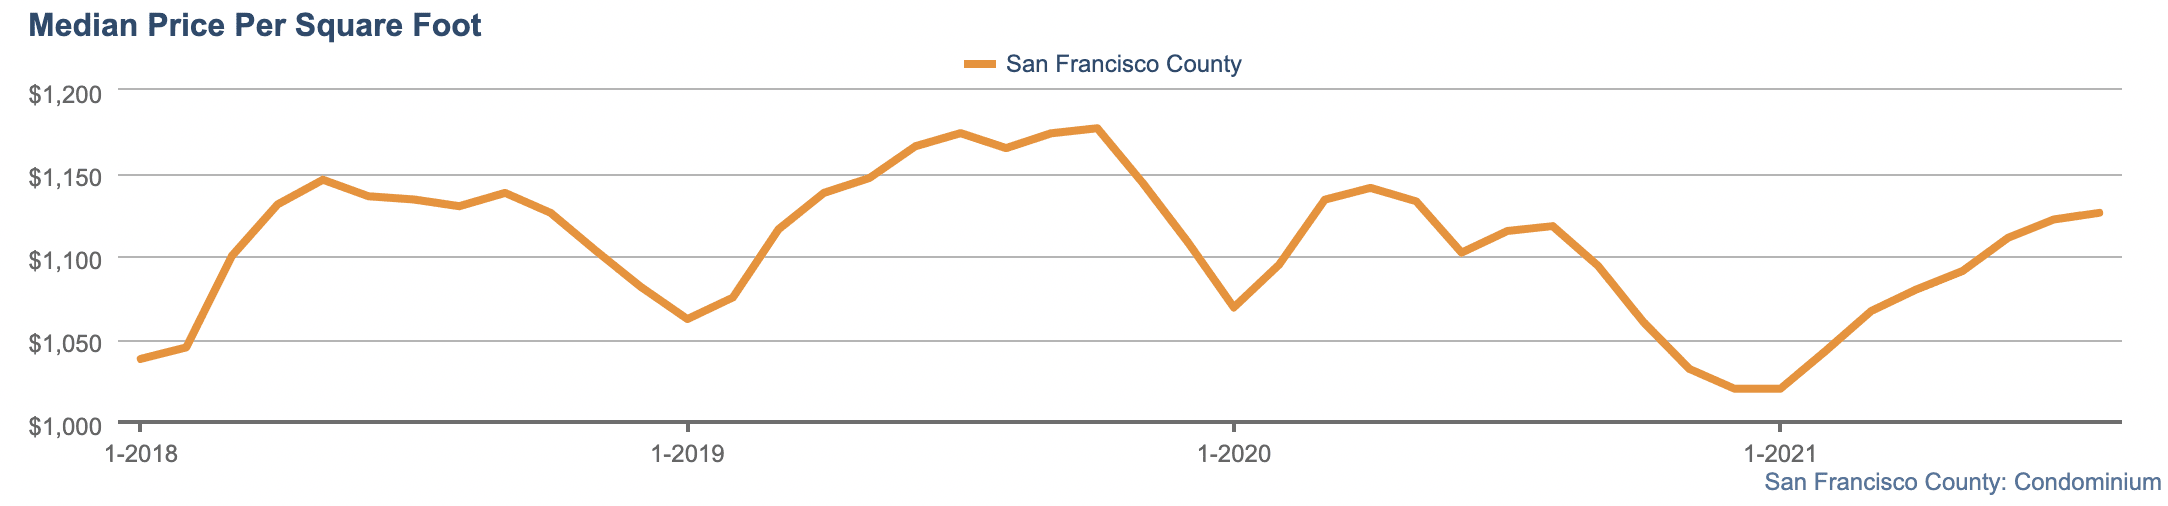
The condominium market is notorious for its cyclical nature, with highs in the summer months from June to August and troughs during the winter. Price per foot is one of the most accurate aggregators of data in the condominium industry because it reflects actual averages people are prepared to pay per foot throughout the city.
The steep rise in housing costs from the beginning of 2020 can be seen in the $/foot lows around the end of 2020, which reflects a major lifestyle change as people leave San Francisco in favor of single-family houses and outside space. However, as you can see above, the market has been steadily climbing ever since.
Over the next few weeks, expect a flood of property listings to hit the market city-wide, as well as more sellers accepting offers over the next two months than we saw in August.