
Today’s blog post comes courtesy of the legend himself, Tim McMullen. When he’s not cruising Tiburon and soaking up rays, you can find him killing the real estate game. You can catch him at this site, meettimmcmullen.com. His original blog post can be found here.
The epidemic was a blessing in disguise for real estate in Noe Valley, San Francisco. The 2020 explosion and 2021’s ongoing increase show that this area’s real estate prices can never return to pre-pandemic levels. Buyers still want outside space and parking, which have been difficult to come by thanks to a lack of supply/availability during the pandemic.
For the first few months of 2018, there was a lot of competition for anything new that came out. However, the summer sales hype appears to have come to a halt in August, which is typically a slow month in San Francisco.
With the city’s southern reaches being far more pleasant than those in the north, Noe Valley’s streets are consistently bright all summer long and throughout the year, resulting in the majority of Single-Family Home interest on the southern half of San Francisco.
When the condominium market went dry in April 2020, buyers redirected their attention to desirable San Francisco neighborhoods that offered a more tranquil lifestyle, fresh air, and outside space.
Noe became San Francisco’s hottest neighborhood almost overnight, surpassing well-known neighborhoods such as Pacific Heights and Presidio, thanks to the fact that most of downtown San Francisco’s residents were connected to the Silicon Valley or had connections to the peninsula. For a reasonable length of time, Noe had a 1-Week Market.
The real estate market was thrown a curveball in early August, when Back To Office for all major businesses was delayed from September 2021 to January/February 2022. In conjunction with San Francisco being the slowest real estate month of the year, individuals who leave the city to enjoy the rest of summer in a more pleasant climate had no motivation to return to house hunting in August.
The school year has also begun, which sets the tone for most of the market’s buyers, who are familiar with the school calendar. But not this year, unfortunately.
Days on Market | NOE VS SF for Single Family Homes
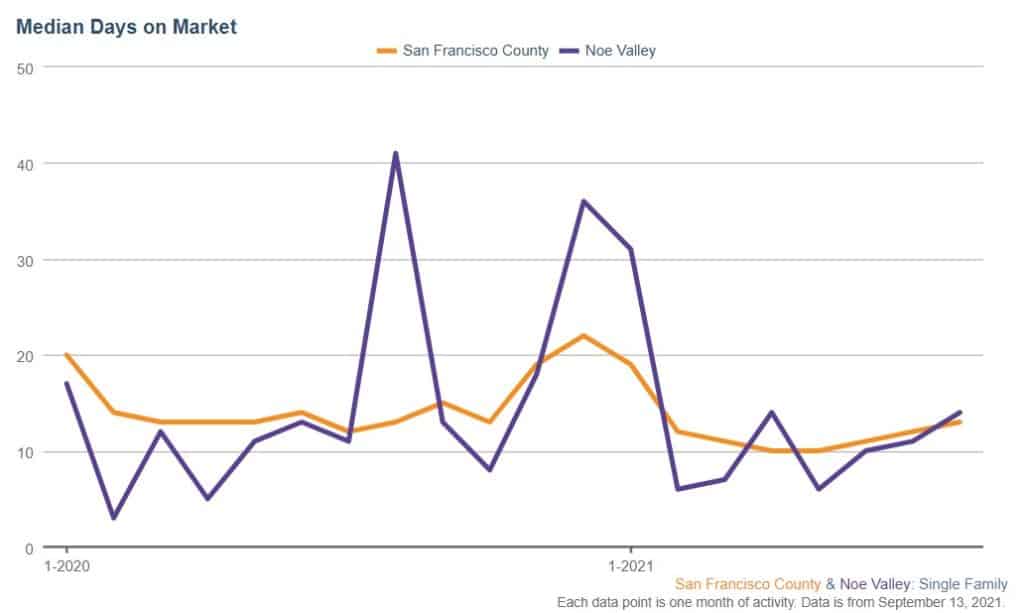
In Noe, the number of days on the market for single-family homes has been rising since May; At one point in May, we hit a monthly peak with houses staying on the market for just 6 days! That’s as fast as I’ve ever seen a monthly average for such an urban neighborhood.
Price Per Foot | NOE VA SF for Single Family Homes
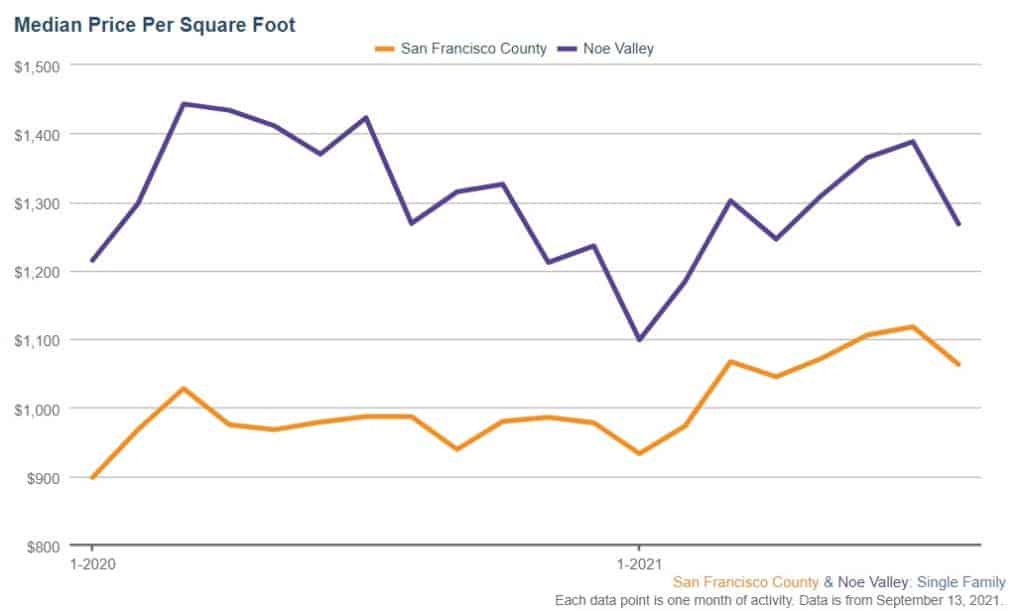
The cost per foot for single-family houses fell by over $100 in August, indicating that we’re in a transitional market. The more desirable homes/buyer bidding wars occur when there are the most potential purchasers in the market (post-Labor Day).
However, a basic retort is that anybody who is seriously interested in purchasing a house (especially when the median price is $2M) is constantly in the market throughout the summer and ready to act at a moment’s notice, regardless of where their real position may be.
My hypothesis is that after the feeding frenzy that took place between March and June, buyers started to perceive the market as excessively inflated and became less eager to give offers considerably over the asking price. This caused real estate professionals to begin pricing homes more openly rather than advertising properties for $1,499,000 when you knew they would sell for around $2,000,000.
The buyer’s confidence had been eroded, and that was entirely justified. This pattern was also evident in other parts of the Bay, most notably Mill Valley, where the hottest 2-month period in real estate history occurred from May to July of this year.
Yes, prices may continue increasing, but not by enormous amounts. There must be some measure of predictability and consistency in order for price hikes to make sense. Buyers will stop withdrawing their money if price increases are too significant.
Price Per Foot | NOE VS SF for Condominiums
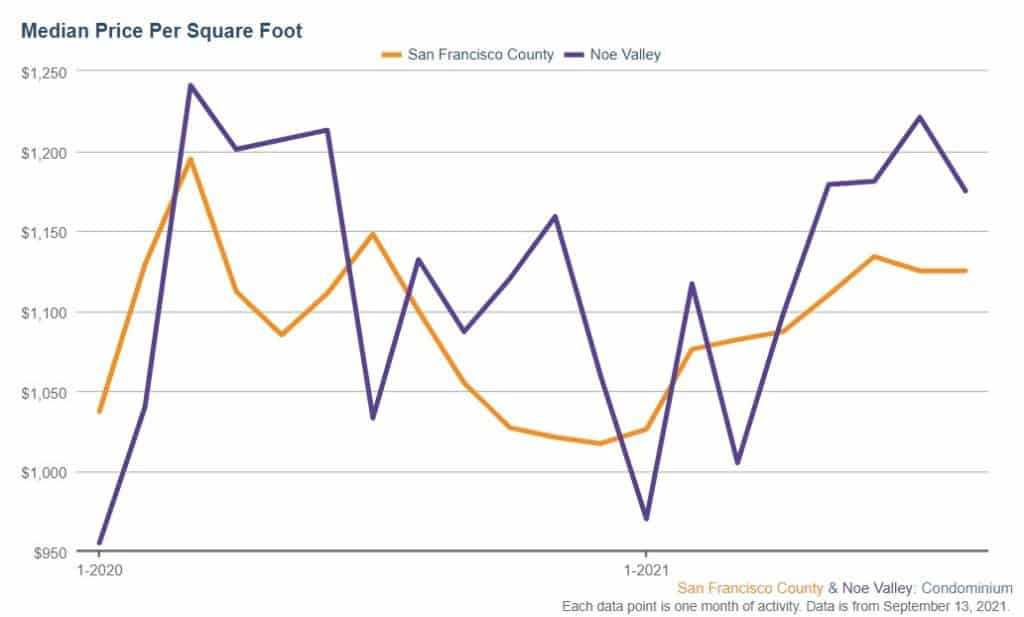
The condo market also dropped by approximately $50 per square foot in August.
Median Sales Price | NOE VS SF for Condominiums
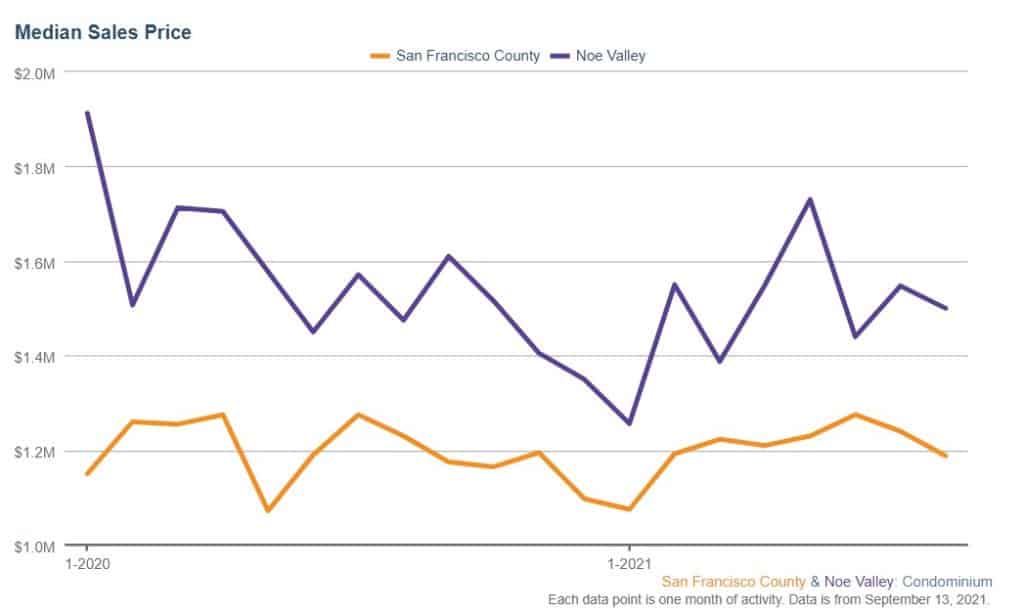
However, the neighborhood’s average price is still greater than $1,500,000, making Noe Valley one of San Francisco’s most costly places to purchase a house.

A beautiful SFH listed by Lamisse Droubi | 3817 26th St
Between Labor Day and Friday 9/10, there were 25 new listings or “Coming Soon” properties available for sale. It’s reasonable to assume that buyer demand will return swiftly, with a normal Fall market; with peak prices/total deal volume by mid-late October.
If you’re thinking about putting your home on the market in 2021, now is the moment to list. Do not wait until October or November because you risk missing out on demand.
Contact one of our San Francisco specialists for a consultation today.