
Updated October 19, 2026.
What’s Driving San Francisco’s Housing Market Right Now
San Francisco Market at a Glance:
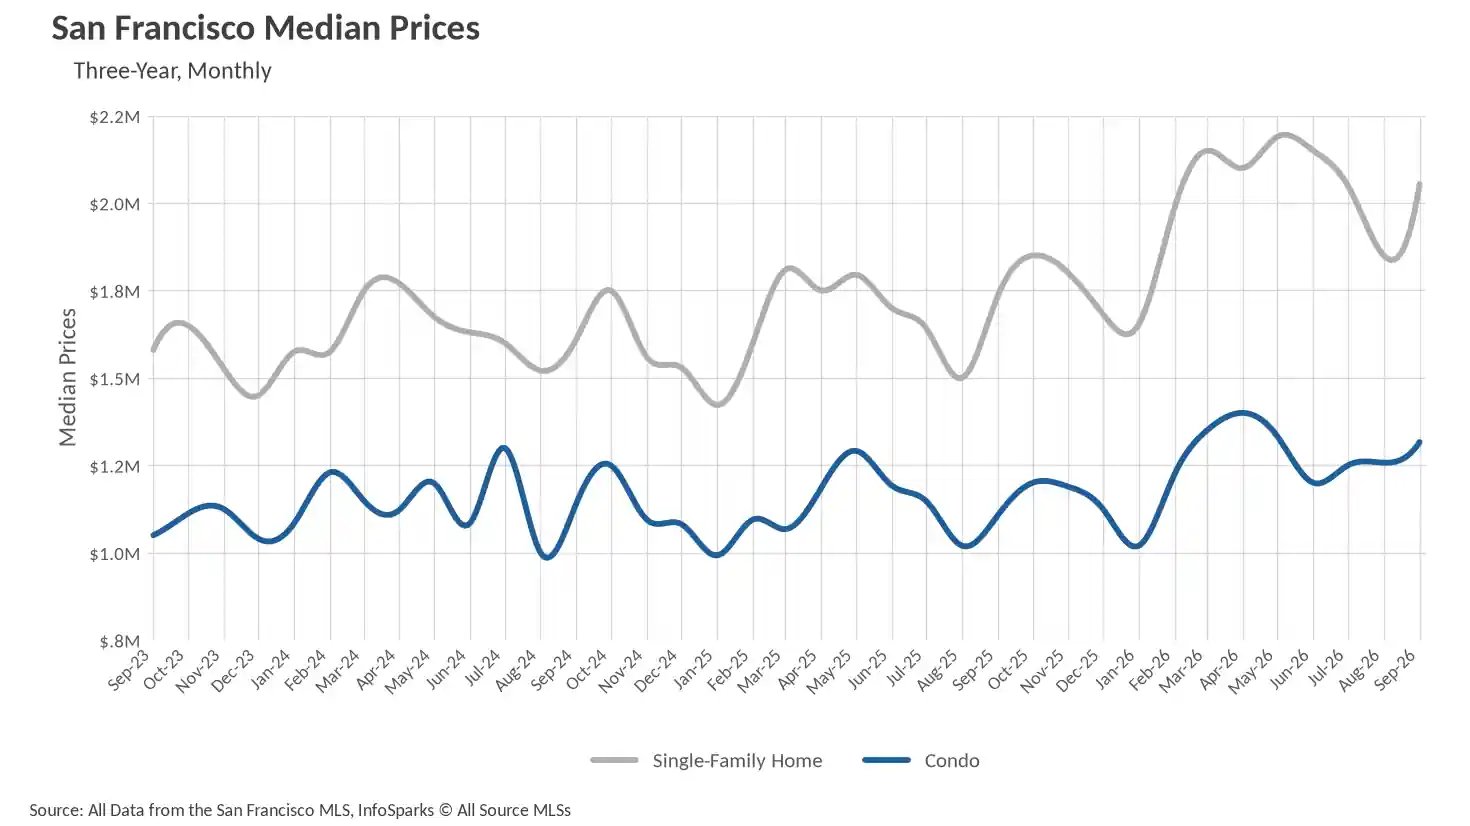
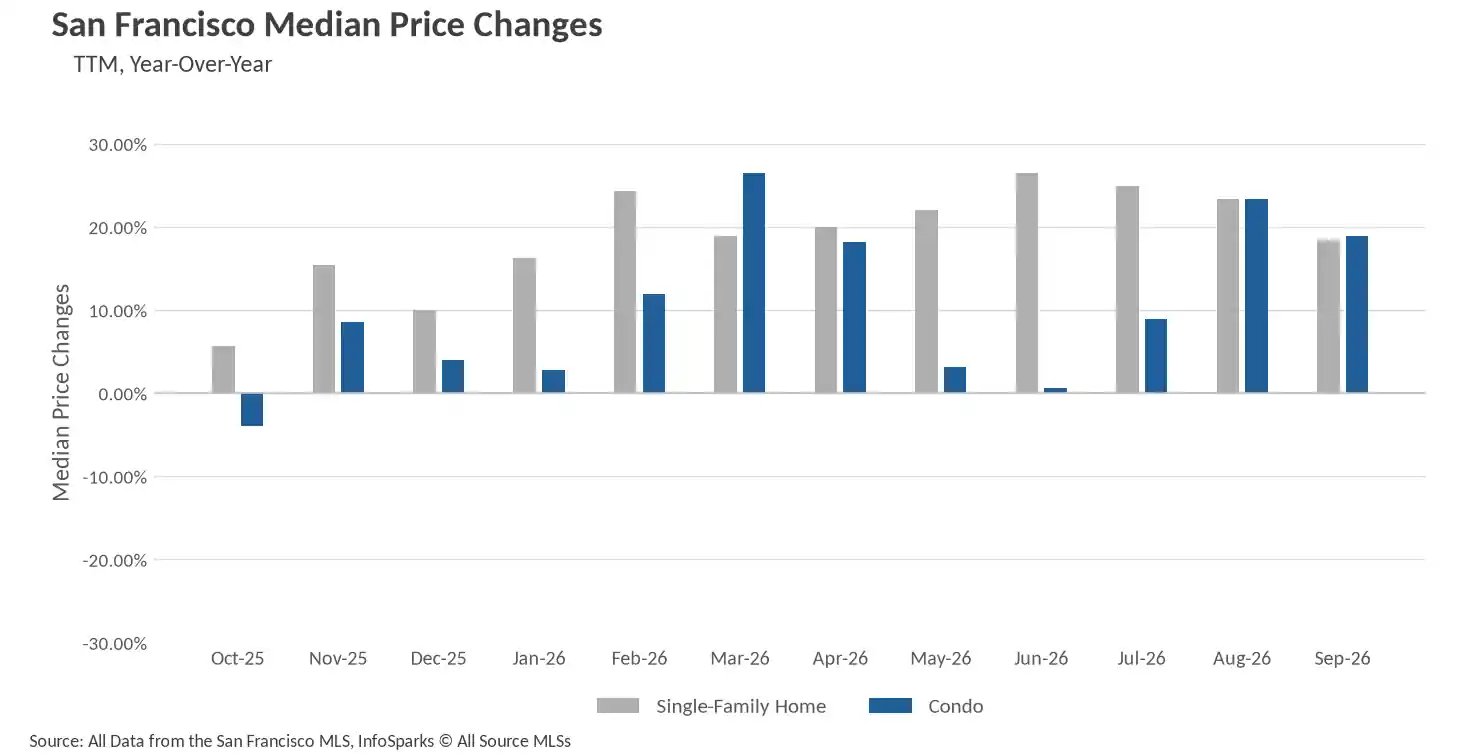
- The single-family median sale price jumped back above $2 million in September, finishing 18.4% higher than a year ago at $2,054,000.
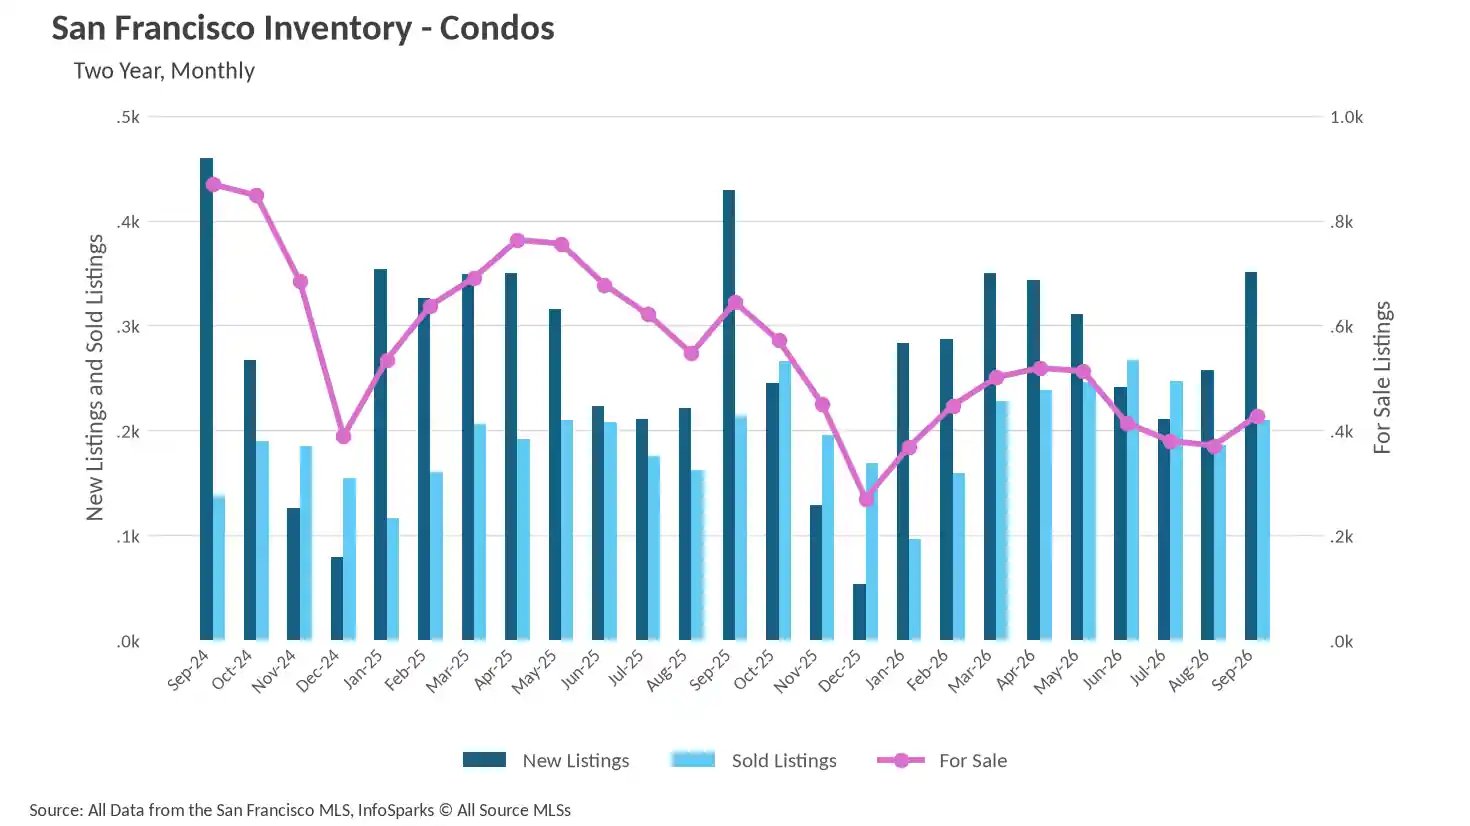
- Inventory rebounded seasonally from the summer lows but remains far below last year, with single-family listings down roughly 25% and condo listings down nearly 34% year-over-year.
- Single-family homes continue to sell in 12 days, while condos have accelerated dramatically to just 14 days, down from 26 days last September.
San Francisco Housing Market Snapshot
Metric | Single-Family Homes | Condos |
|---|---|---|
Median sale price | $2,054,000 | $1,316,500 |
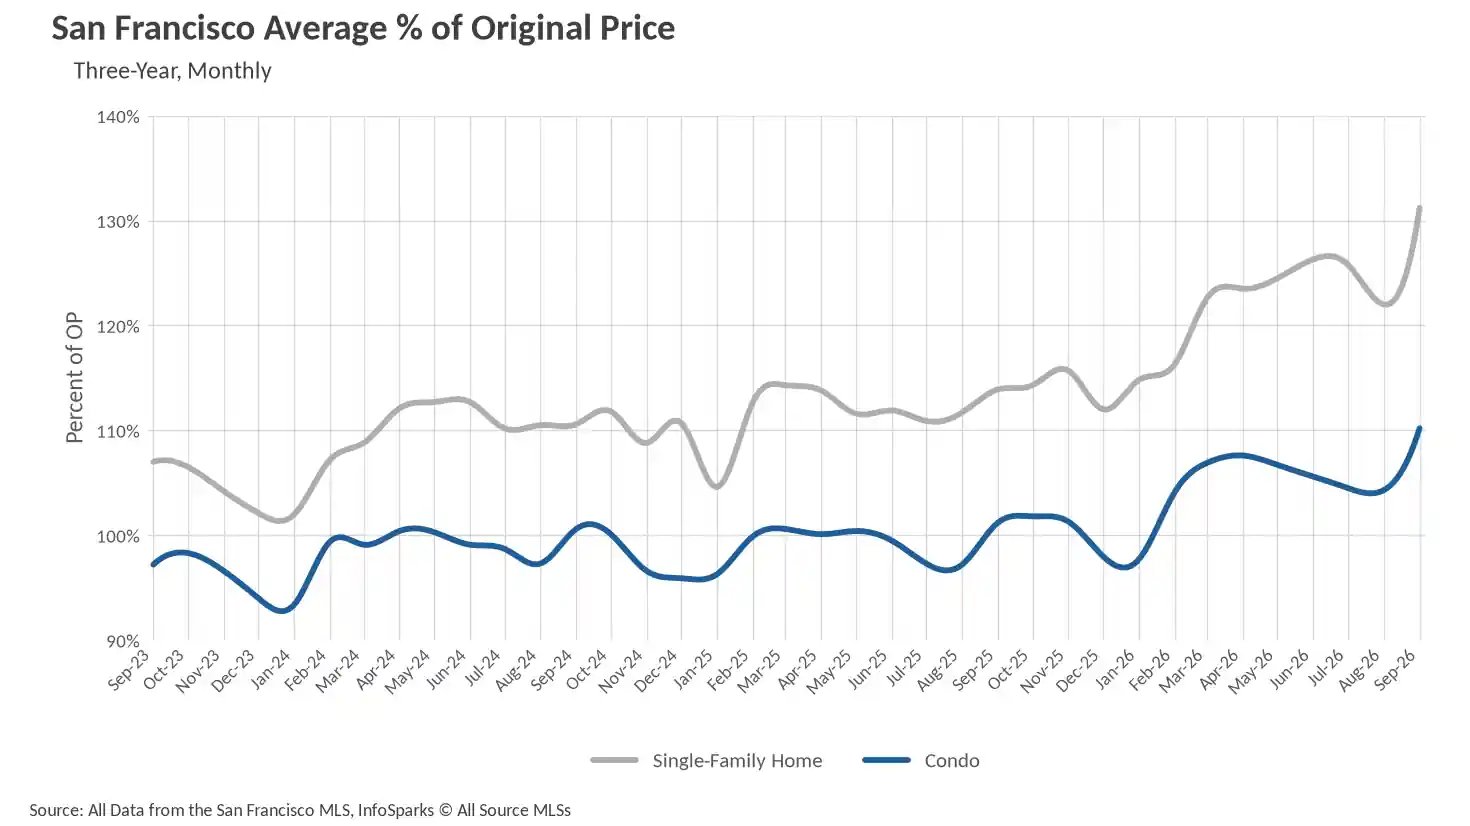
Sale price vs. original asking | 31% above | 10% above |
Homes for sale | 229 | 428 |
Average days on market | 12 | 14 |
Months of supply | 1.2 | 2.0 |
Note: You can find the charts and graphs for these figures at the end of this section.
*National Association of REALTORS® data is released two months behind, so we estimate the most recent month's data when possible and appropriate.
Home Prices in San Francisco: Median Sale Price and Bidding Premiums
August looked like a breather for San Francisco's single-family market, with the median falling to $1,850,000, but September erased that dip in a hurry. The median sale price climbed 11.03% month-over-month to $2,054,000, putting it 18.39% above the $1,735,000 recorded in September 2025. That keeps the single-family market firmly in the $2 million-plus range it has occupied for most of 2026, a level that was simply not part of the conversation at this time last year.
The condo market turned in an equally impressive annual gain. At $1,316,500, the median condo price rose 18.87% from last September's $1,107,500 and added 4.69% from August. Condos have now posted three consecutive monthly increases after cooling off from the April peak of $1,400,000.
The more telling story may be what buyers are paying relative to list price. Single-family homes sold for an average of 31% above original asking price in September, the highest figure anywhere in this three-year data set and up from 14% a year ago. Condos sold for 10% over original price, also a record for this series and a sharp move from the 1% premium recorded last September. Competition is not just steady, it is intensifying.
San Francisco Housing Inventory and New Listings
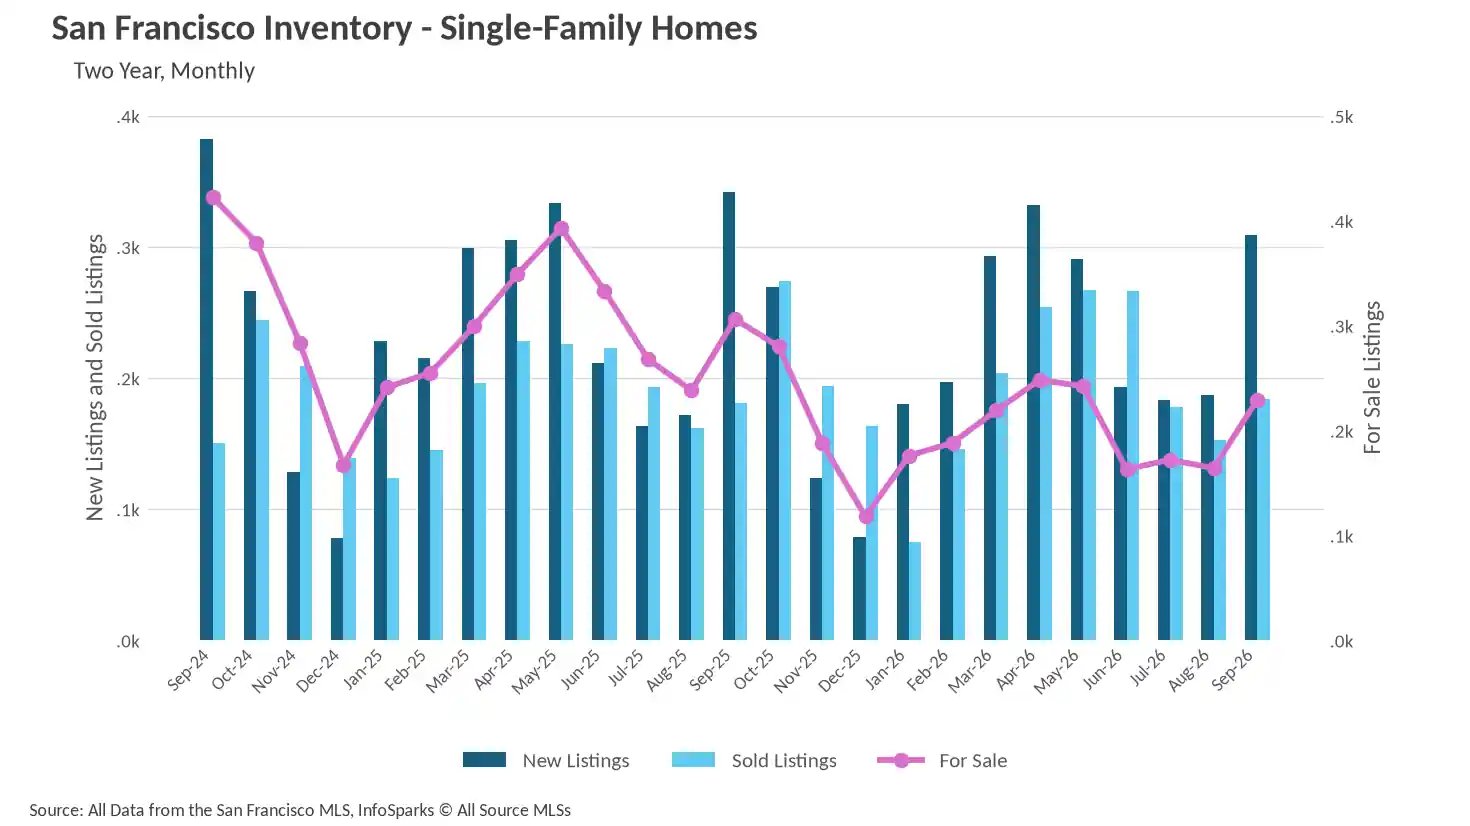
September delivered the seasonal restocking that San Francisco's market has been waiting for all summer. There were 229 single-family homes for sale at the end of the month, up 39.63% from August's 164 and the highest count since April. Sellers brought 309 new single-family listings to market, a healthy jump from 187 in August.
The problem is that this rebound still leaves the market well behind where it was a year ago. Last September there were 306 single-family homes for sale, meaning the current count represents a 25.16% year-over-year decline. New listings were also down 9.65% from the 342 brought to market in September 2025, even as sold listings held essentially flat at 184 versus 181. In other words, demand has held its ground while supply has thinned.
Condos tell a similar story with a steeper decline. There were 428 condos for sale in September, up 15.36% from August's 371 but down 33.54% from the 644 available last September. New condo listings came in at 351, an 18.18% drop from 429 a year ago, while 210 condos sold compared with 214 last September. Across both property types, roughly 650 homes were available citywide at the end of September, against about 950 at the same point in 2025.
How Fast Homes Sell in San Francisco: Days on Market
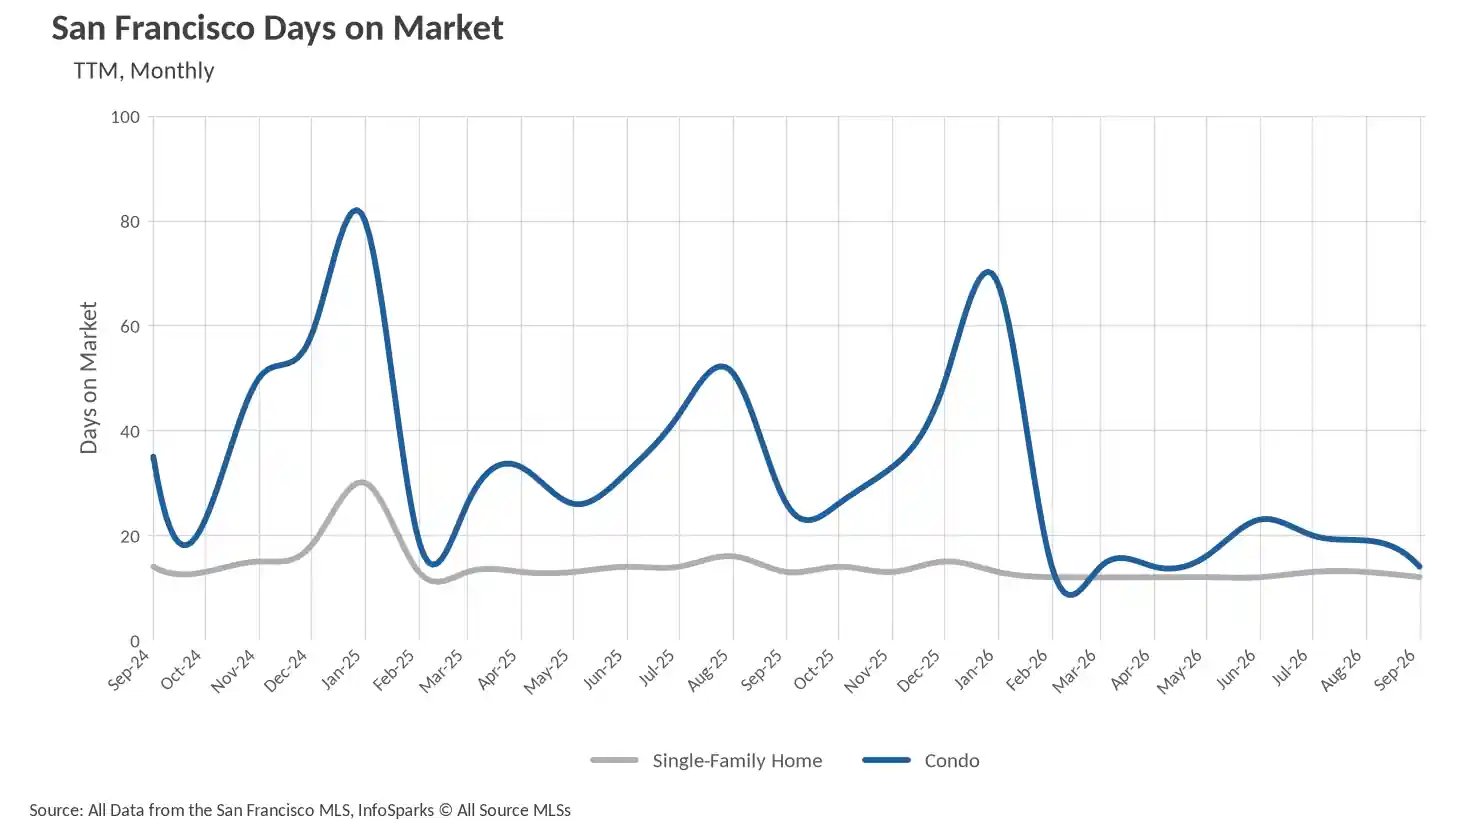
Single-family homes continue to move about as fast as they physically can. The average home sold in 12 days in September, down 7.69% from 13 days last September and consistent with the 12 to 13 day range that has held every month since February.
The condo market is where the real change has occurred. Condos sold in an average of just 14 days, a 46.15% improvement from the 26 days recorded in September 2025 and down from 19 days in August. That matches the fastest pace in this data set, equaling the 14-day readings from February through April. For context, condos spent 49 days on market in December 2025 and 68 days in January 2026. The segment that once gave buyers room to deliberate now moves nearly as quickly as the single-family market.
Is San Francisco a Buyer’s or Seller’s Market?
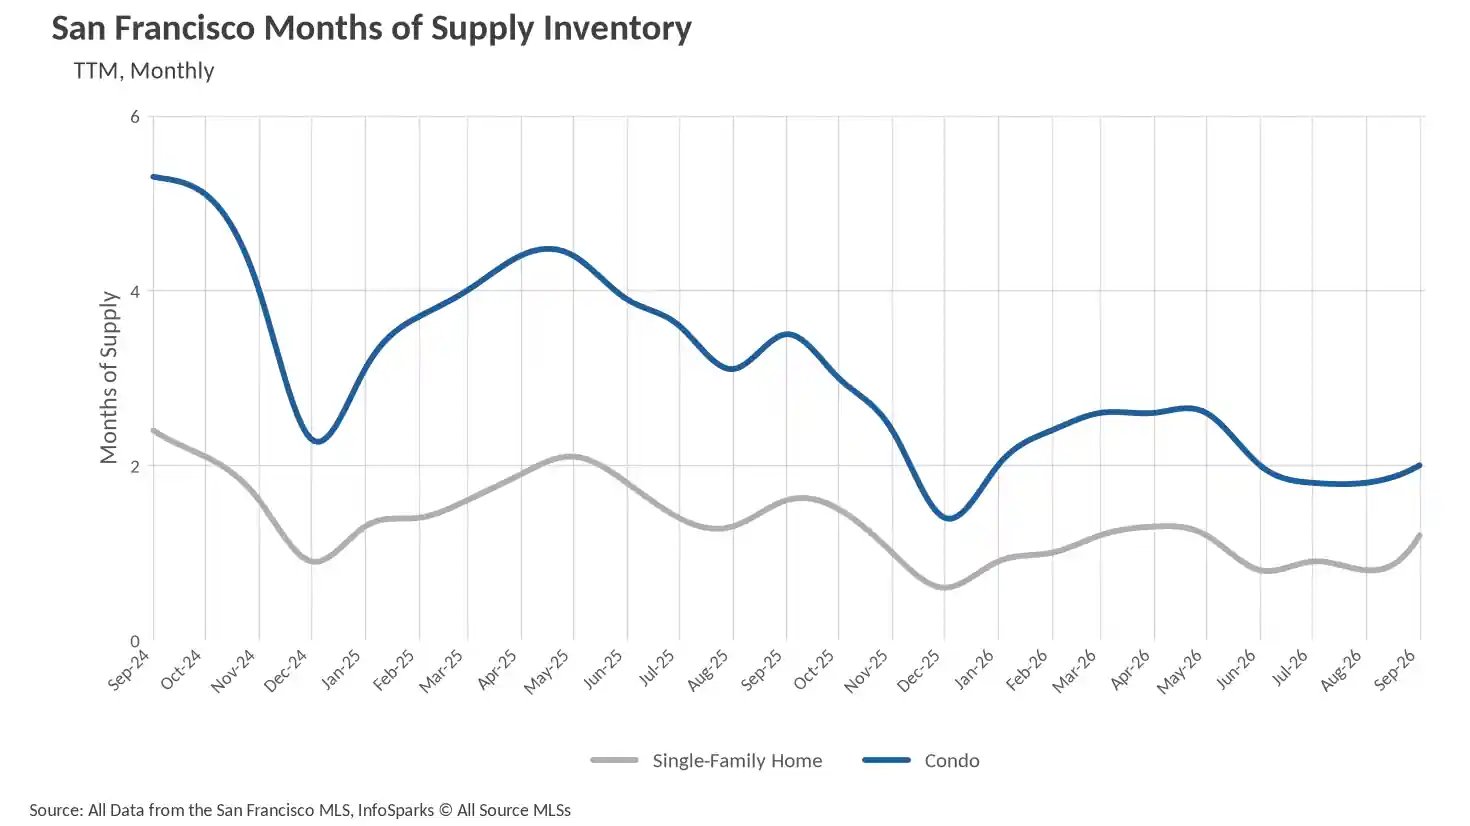
When determining whether a market is a buyers’ market or a sellers’ market, we look to the Months of Supply Inventory (MSI) metric. The state of California has historically averaged around three months of MSI, so any area with at or around three months of MSI is considered a balanced market. Any market that has lower than three months of MSI is considered a seller’s market, whereas markets with more than three months of MSI are considered buyers’ markets.
San Francisco sits well below that three-month benchmark on both fronts. Single-family inventory stands at 1.2 months of supply, up from 0.8 months in August as fall listings arrived but still 25% below the 1.6 months recorded last September. The condo market carries 2.0 months of supply, essentially flat with August's 1.8 months but down 42.86% from 3.5 months a year ago. That condo figure is particularly notable, because as recently as last spring the segment was running above four months and sat squarely in buyers' market territory. It has since crossed decisively onto the sellers' side of the ledger. With record-setting sale-to-list premiums, two-week marketing times, and supply running a quarter to a third below last year in both segments, sellers retain the upper hand heading into the final months of 2026.
Thinking about selling? Find out what your home is worth with a free home valuation or read our guide for sellers. Planning to buy? Start with our buyer resources and explore San Francisco neighborhood guides to see how conditions differ block by block.
San Francisco Housing Market Data: 12-Month Trends
Frequently Asked Questions About the San Francisco Housing Market
What is the median home price in San Francisco?
Based on the latest data, the median sale price is $2,054,000 for single-family homes and $1,316,500 for condos. Single-family prices are up about 18% from a year earlier, and condo prices are up about 19%.
Is San Francisco a buyer's or seller's market?
San Francisco is currently a seller's market for both single-family homes and condos. A market with about three months of supply is considered balanced, and fewer months favors sellers. Single-family homes have about 1.2 months of supply and condos have about 2.0 months, both well below that line.
How long does it take to sell a home in San Francisco?
Homes are selling quickly. The average single-family home sells in about 12 days and the average condo sells in about 14 days. Condos have sped up sharply from last year, when they averaged 26 days.
How much over asking are San Francisco homes selling for?
Single-family homes are selling for about 31% over the original asking price on average, the highest in the three-year data. Condos are selling about 10% over asking, a record for condos in that same period.
How many homes are for sale in San Francisco?
There are about 229 single-family homes and 428 condos on the market. That is roughly 25% fewer single-family homes and 34% fewer condos than a year earlier, so buyers have fewer choices and more competition.
Is now a good time to sell a home in San Francisco?
Low inventory, fast sales and bids above asking price all favor sellers right now. Pricing a home correctly for your specific neighborhood matters most, so ask Kinoko for a custom valuation based on recent sales near you.
Kevin Gueco | CA DRE #01461677