
Updated November 20, 2026.
What’s Driving the North Bay’s Housing Market Right Now
North Bay Market at a Glance:
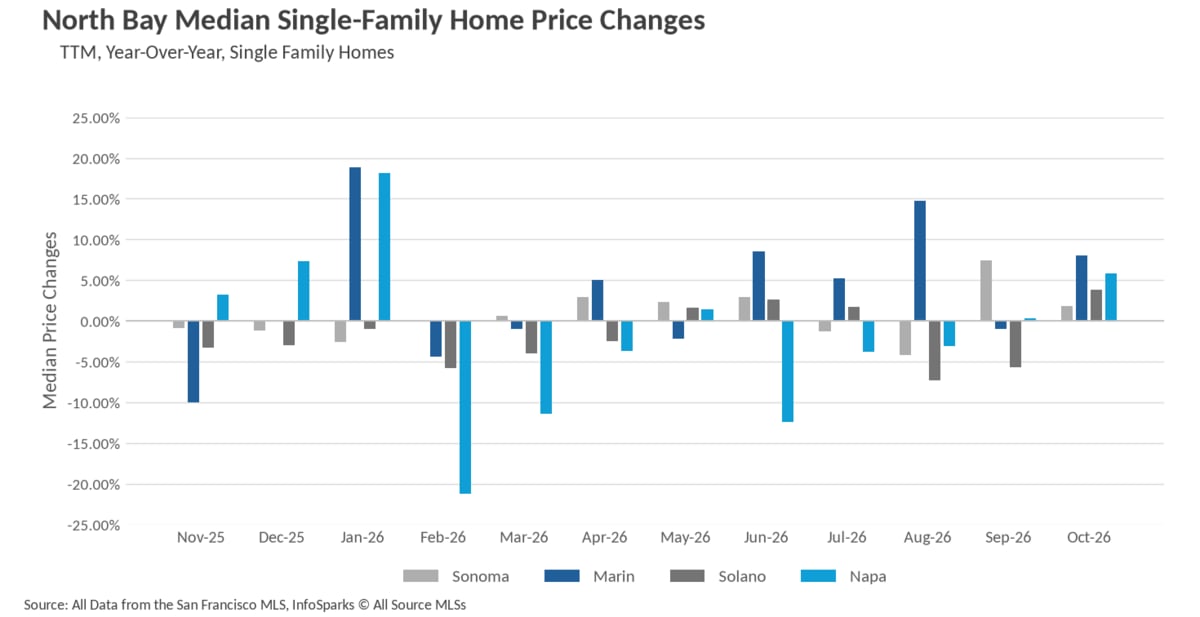
- Median single-family home prices climbed year-over-year in all four North Bay counties in October, led by Marin County's 8.03% gain to $1,850,000 and a Napa County rebound of 5.83%.
- Inventory tightened sharply, with single-family homes for sale down 24.22% from last October and new listings off 20.04%, the thinnest supply picture we have seen in this market in two years.
- Homes are selling faster than they were a year ago across every county, with Marin County single-family listings moving in a median of just 17 days, a 32% improvement year-over-year.
North Bay Housing Market Snapshot
Metric | Single-Family Homes | Condos |
|---|---|---|
Homes for sale | 2,657 | 379 |
Homes for sale vs. last year | 24.22% lower | 9.33% lower |
New listings | 734 | 78 |
Homes sold | 891 | 81 |
Single-Family Homes by County
Metric | Marin | Sonoma | Napa | Solano |
|---|---|---|---|---|
Median sale price | $1,850,000 | $830,000 | $952,500 | $620,000 |
Price change vs. last year | +8.03% | +1.84% | +5.83% | +3.85% |
Days on market | 17 | 37 | 49 | 39 |
Months of supply | 1.7 | 3.2 | 6.0 | 3.1 |
Condos by County
Metric | Marin | Sonoma | Napa | Solano |
|---|---|---|---|---|
Median sale price | $715,000 | $426,000 | $715,000 | $290,000 |
Price change vs. last year | +10% | +2.65% | -5.83% | -23.88% |
Days on market | 51 | 49 | 47 | 87 |
Months of supply | 3.5 | 4.8 | 7.4 | 4.5 |
*National Association of REALTORS® data is released two months behind, so we estimate the most recent month's data when possible and appropriate.
Home Prices in the North Bay: Median Sale Prices by County
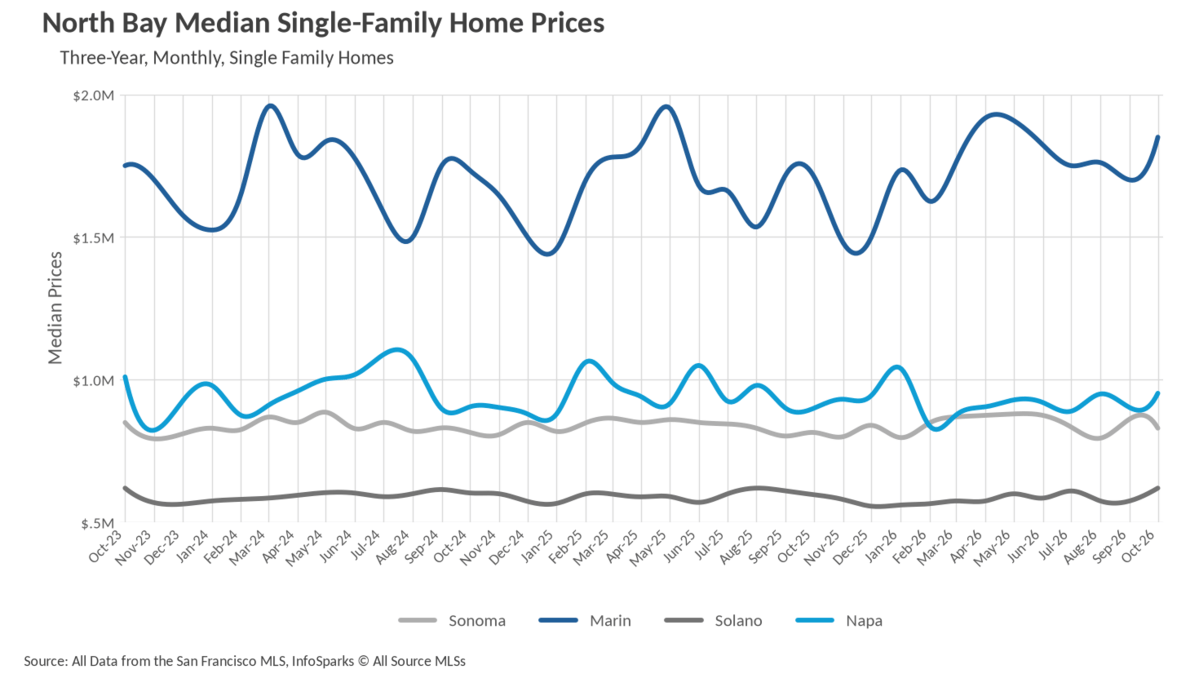
October delivered something the North Bay has not seen in a while: year-over-year price gains in every single county's single-family home market. Marin County again led the charge, with the median single-family home selling for $1,850,000, up 8.03% from last October and an 8.82% jump from September's $1,700,000. That marks Marin's strongest median since the spring peak. Napa County, which spent much of the past year as the region's weak spot, posted a 5.83% year-over-year gain to $952,500, its highest reading since January. Solano County rose 3.85% to $620,000, recovering from three consecutive months at $575,000 and matching its best level in over two years. Sonoma County was the most subdued performer, with the median at $830,000, up 1.84% from last October but down 3.71% from September's $862,000, continuing the choppy month-to-month pattern that has defined that county all year.
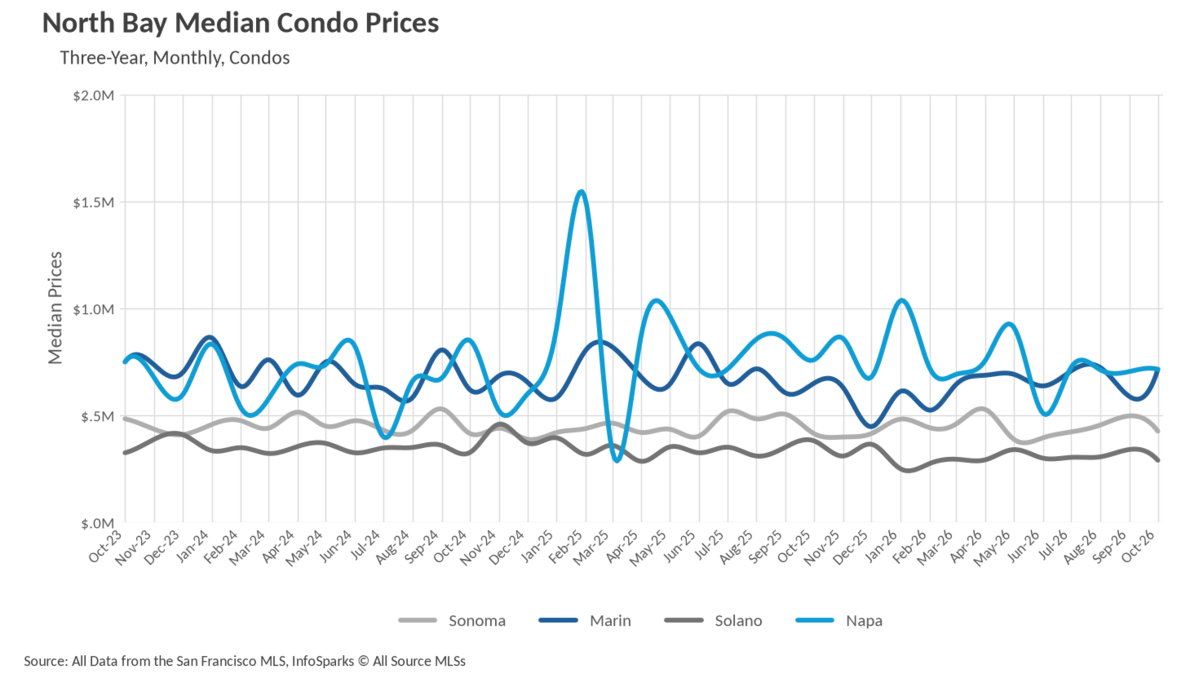
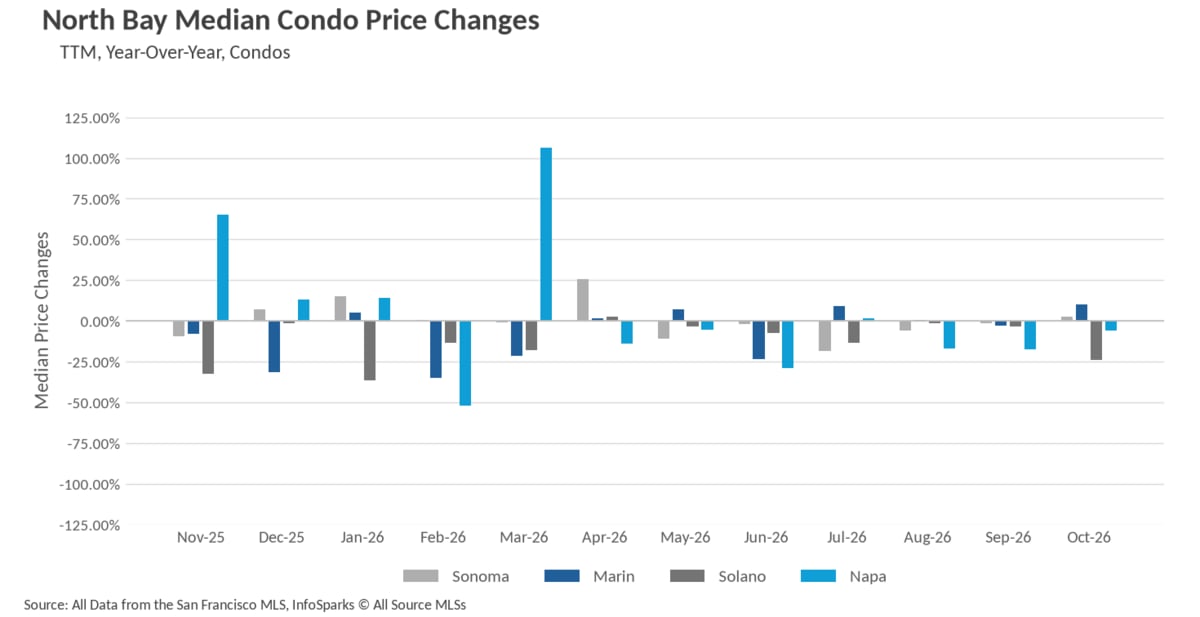
The condo market was more divided. Marin County condos gained 10% year-over-year to a median of $715,000, and Sonoma County edged up 2.65% to $426,000. Napa County condos slipped 5.83% to $715,000, while Solano County took the hardest hit, falling 23.88% to $290,000. Solano's condo segment has now spent most of 2026 below the $310,000 mark, a meaningful step down from where it traded a year ago.
North Bay Housing Inventory and New Listings
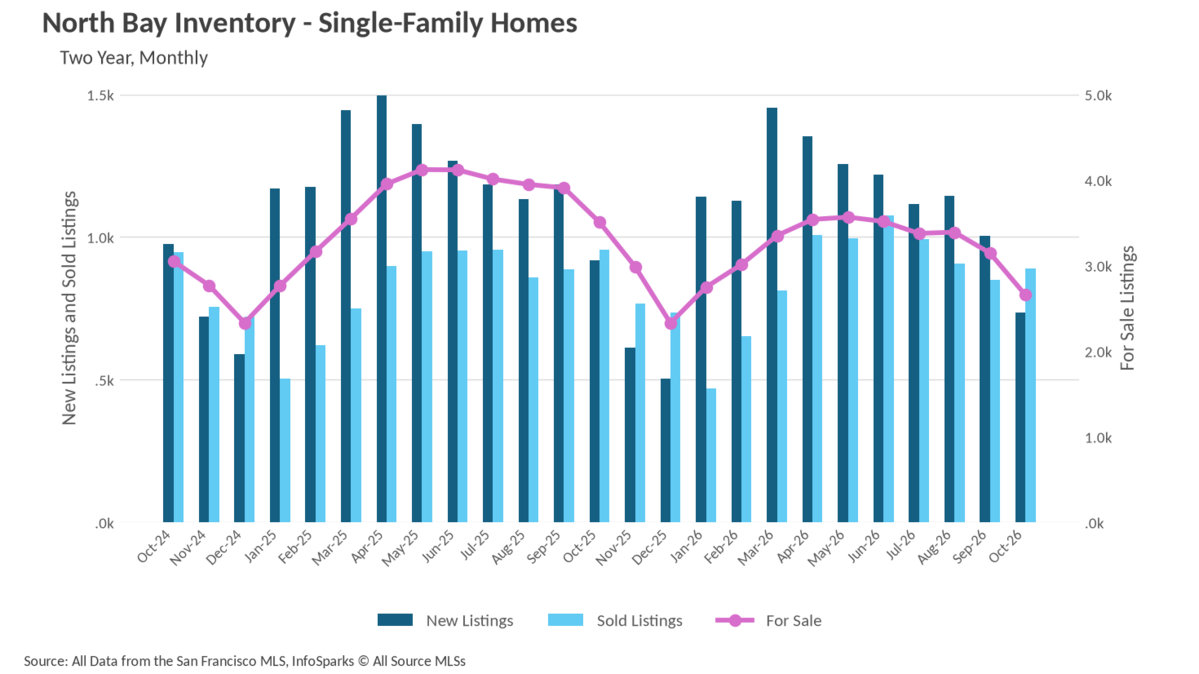
The inventory story turned decisively tighter in October. Single-family homes for sale across the North Bay fell to 2,657 units, a 24.22% decline from the 3,506 available last October and a steep 15.57% drop from September alone. This is the lowest for-sale count in the region since December 2025 and reflects both seasonal withdrawal and a genuine pullback in new supply. New single-family listings totaled 734 in October, down 20.04% year-over-year and down from 1,003 in September.
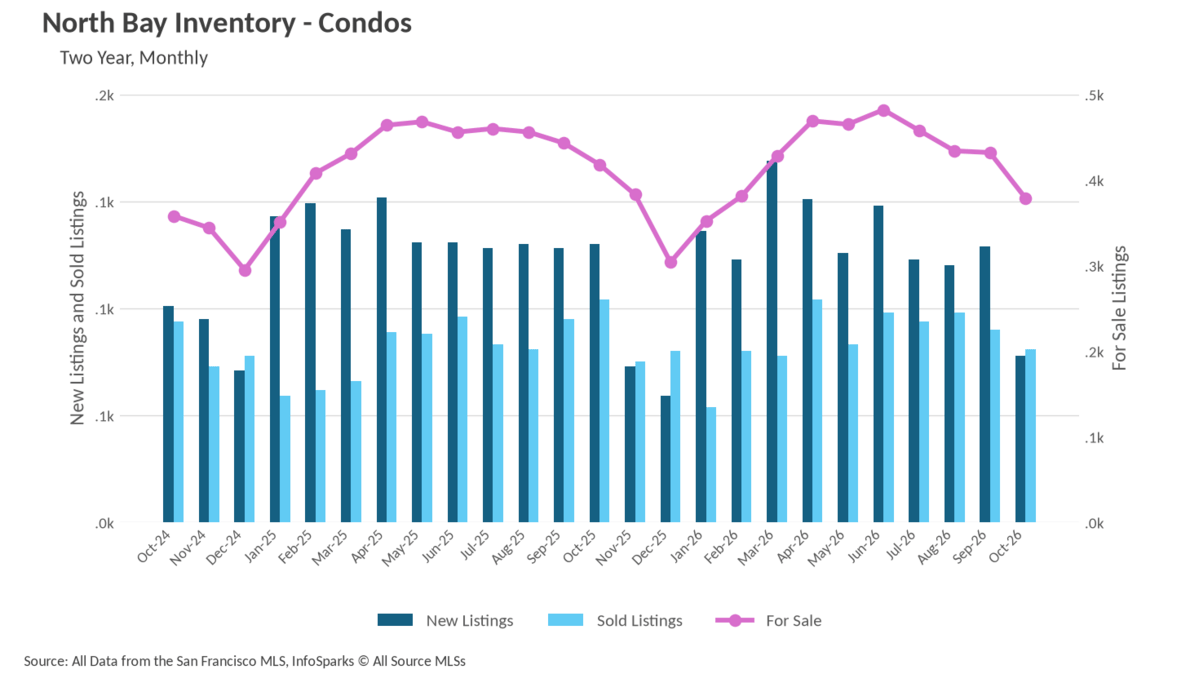
Condo inventory followed the same path, falling to 379 units for sale, a 9.33% year-over-year decline, with new condo listings dropping a striking 40% from last October to just 78. Sales volume held up reasonably well against this backdrop. Single-family closings came in at 891, off 6.8% from last October's 956, while condo sales totaled 81, down 22.12%. The key takeaway is that supply is contracting considerably faster than demand, which explains why prices firmed up even as the calendar turned toward winter.
How Fast Homes Sell in the North Bay: Days on Market
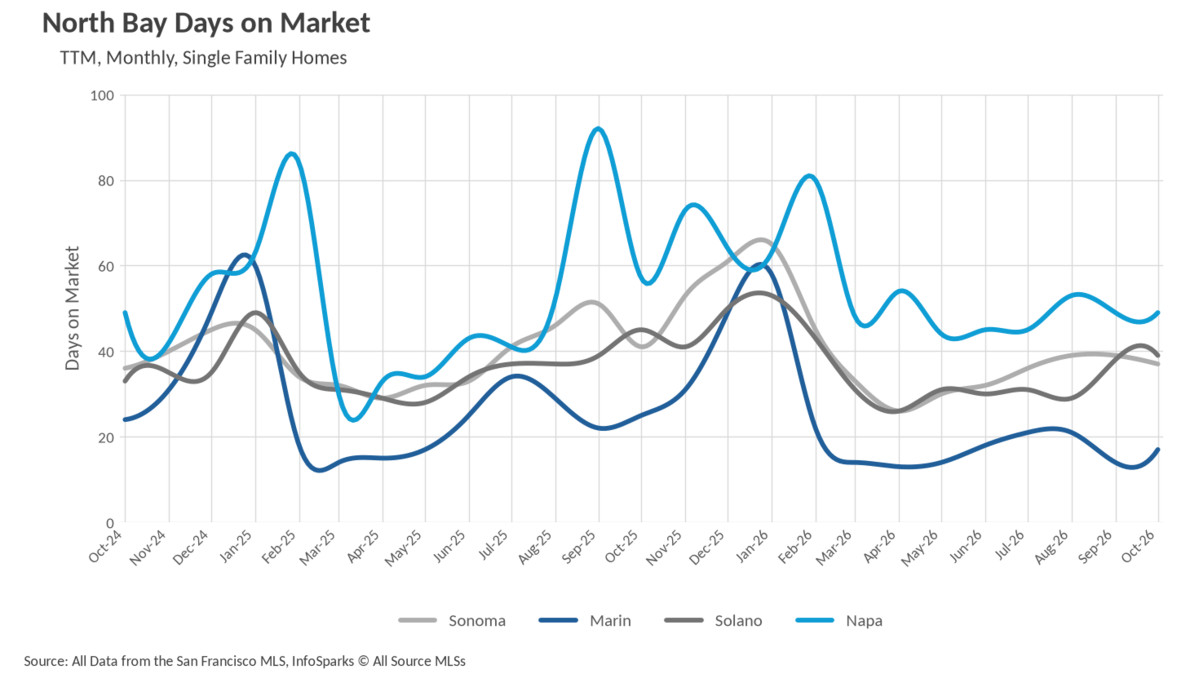
Sales velocity improved across the board for single-family homes. Marin County remains the standout, with a median of 17 days on market, a 32% improvement from the 25 days recorded last October and a continuation of the remarkably brisk pace Marin has maintained since spring. Napa County cut its median to 49 days, down 14.04% from 57 days a year ago, while Solano County came in at 39 days, a 13.33% improvement. Sonoma County logged 37 days, down 9.76% year-over-year, though both Solano and Sonoma ticked up modestly from their summer lows as seasonal momentum eased.
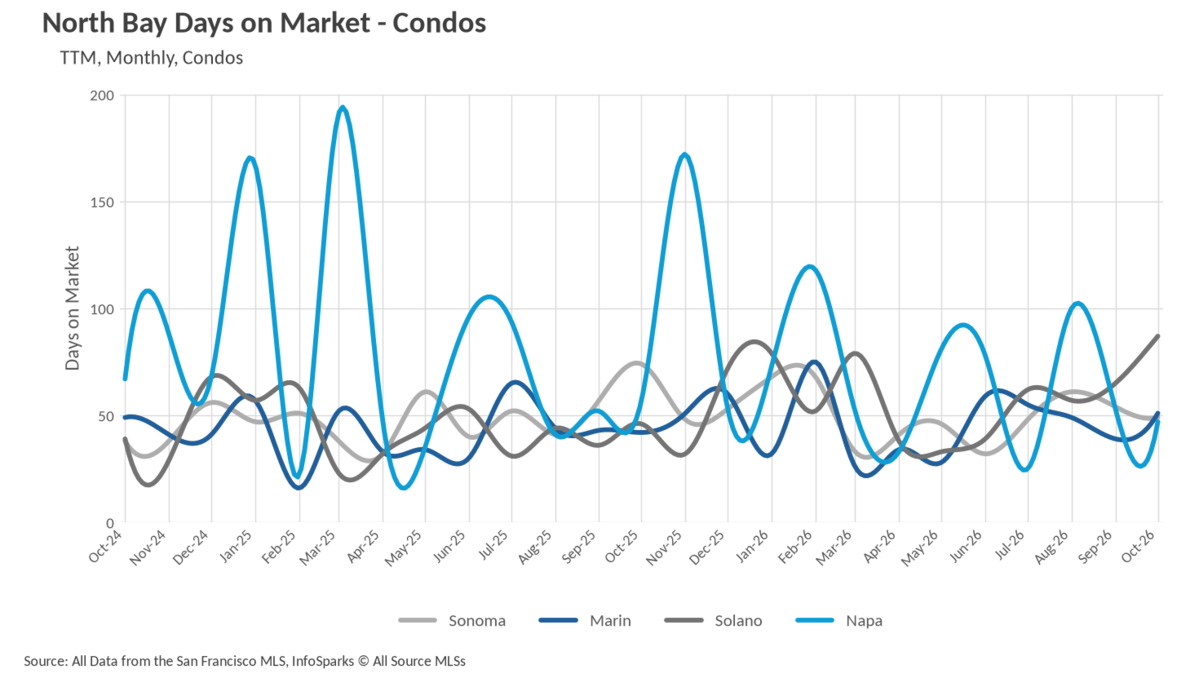
Condos told a more complicated story. Sonoma County condos improved dramatically, selling in a median of 49 days versus 74 last October, a 33.78% gain, and Napa County condos moved in 47 days, down 17.54%. On the other side, Marin County condos stretched to 51 days from 42 a year ago, up 21.43%, and Solano County condos saw the sharpest deterioration, at 87 days compared to 46 last October. That near-doubling in Solano is consistent with the price weakness in that segment and signals a buyer pool that is being selective.
Is the North Bay a Buyer’s or Seller’s Market?
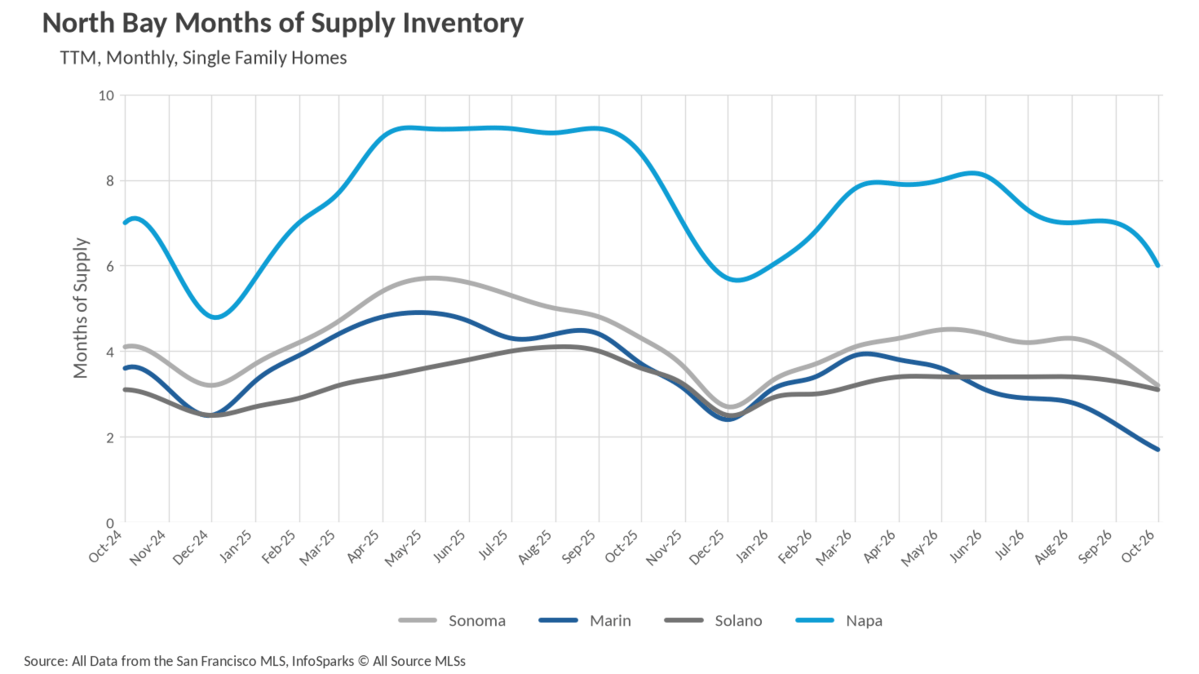
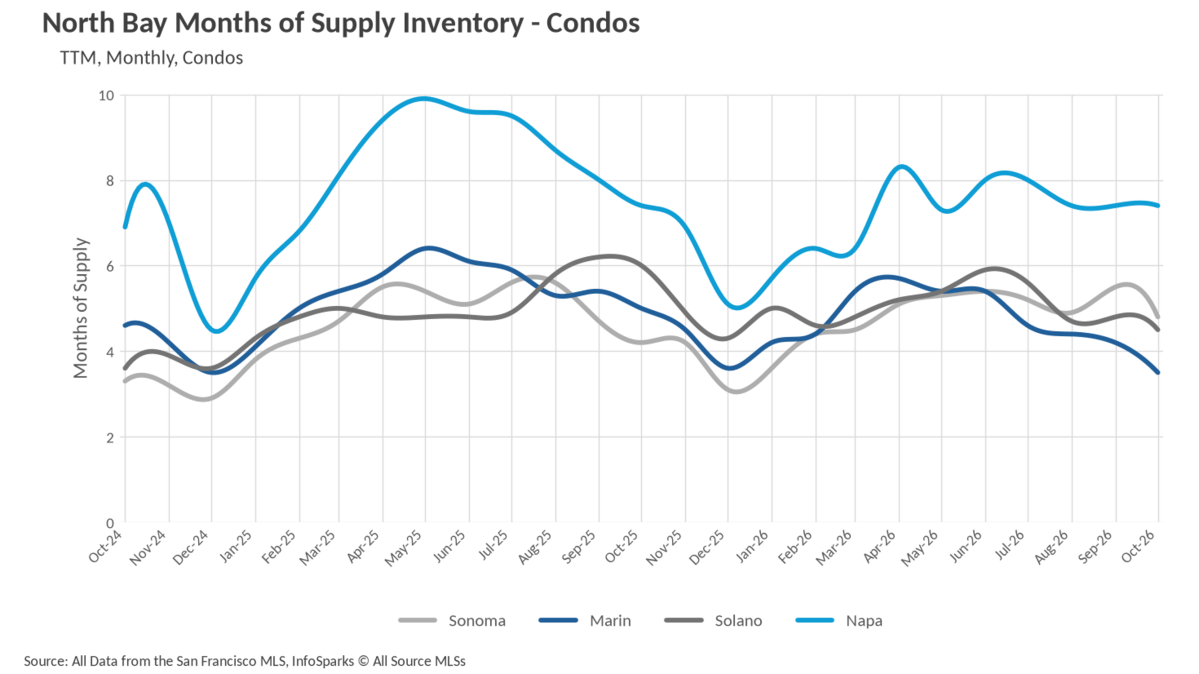
When determining whether a market is a buyers’ market or a sellers’ market, we look to the Months of Supply Inventory (MSI) metric. The state of California has historically averaged around three months of MSI, so any area with at or around three months of MSI is considered a balanced market. Any market that has lower than three months of MSI is considered a seller’s market, whereas markets with more than three months of MSI are considered buyers’ markets.
October's inventory contraction pushed the region's single-family market meaningfully toward sellers. Marin County now sits at just 1.7 months of supply, down 54.05% from 3.7 months last October and a full point below where it stood in September, making it the tightest seller's market in the North Bay by a wide margin. Solano County is right at the balance point with 3.1 months, a 13.89% year-over-year improvement, and Sonoma County has nearly joined it at 3.2 months, down from 4.3 months last October. Napa County remains a buyers' market at 6.0 months of supply, but that represents a 30.23% improvement year-over-year and the county's lowest reading since December 2025, which helps explain the median price recovery there.
Condos remain friendlier to buyers. Marin County condos tightened to 3.5 months, down 30% from 5.0 months a year ago and the closest that segment has come to balance all year. Solano County condos improved to 4.5 months from 6.0 months, and Sonoma County condos actually loosened slightly to 4.8 months, up 14.29% year-over-year. Napa County condos held flat at 7.4 months, unchanged from last October and firmly in buyers' territory. Taken together, October handed sellers of single-family homes a stronger hand than they held at any point this year, while condo buyers, particularly in Napa and Sonoma, still have room to negotiate.
Thinking about selling? Find out what your home is worth with a free home valuation or read our guide for sellers. Planning to buy? Start with our buyer resources and explore our Bay Area neighborhood and city guides, including Marin County, to see how conditions differ town by town. For a broader look at the region, see our Bay Area and San Francisco market updates.
North Bay Housing Market Data: 12-Month Trends
Frequently Asked Questions About the North Bay Housing Market
What is the median home price in the North Bay?
Based on the latest data, the median single-family sale price is $1,850,000 in Marin County, $952,500 in Napa County, $830,000 in Sonoma County and $620,000 in Solano County. Median condo prices are $715,000 in Marin, $715,000 in Napa, $426,000 in Sonoma and $290,000 in Solano. Single-family prices are up from a year earlier in all four counties, while condo prices are up in Marin and Sonoma and down in Napa and Solano.
Is the North Bay a buyer's or seller's market?
It depends on the county. A market with about three months of supply is considered balanced, and fewer months favors sellers. For single-family homes, Marin County (1.7 months) is a seller's market, Solano County (3.1 months) and Sonoma County (3.2 months) are close to balanced, and Napa County (6.0 months) is a buyer's market. Condos have more supply, ranging from 3.5 months in Marin to 7.4 months in Napa.
How long does it take to sell a home in the North Bay?
Single-family homes are selling in about 17 days in Marin County, 37 days in Sonoma County, 39 days in Solano County and 49 days in Napa County. Condos range from about 47 days in Napa to 87 days in Solano.
Are fewer homes being listed for sale in the North Bay?
Yes. There were 734 new single-family listings in October, down about 20% from a year earlier, and 78 new condo listings, down 40%. Supply is contracting faster than demand, so buyers are competing for a smaller pool of homes.
How many homes are for sale in the North Bay?
There are about 2,657 single-family homes and 379 condos on the market across the North Bay. That is roughly 24% fewer single-family homes and 9% fewer condos than a year earlier.
Is now a good time to sell a home in the North Bay?
Sellers of single-family homes hold a stronger hand than at any point this year, especially in Marin County, where supply is just 1.7 months. Condo buyers, particularly in Napa and Sonoma, still have room to negotiate. Pricing a home correctly for your specific town matters most, so ask Kinoko for a custom valuation based on recent sales near you.
Kevin Gueco | CA DRE #01461677