Updated November 20, 2026.
What’s Driving the East Bay’s Housing Market Right Now
East Bay Market at a Glance:
- Alameda County condos are the standout story, with the median sale price jumping more than 10% year over year to its highest level since spring 2025.
- Single-family home inventory finished October nearly 15% below last year, and active listings have now fallen for four consecutive months.
- Homes continue to move quickly, with single-family listings selling in roughly two weeks and Contra Costa condo times improving by more than half compared to last October.
East Bay Housing Market Snapshot
Metric | Single-Family Homes | Condos |
|---|---|---|
Homes for sale | 2,557 | 883 |
Homes for sale vs. last year | 14.65% lower | 10.99% lower |
New listings | 1,573 | 372 |
Homes sold | 1,254 | 236 |
Single-Family Homes by County
Metric | Alameda | Contra Costa |
|---|---|---|
Median sale price | $1,250,000 | $863,963 |
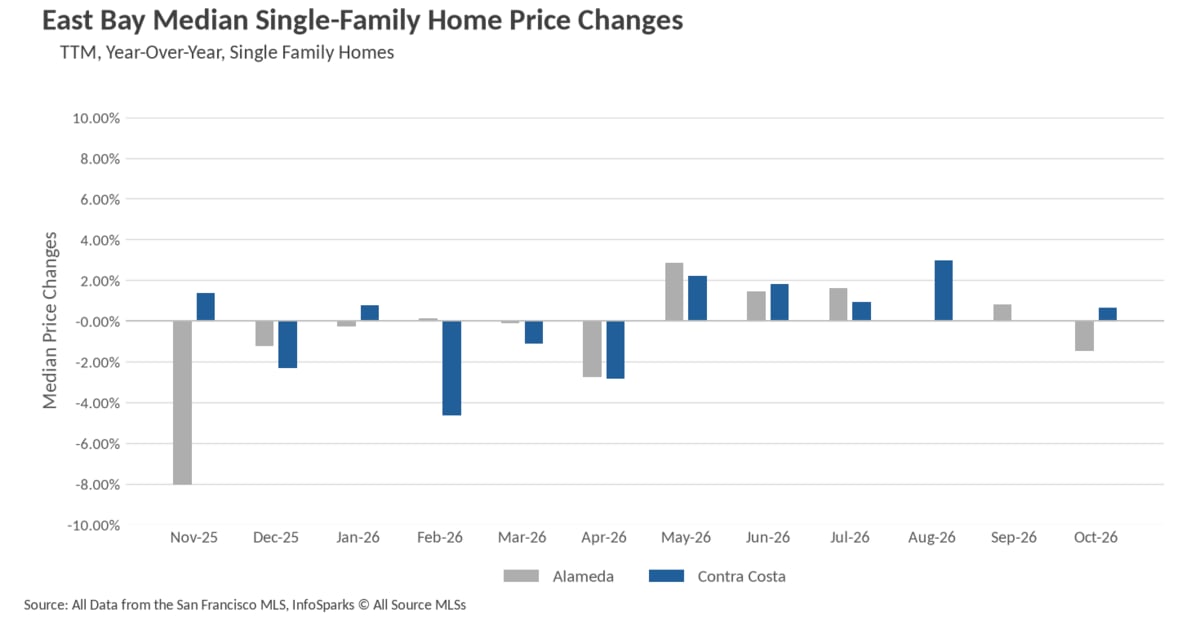
Price change vs. last year | -1.50% | +0.64% |
Days on market | 14 | 17 |
Months of supply | 1.9 | 2.3 |
Condos by County
Metric | Alameda | Contra Costa |
|---|---|---|
Median sale price | $610,500 | $462,000 |
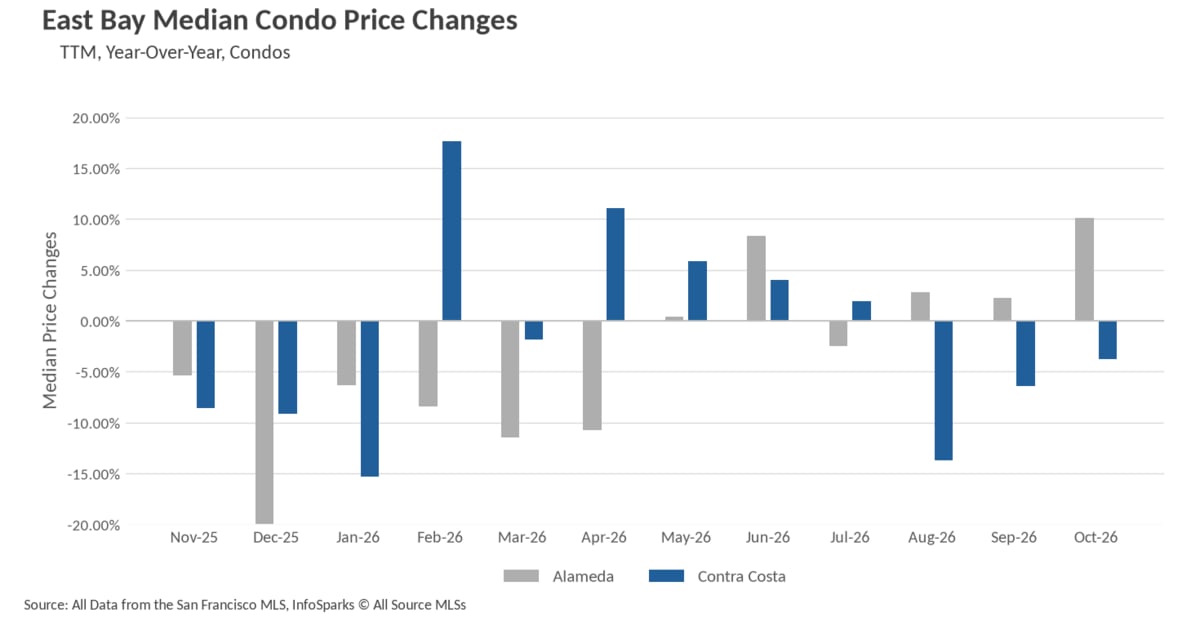
Price change vs. last year | +10.10% | -3.75% |
Days on market | 29 | 20 |
Months of supply | 3.9 | 4.0 |
*National Association of REALTORS® data is released two months behind, so we estimate the most recent month's data when possible and appropriate.
Home Prices in the East Bay: Median Sale Prices by County
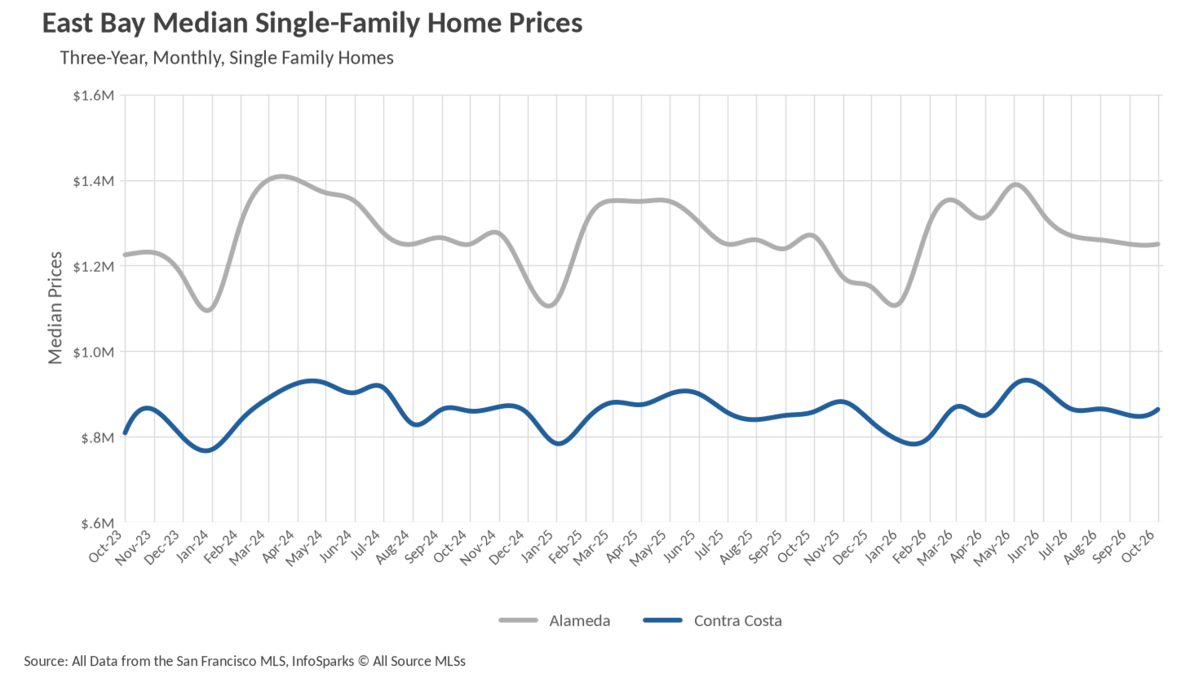
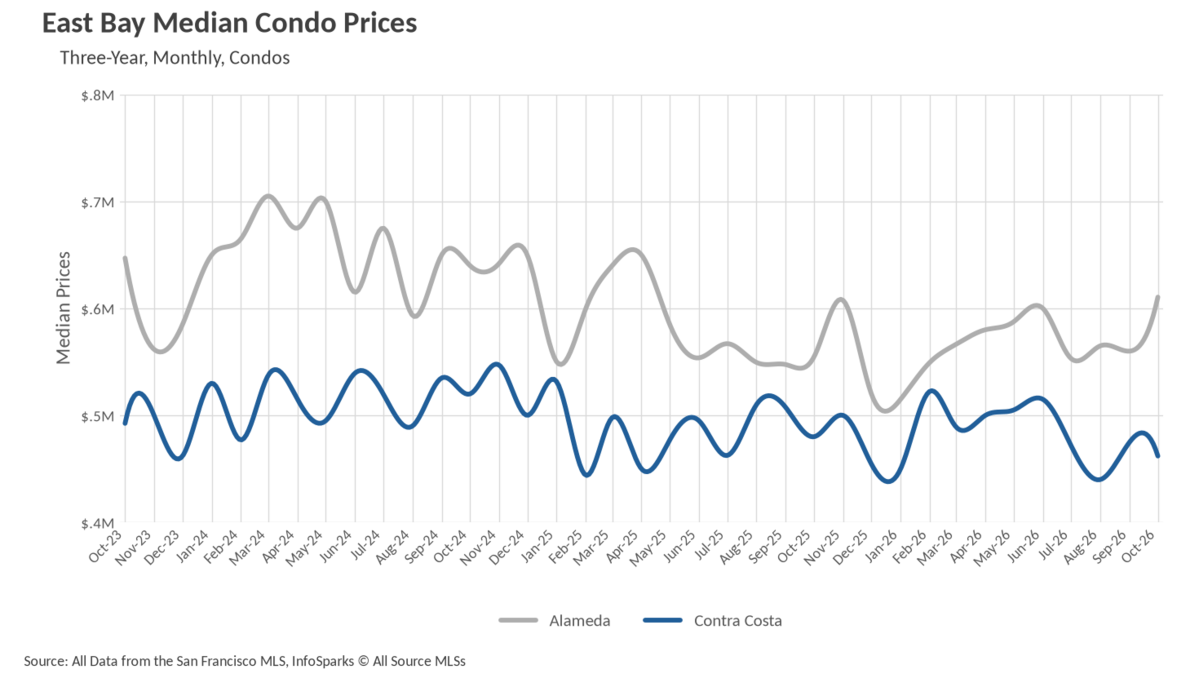
October produced a split picture across the East Bay, with the condo market in Alameda County grabbing the headlines. The median Alameda County condo sold for $610,500, a 10.10% increase on a year-over-year basis and a 9.02% jump from September's $560,000. That is the strongest reading since April 2025 and continues a recovery that has been building steadily since the market bottomed near $515,000 in January.
Single-family homes in Alameda County, by contrast, held flat at a median of $1,250,000 for the second straight month, which works out to a modest 1.50% decline from the $1,269,000 recorded last October. Contra Costa County single-family homes edged higher, with the median at $863,963, up 1.64% from September and essentially even with last year at a gain of 0.64%.
The one soft spot was the Contra Costa condo market, where the median slipped to $462,000, down 2.74% from September and 3.75% below last October. Taken together, the region looks stable rather than surging, with Alameda condos supplying most of the upward momentum.
East Bay Housing Inventory and New Listings
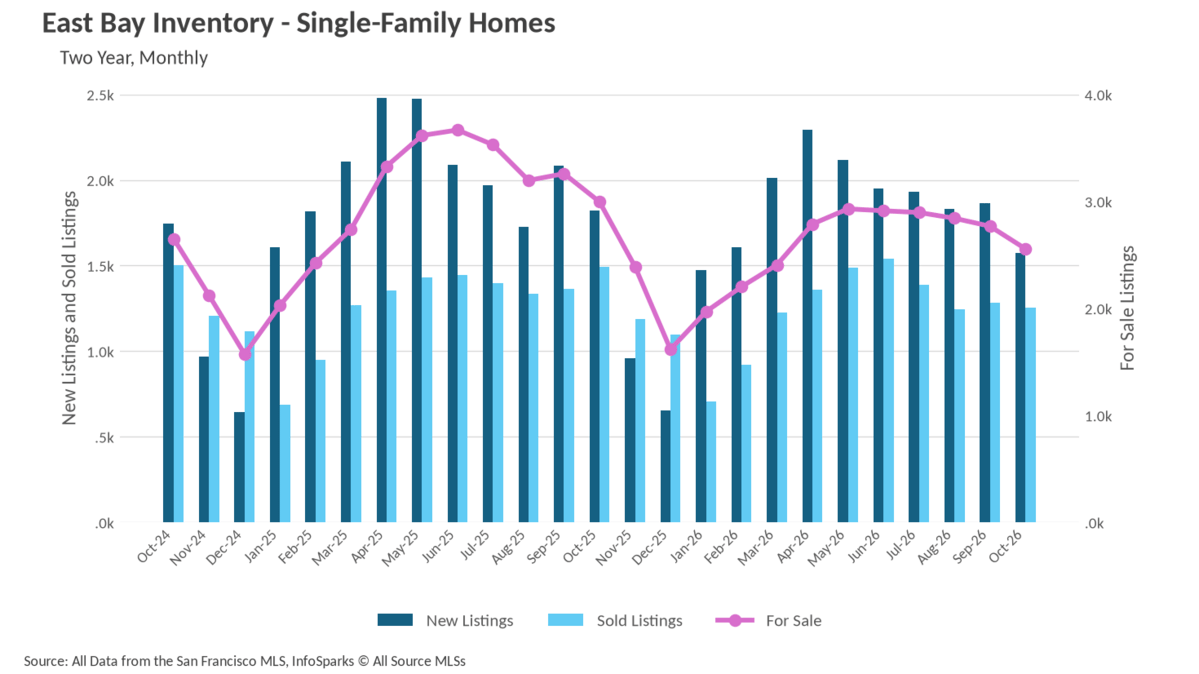
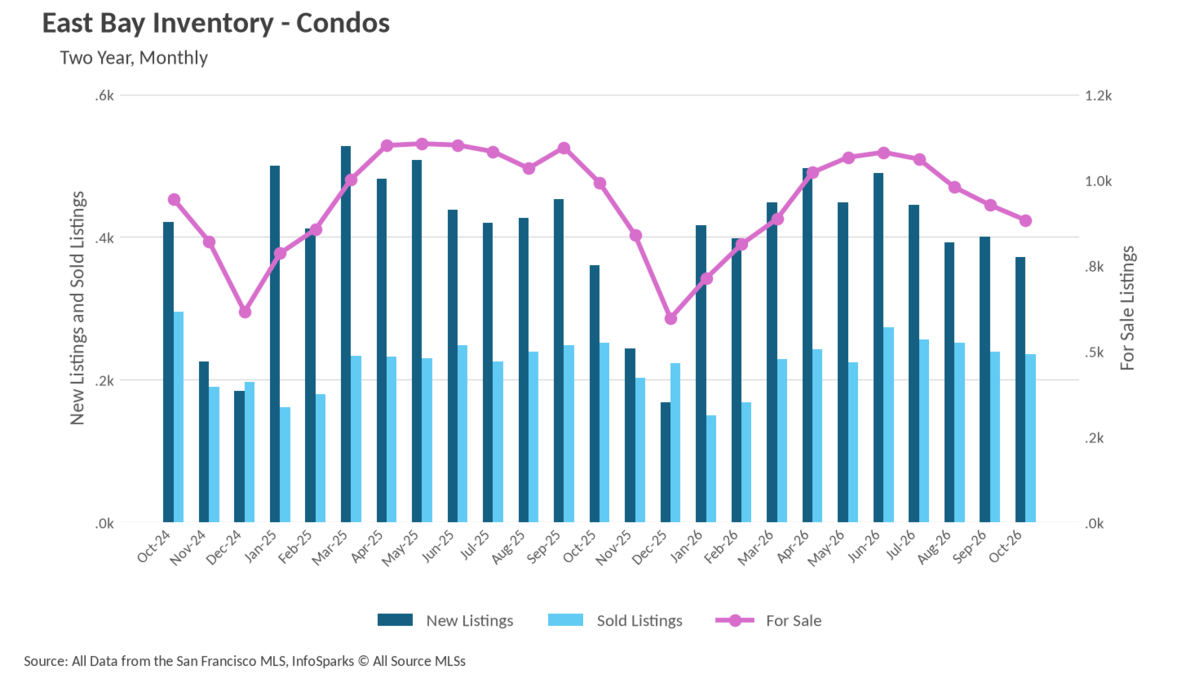
Inventory continues to tighten across the East Bay. Active single-family listings stood at 2,557 at the end of October, down 7.62% from September and 14.65% below the 2,996 homes available a year ago. That marks the fourth consecutive monthly decline from the summer peak near 2,930 units in May. New single-family listings also pulled back meaningfully, with 1,573 homes hitting the market in October compared to 1,821 last year, a 13.62% drop.
The condo side told a similar story on the active side, with 883 units for sale, down 4.75% month over month and 10.99% below last October's 992. Interestingly, condo sellers were slightly more active than a year ago, as new condo listings rose 3.33% to 372.
Sales volume moderated as well, with 1,254 single-family closings in October, 16.06% fewer than last year, and 236 condo closings, down 6.35%. The key takeaway is that supply is contracting faster than demand, which is what keeps prices from slipping further as the market heads into winter.
How Fast Homes Sell in the East Bay: Days on Market
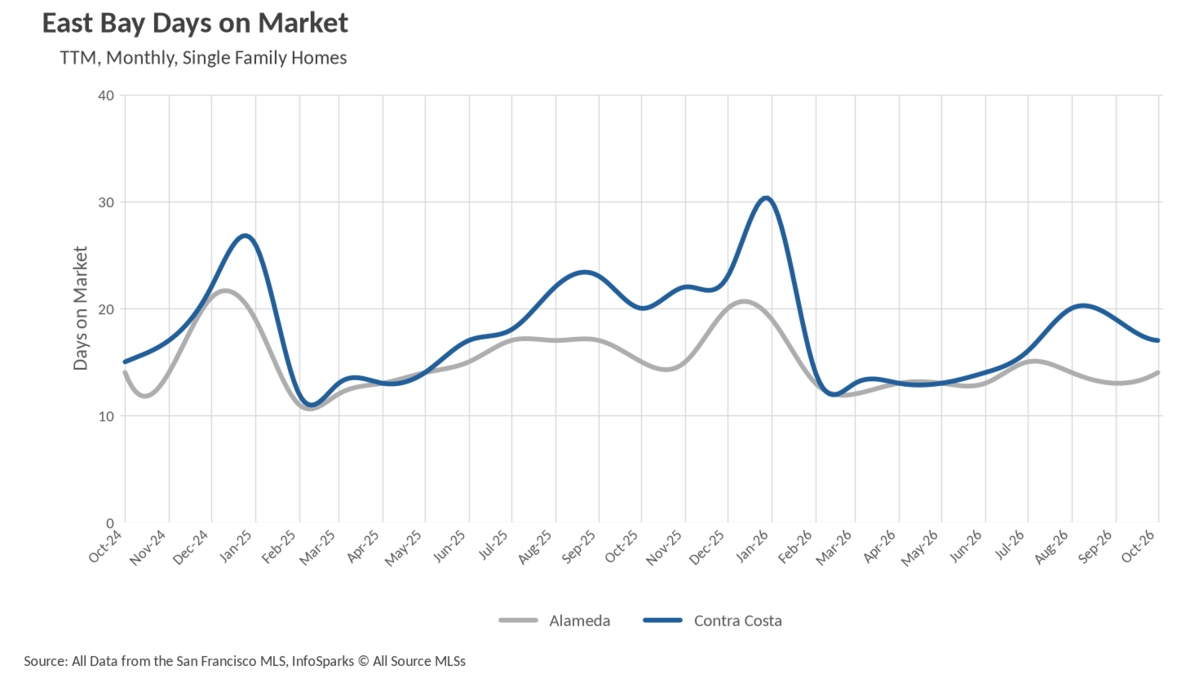
Days on market continue to compare favorably to last year across every segment. The average single-family home in Alameda County sold in 14 days, a 6.67% improvement over the 15 days recorded last October and right in line with the 13 to 15 day range that has defined the county all year. Contra Costa County saw a sharper gain, with the average single-family listing selling in 17 days versus 20 last year, a 15.00% year-over-year improvement, and the third straight month of faster sales after August's 20 days.
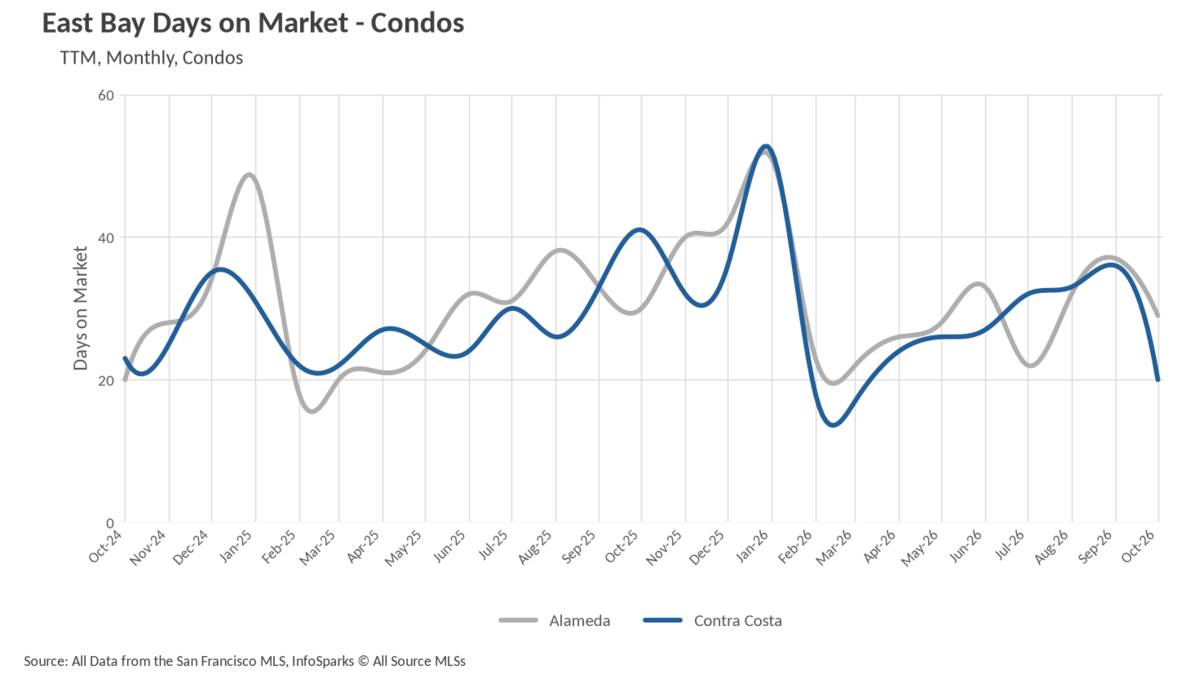
Condos are taking longer, as they typically do, but the trend is encouraging. Alameda County condos averaged 29 days, down from 37 in September and a shade better than the 30 days posted last October. The biggest swing came in Contra Costa County, where condos sold in an average of just 20 days compared to 41 days a year ago, a 51.22% improvement and the fastest pace that segment has recorded in the past two years.
Is the East Bay a Buyer’s or Seller’s Market?
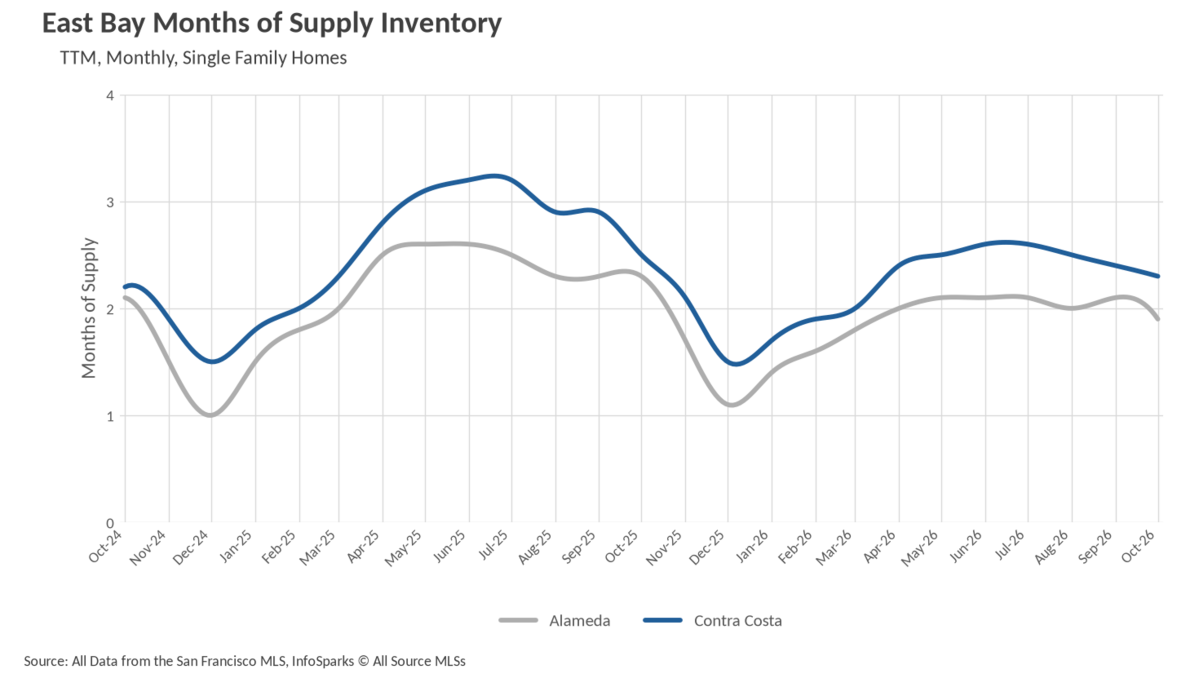
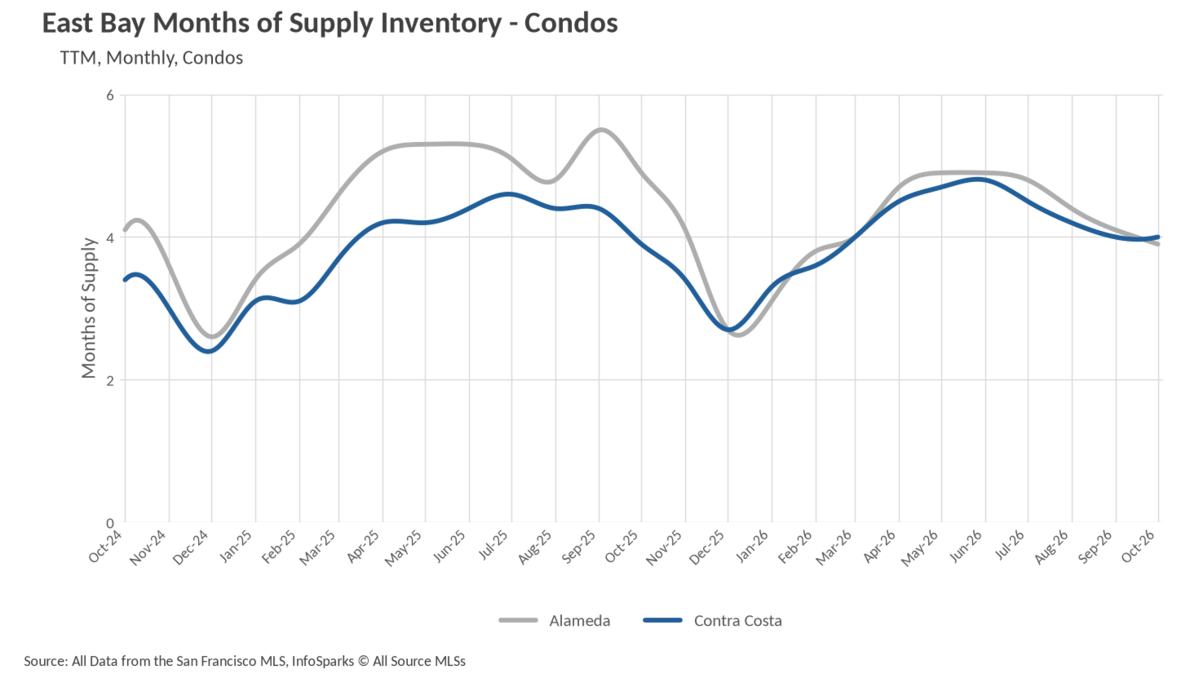
When determining whether a market is a buyers’ market or a sellers’ market, we look to the Months of Supply Inventory (MSI) metric. The state of California has historically averaged around three months of MSI, so any area with at or around three months of MSI is considered a balanced market. Any market that has lower than three months of MSI is considered a seller’s market, whereas markets with more than three months of MSI are considered buyers’ markets.
The East Bay single-family market remains comfortably in seller's territory. Alameda County closed October with 1.9 months of supply, down from 2.1 in September and 17.39% below the 2.3 months recorded last October. Contra Costa County sits at 2.3 months, a 8.00% year-over-year improvement from 2.5 months and the lowest reading since last December. Both counties have been grinding lower since midsummer, which reinforces the idea that buyers will continue facing competition for well-priced homes.
The condo market still leans toward buyers, though the gap is narrowing. Alameda County finished October at 3.9 months of supply, down 20.41% from 4.9 months a year ago and the tightest level since January, putting that market within striking distance of balance. Contra Costa condos held at 4.0 months, essentially flat with last year's 3.9 months, leaving that segment as the one corner of the East Bay where buyers retain clear negotiating leverage.
Thinking about selling? Find out what your home is worth with a free home valuation or read our guide for sellers. Planning to buy? Start with our buyer resources and explore our Bay Area neighborhood and city guides to see how conditions differ town by town. For a broader look at the region, see our Bay Area and San Francisco market updates.
East Bay Housing Market Data: 12-Month Trends
Frequently Asked Questions About the East Bay Housing Market
What is the median home price in the East Bay?
Based on the latest data, the median single-family sale price is $1,250,000 in Alameda County and $863,963 in Contra Costa County. Median condo prices are $610,500 in Alameda and $462,000 in Contra Costa. Single-family prices are close to last year's levels in both counties, while Alameda County condo prices are up about 10%.
Is the East Bay a buyer's or seller's market?
For single-family homes, the East Bay is a seller's market. A market with about three months of supply is considered balanced, and fewer months favors sellers. Alameda County has 1.9 months of supply and Contra Costa County has 2.3 months. Condos still lean toward buyers, with 3.9 months of supply in Alameda, close to balanced, and 4.0 months in Contra Costa.
How long does it take to sell a home in the East Bay?
Single-family homes average 14 days in Alameda County and 17 days in Contra Costa County, both faster than a year ago. Condos average 29 days in Alameda and 20 days in Contra Costa, where condo sales are moving much faster than the 41 days of a year ago.
Are fewer homes being listed for sale in the East Bay?
For single-family homes, yes. New single-family listings totaled 1,573 in October, about 14% fewer than a year earlier, while new condo listings rose about 3% to 372. Overall, supply is contracting faster than demand, which helps support prices.
How many homes are for sale in the East Bay?
There are about 2,557 single-family homes and 883 condos for sale across the East Bay. That is roughly 15% fewer single-family homes and 11% fewer condos than a year earlier.
Is now a good time to sell a home in the East Bay?
Single-family sellers remain in control, and buyers continue to face competition for well-priced homes. Contra Costa condos are the one segment where buyers still have clear negotiating leverage. Pricing a home correctly for your specific area matters most, so ask Kinoko for a custom valuation based on recent sales near you.
Kevin Gueco | CA DRE #01461677